More Forza Motorsport Games Seem Unlikely as Team Shuts Down
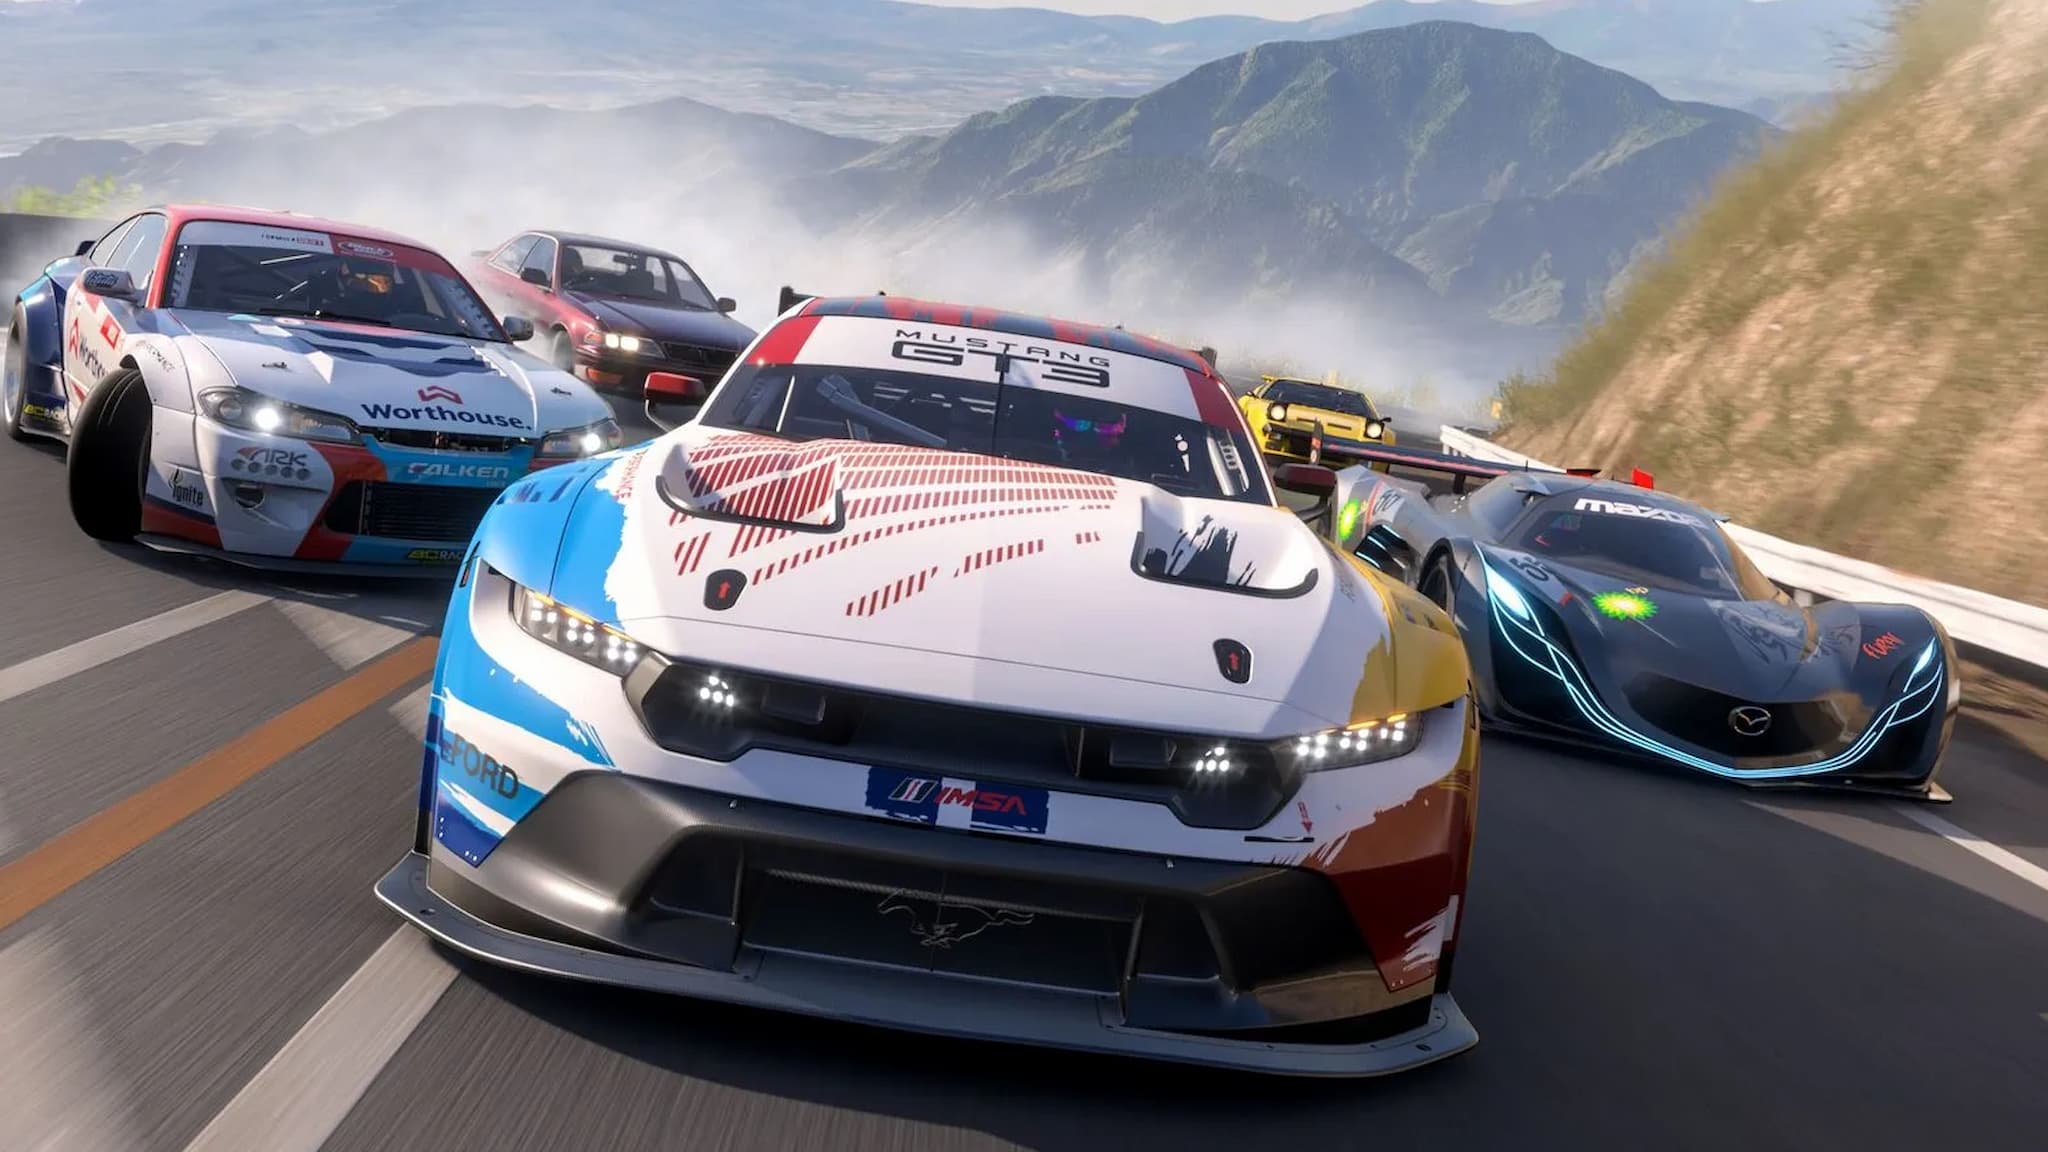
Despite the widespread appeal of racing games like Horizon, some enthusiasts have continued to appreciate the intense, simulation-focused experience provided by Forza Motorsport. Sony’s Gran Turismo and Forza Motorsport cater to a similar audience on their respective platforms, offering an immersive, realistic racing experience. While Horizon has gained popularity for its accessibility, Forza Motorsport has maintained a dedicated fanbase. However, the future of Forza Motorsport is uncertain following significant layoffs at Turn 10 Studios.