Ultimate Spider-Man Announces Final Issue (And It’s Coming Soon)
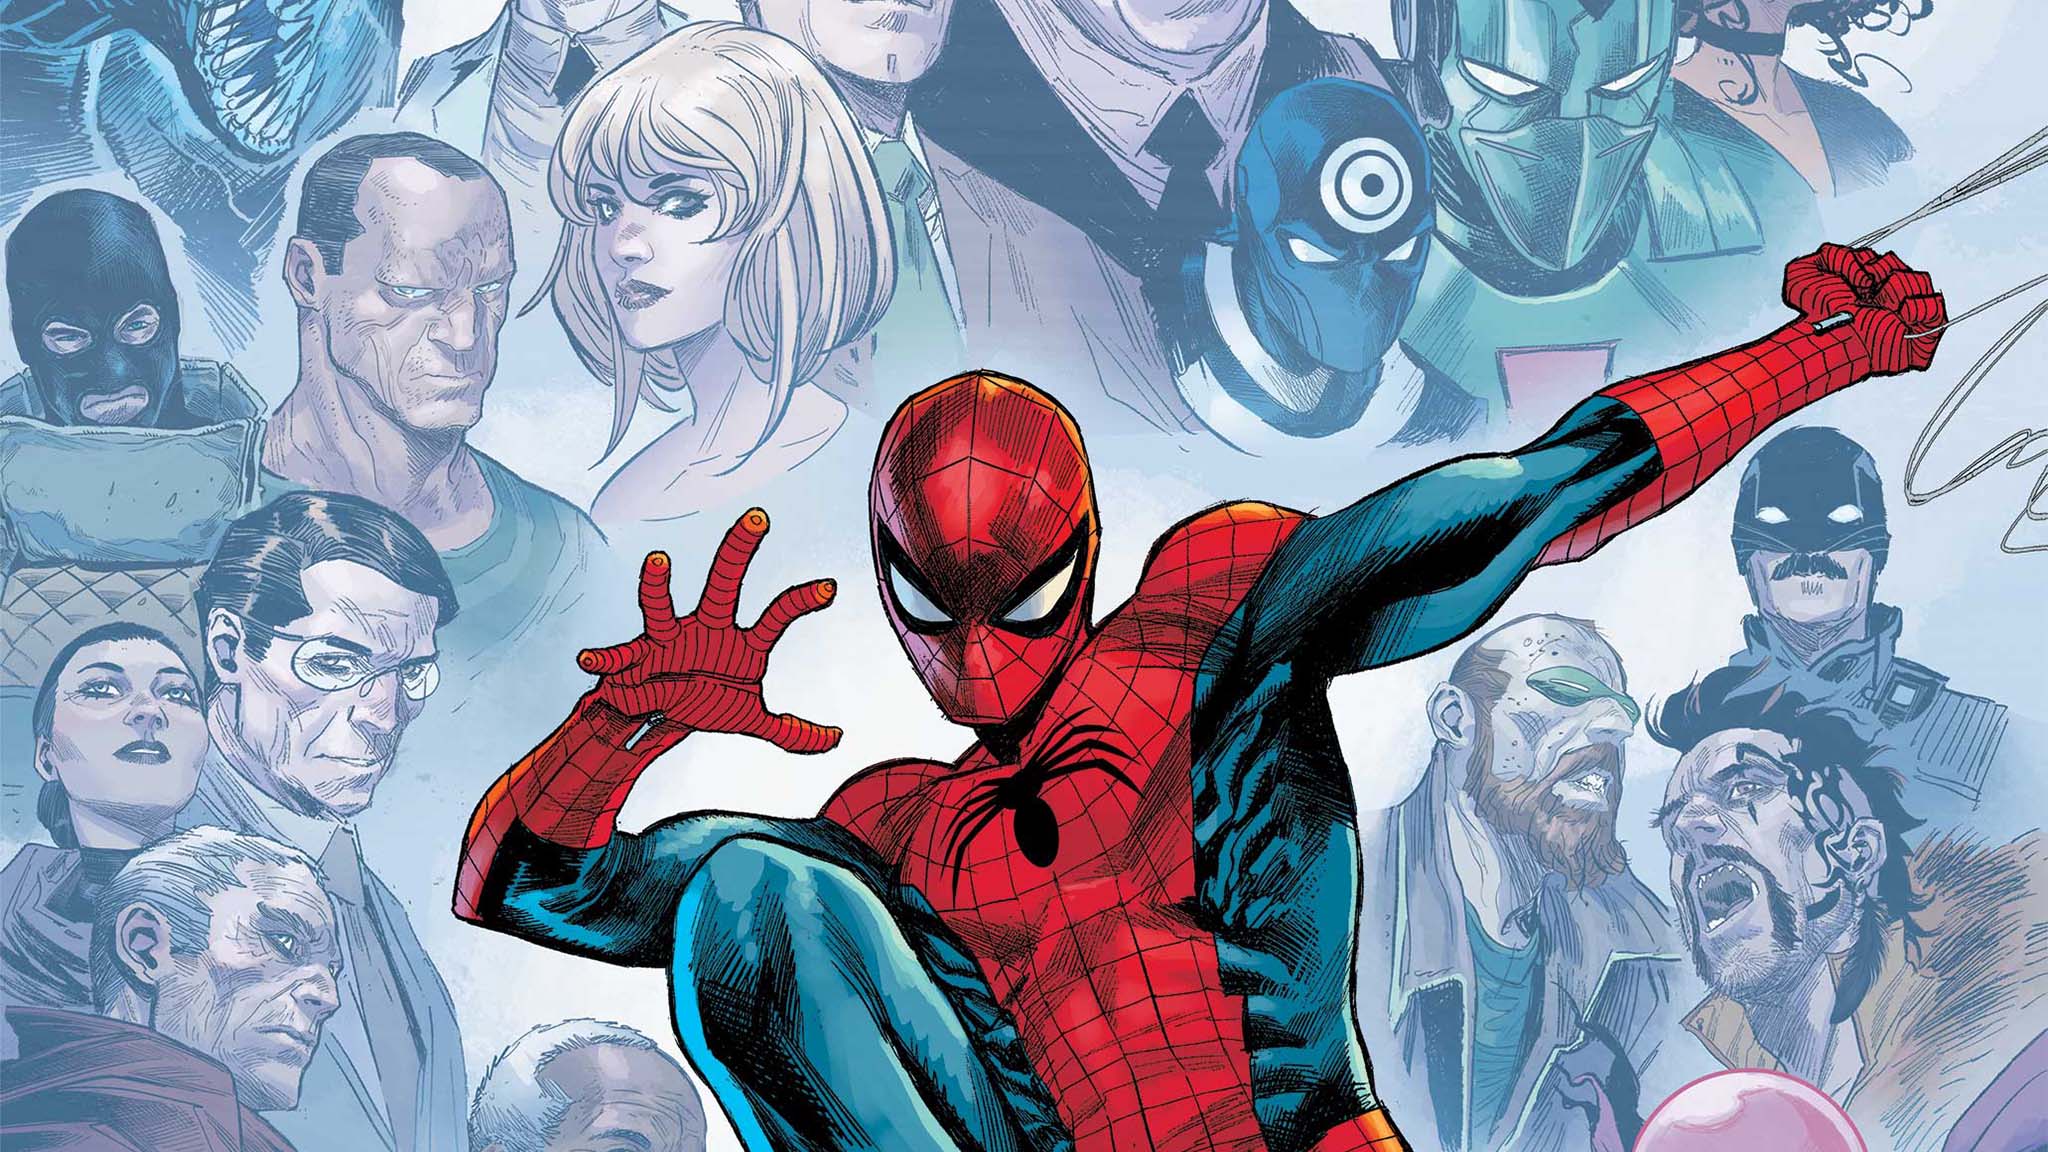
At San Diego Comic-Con during the Marvel Comics: Ultimate Universe Panel, it was confirmed by writer Jonathan Hickman, Editor-in-Chief C.B. Cebulski, Ultimate Editor Wil Moss, Ultimates writer Deniz Camp, and Ultimate Wolverine writer Chris Condon that December’s issue 24 of Ultimate Spider-Man will mark the end of the series.