- Dogecoin‘s price is clinging to $0.185 – A historically strong support level
- Momentum indicators suggest a potential rebound, but DOGE needs to clear $0.217 to confirm bullish strength
🐶 Dogecoin [DOGE] is currently at a critical crossroads, hovering above a key support level that has historically dictated its price movements. At the time of writing, DOGE was trading at around $0.205, bouncing back slightly from its recent lows. The big question is whether this support can hold and lead to a recovery or if further downside awaits. This analysis will examine potential price movements based on historical trends and technical indicators.
DOGE’s support level and historical significance
📈 Dogecoin’s long-term chart highlights $0.185 as a critical support level. Historically, DOGE has tested this level multiple times, bouncing back into an uptrend when buyers stepped in. This area also seems to be in line with a key Fibonacci retracement zone, reinforcing its importance.
📉 If DOGE maintains this support, it could signal renewed bullish momentum. However, a breakdown below $0.185 might trigger further losses, with potential downside targets around $0.15 and $0.12 based on its prior price action.
Short-term outlook – Can DOGE reverse the downtrend?
In fact, the memecoin’s latest price action reveals that DOGE has been attempting to stabilize after a prolonged downtrend.
For example – The latest DOGE/USD 12-hour chart highlights key technical levels that traders are watching. The 50-day and 200-day moving averages hint at a bearish trend, but momentum indicators allude to potential relief.
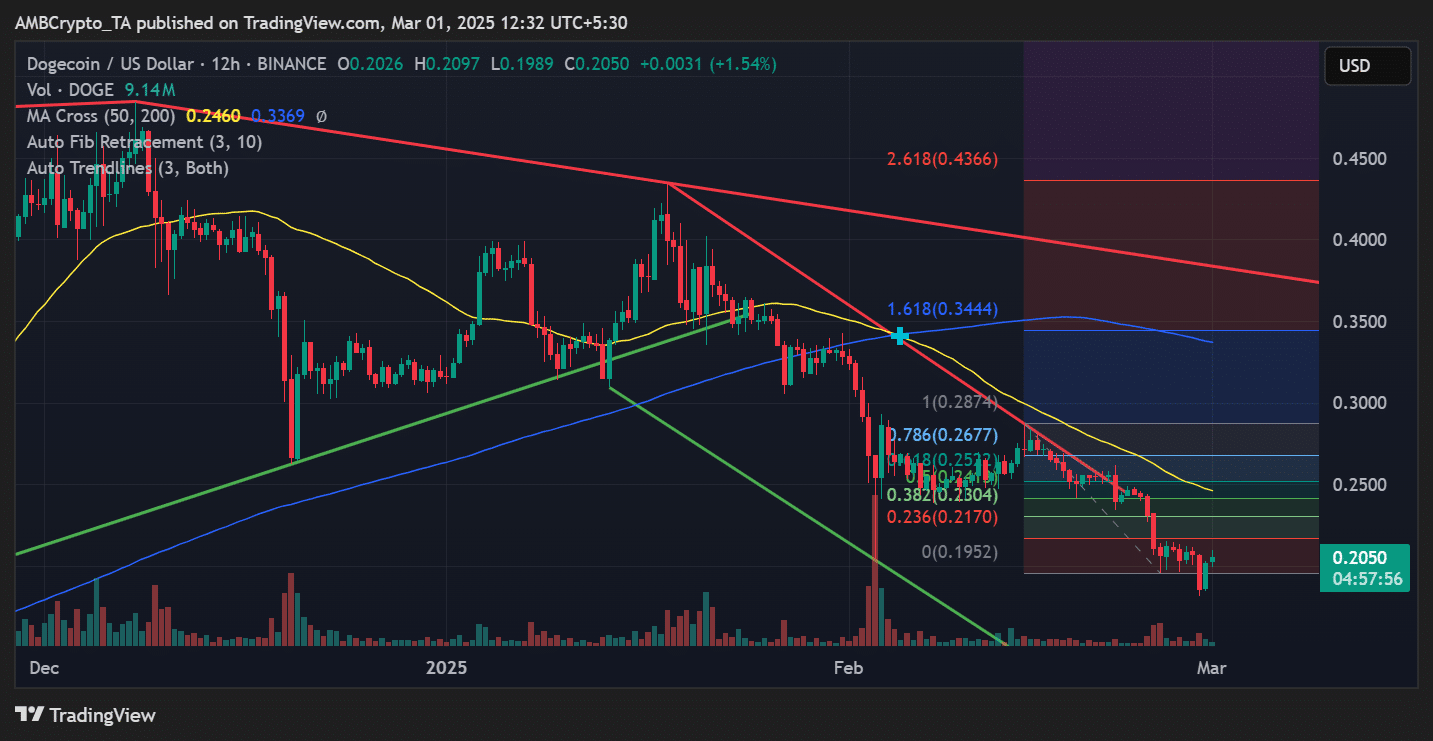
📈 At the time of writing, DOGE was facing resistance at $0.217 – A key Fibonacci level. If bulls manage to push past this zone, the next resistance would sit at $0.25, aligning with the 0.618 Fibonacci retracement level. Breaking above $0.28 could shift sentiment and invalidate the prevailing downtrend. Conversely, if DOGE fails to hold $0.185, the next major support would lie at $0.15, with an extended drop to $0.12 if bearish pressure continues.
Indicators to watch
📉 At press time, the memecoin was well below its key moving averages – A sign of caution. A reclaim of the 50-day MA could indicate a shift in momentum. The RSI seemed to be nearing oversold levels too, suggesting potential for a relief rally if buyers step in. Finally, the MACD indicator was flashing real signs of convergence, which could hint at a slowdown in bearish momentum.
What’s next for DOGE?
🐶 Dogecoin is at a make-or-break level right now. Holding $0.185 would allow for a price rebound towards $0.217 and possibly, $0.25 in a bullish scenario. However, failure to maintain this level might result in a deeper decline towards $0.15 or lower.
📊 Traders should keep an eye on key technical indicators and market sentiment in the coming days. A decisive move above the resistance could spark renewed interest. On the contrary, a drop below support may hint at further downside risk.
Read More
- PI PREDICTION. PI cryptocurrency
- WCT PREDICTION. WCT cryptocurrency
- Florence Pugh’s Bold Shoulder Look Is Turning Heads Again—Are Deltoids the New Red Carpet Accessory?
- Quick Guide: Finding Garlic in Oblivion Remastered
- Katy Perry Shares NSFW Confession on Orlando Bloom’s “Magic Stick”
- Disney Quietly Removes Major DEI Initiatives from SEC Filing
- How to Get to Frostcrag Spire in Oblivion Remastered
- How Michael Saylor Plans to Create a Bitcoin Empire Bigger Than Your Wildest Dreams
- Elon Musk’s Wild Blockchain Adventure: Is He the Next Digital Wizard?
- Unforgettable Deaths in Middle-earth: Lord of the Rings’ Most Memorable Kills Ranked
2025-03-01 23:07