Well, well, well, it seems like exchange tokens are having a little snooze after their recent wild party. Binance Coin (BNB) and OKB decided to break the all-time high record a few days ago, while Bitget’s BGB token just kept plodding along like a steady old camel. But now? Now they’re all taking a little breather, as traders cash out and wander off in search of the next big thing. But before you panic and sell your entire digital fortune, let’s all calm down and remember: the trend is still bullish, folks. Hold onto your hats, the demand is still strong!
BNB Price Analysis
BNB is sitting at a comfy $858.50, which is just a tiny dip of 1.22% in the past 24 hours. But hey, it’s still up by a solid 3.28% this week, so it’s not all doom and gloom. The token’s market cap is a whopping $119.58 billion, and the 24-hour volume surged 37.89%, hitting $3.13 billion. Just two days ago, BNB hit an all-time high of $899.70 before taking a step back. It’s like that one friend who always gets the last word and then retreats to the back of the room.

Let’s talk technicals: BNB is cruising along with immediate support at $829 and resistance at $874. The RSI is chilling at 43.6, which means the momentum has cooled. The Bollinger Bands are suggesting that the price is getting cozy near the lower band, which could mean it’s about to settle down for a while. If the bulls get their act together and reclaim $874, we might see BNB flirt with the $900 mark again. If not, well, let’s just say $800 might be the next stop on this rollercoaster.
OKB Price Analysis
OKB is at $184.64, which is down 4.65% today, but still sitting pretty with a 60.2% weekly gain. That’s a good kind of “oops” for a price drop. Its market cap is $3.87 billion, with volume jumping 79.35% to $554.49 million, so clearly, people are still buying and selling with gusto. The token recently hit an all-time high of $257.03, and then decided to take a 30% vacation. Who can blame it?
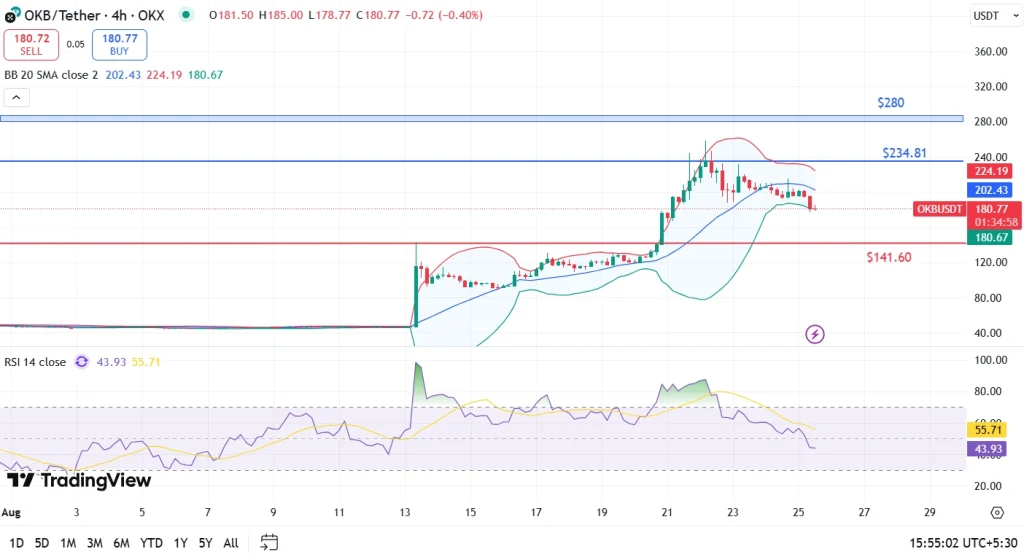
Currently, OKB is holding onto support at $180, with resistance levels set at $202 and $234. The RSI is hanging around 44, meaning things are neutral-ish, but a little bearish. Bollinger Bands are closing in, signaling that the volatility is winding down after a crazy rally. If it bounces from $180, expect more buying action. If not, $141 could be lurking around the corner. Eep!
BGB Price Analysis
BGB is hanging around at $4.54, down 3.47% in the past 24 hours, but still up 1.48% this week. It has a market cap of $5.18 billion, and the 24-hour volume jumped 76.12% to $196.74 million, showing that there’s still a good amount of trading happening. BGB may not be at its all-time high of $8.49, but it’s certainly not a slouch either.
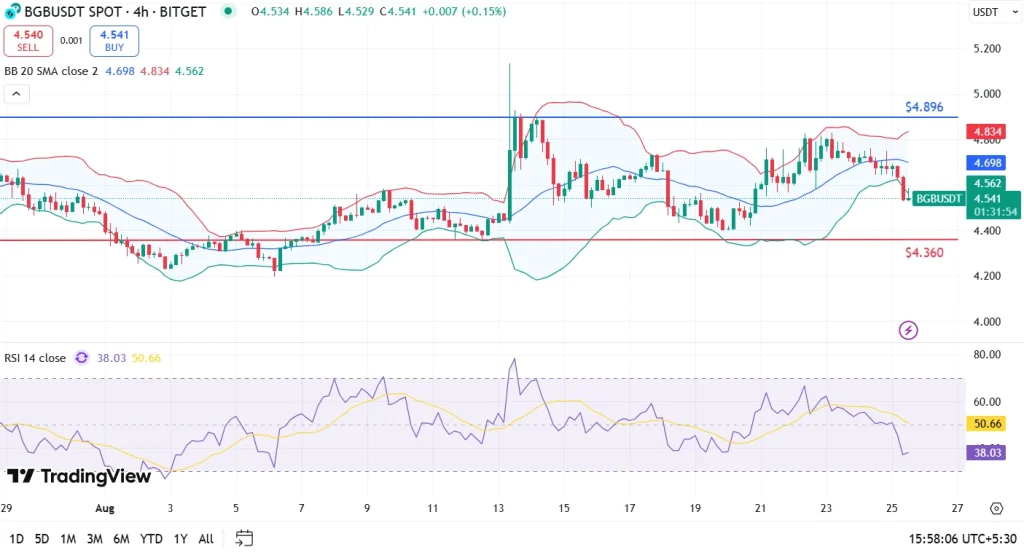
Technically speaking, BGB has support at $4.36 and resistance at $4.89. The RSI of 38 says it might be oversold, which could mean the selling pressure is starting to ease up. The price is hugging the lower Bollinger Band, which is often a hint that a short-term reversal is possible. A move above $4.89 could get BGB back to $5. If it drops below $4.36, though, we might have to grab some tissues.
FAQs
Why are exchange tokens pulling back after recent highs?
Well, it’s that classic case of traders locking in profits after a massive rally. Everyone loves a good dip (not literally, of course), so expect short-term pullbacks when the gains are too tempting.
Are these corrections the end of the uptrend?
Oh, don’t be silly. The rising trading volumes suggest there’s still plenty of interest, and the key support levels are holding strong. So, no, it’s not the end – just a little pause for effect. Take a deep breath.
Read More
- Best Controller Settings for ARC Raiders
- FRONT MISSION 3: Remake coming to PS5, Xbox Series, PS4, Xbox One, and PC on January 30, 2026
- Mark Zuckerberg & Wife Priscilla Chan Make Surprise Debut at Met Gala
- Meet the cast of Good Omens season 3: All the actors and characters
- Review: Final Fantasy Tactics: The Ivalice Chronicles (PS5) – Still the Benchmark for Turn-Based Tactics
- Nippon Sangoku Is The Best New Post-Apocalyptic Anime of Spring 2026
- 7 Great Marvel Villains Who Are Currently Dead
- Welcome to Demon School! Iruma-kun season 4 release schedule: When are new episodes on Crunchyroll?
- Wistoria: Wand and Sword Season 2 release schedule: When are new episodes out?
- The Boys Season 5 Officially Ends An Era For Jensen Ackles’ Soldier Boy
2025-08-25 14:44