If you’ve ever wondered what it feels like to ride an out-of-control rollercoaster built entirely out of invisible money, then gather ‘round—a brand new Bitcoin “Bull Run Cheat Sheet” has landed, and it’s splashier than a swimming pool full of golden coins (spoiler: you can’t swim in Bitcoin).
Bitcoin has been loafing about the $108,000 mark lately, lazing like a sated crocodile after snacking on a couple of hapless traders. On Wednesday, our slippery friend dipped its tail near $105,500 then popped back up, testing $109,000 again because, as ever, Bitcoin simply can’t resist showing off in front of company.
Enter a wizardly crypto analyst, Merlijn The Trader. Imagine Willy Wonka but obsessed with blockchain instead of chocolate rivers. This chap has whipped up what he calls the “Bitcoin Bull Run Cheat Sheet,” a magical scroll (well, a chart posted to X, but let’s make believe) that claims Bitcoin is on the cusp of a massive, greed-driven stampede.
Three Boxes to Rule Them All (And In the Darkness Bind Them)
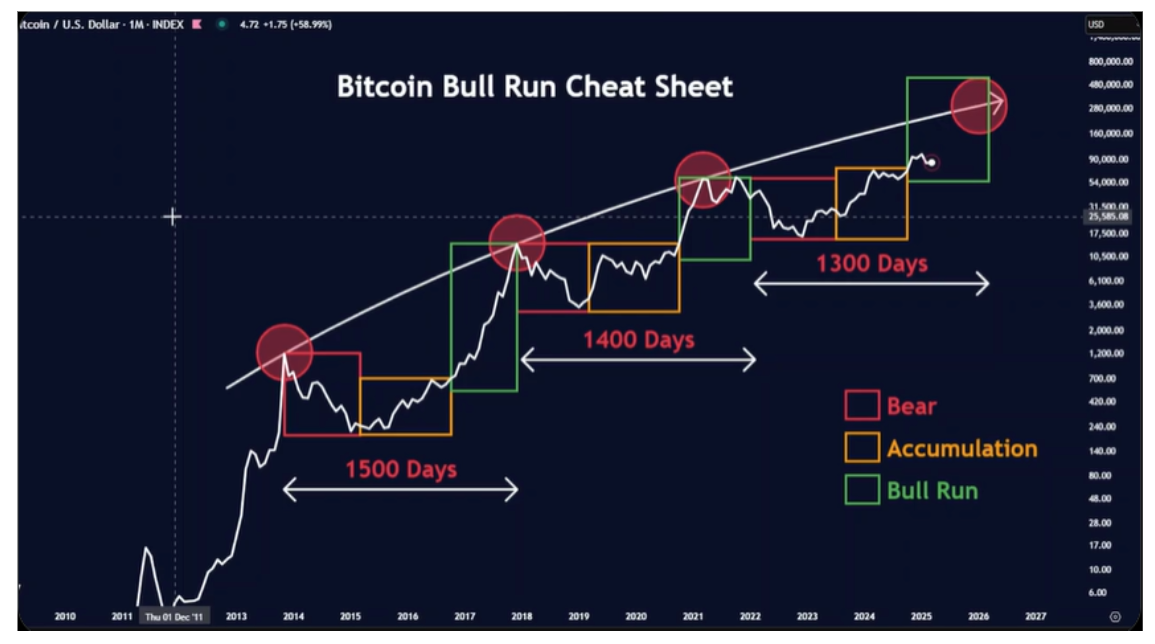
Merlijn’s cheat sheet is a work of art—a rainbow of doom and hope! He’s boxed up Bitcoin’s misadventures since 2014 using red (bear markets, where dreams go to die), orange (accumulation, for patient folks with nerves of steel), and green (bull runs, when everybody wishes they’d bought last year). Every box tells a tale of pain, boredom, and eventually, enough profit to fill a very large bathtub.
The first whole cycle kicked off with Bitcoin peaking at $1,000 in 2013. (That’s right, $1,000—back when dinosaurs roamed the earth and people paid for pizza with bitcoin!) We then plunged head-first into a bear market redder than an embarrassed tomato, before drifting through an orange snooze-fest at $80–$500. Cue the green explosion: early 2017 to late 2017, when Bitcoin whipped out its party hat and soared to nearly $20,000. All this in just 1500 days—give or take a sleepless night or two.
Cycle number two: December 2017. Bitcoin climbs to the mountain’s summit, shouts “Look Mum, no hands!”—then falls off, plummeting to $3,000 by the end of 2018. Ouch. Fast-forward through another orange nap, and by the end of 2020, Bitcoin’s green box reappears, sending price-madness erupting as it via rocket reaches $69,000 in November 2021. Cycle length: 1400 days, enough to forget what sunlight feels like as you stare at price charts.

Modern times: November 2021. Bitcoin peaks, promptly throws a tantrum and drops to $15,000. Everyone’s cousin who said “Bitcoin to the moon!” suddenly can’t make eye contact at family dinners. After a year of sideways shuffling (orange box, if you’re collecting them), our analyst claims Bitcoin is now at the start of its next bull bazaar. And this time? The chart suggests a run all the way up to $250,000… maybe even $300,000 next year—enough for a golden ticket and change.
So When’s the Next Gold Rush?
If you trust magical cheat sheets (and who doesn’t?), we’re supposedly tumbling into the juiciest, wildest bull run yet. The cycle length? About 1,300 days, not that anyone’s counting (except everybody). As of now, Bitcoin lounges at $108,260, quietly plotting its next trick while sucking in new fans and seasoned cynics alike.
Will it shoot for the stars or try tunneling to the center of the earth instead? Place your bets, folks…and hold onto your hats. 🤑🎩🐍
Read More
- GBP CNY PREDICTION
- Elon Musk’s Mom Maye Musk Shares Her Parenting Philosophy
- Elon Musk’s Ex Ashley St. Clair Reveals When Romance Became “Weird”
- 10 Best Free Games on Steam in 2026, Ranked
- Mark Zuckerberg & Wife Priscilla Chan Make Surprise Debut at Met Gala
- Forza Horizon 6 Car List So Far: Confirmed Highlights, Cover Cars, DLC, and Rewards
- 10 Greatest Manga Endings of All Time
- Hollow Knight: Silksong Guide – All 30 Lost Flea Locations
- 38 Years Later, Murder, She Wrote’s Most Overlooked Episode Still Pulls Off TV’s Greatest Crossover
- 20 K-Dramas That Nailed the Perfect Ending
2025-07-06 02:12