- Ethereum’s on-chain metric flashed a bullish sign on the charts
- However, key technical indicators suggested that the coin’s price may fall further.
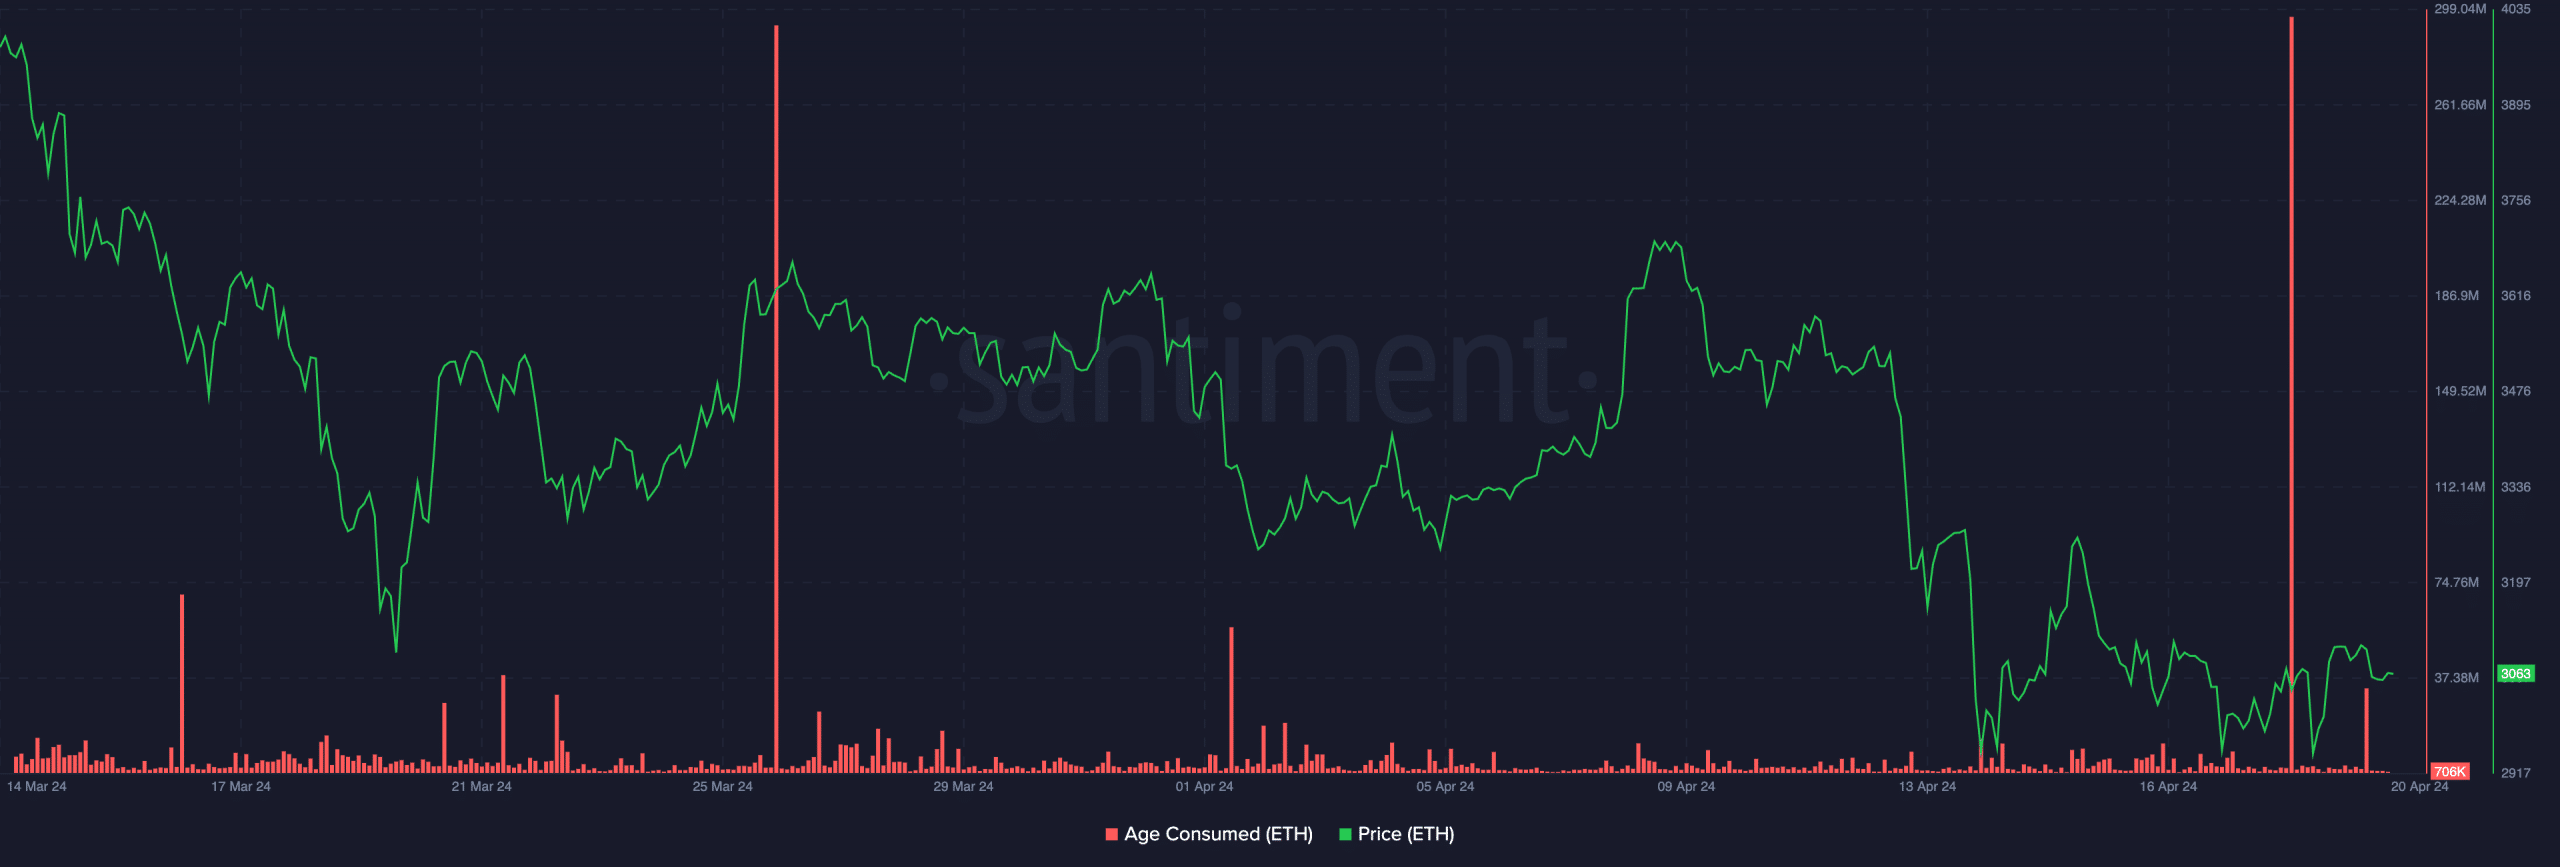
On April 18th, the Age Consumed metric for Ethereum’s ETH token reached a one-month peak. This surge was accompanied by a slight increase in the altcoin’s value, indicating that a potential local minimum may have been attained based on Santiment’s analysis.
Is the bottom in or not?
To determine if ETH has reached its price bottom, consider examining its Age Consumed metric. This indicator monitors the movement of Ethereum’s long-held idle coins. As these coins are typically held by long-term investors who seldom move them, significant shifts in their activity can signal important market trend changes. Consequently, keep an eye on any noteworthy coin movements for potential indicators of local market tops and bottoms.
When this metric experiences a notable increase, it suggests that a substantial amount of dormant tokens are now being traded among owners. This can be seen as a clear sign of long-term holders altering their investment strategies.
An asset’s Age Consumed going low indicates that old coins in wallet addresses are seldom used for transactions.
On the 18th of April, Ethereum’s Age Consumed figure, as reported by Santiment, reached a peak of 1.6 million. Despite a brief dip in ETH‘s price below $3,000 following this event, it swiftly recovered and was currently being traded at $3,059.
Since 18 April, the crypto’s value has risen by 3%, according to CoinMarketCap.
Why caution is necessary
An analysis of Ethereum’s “Age Consumed” indicator suggested a potential upward trend. However, examining its price fluctuations in the one-day chart indicated a strongly bearish short-term forecast.
In the Ethereum market, the negative force was stronger than the positive force. This is indicated by the fact that the red line representing the negative directional index was higher than the green line representing the positive directional index.
Is your portfolio green? Check the Ethereum Profit Calculator
When the Directional Movement Index (DMI) lines of an asset lie in a particular arrangement, it indicates a bearish market trend and strong selling pressure on the price.
Furthermore, the MACD indicator of Ethereum’s market trends supported the existing downward trend. The MACD line was positioned beneath the signal and zero lines.
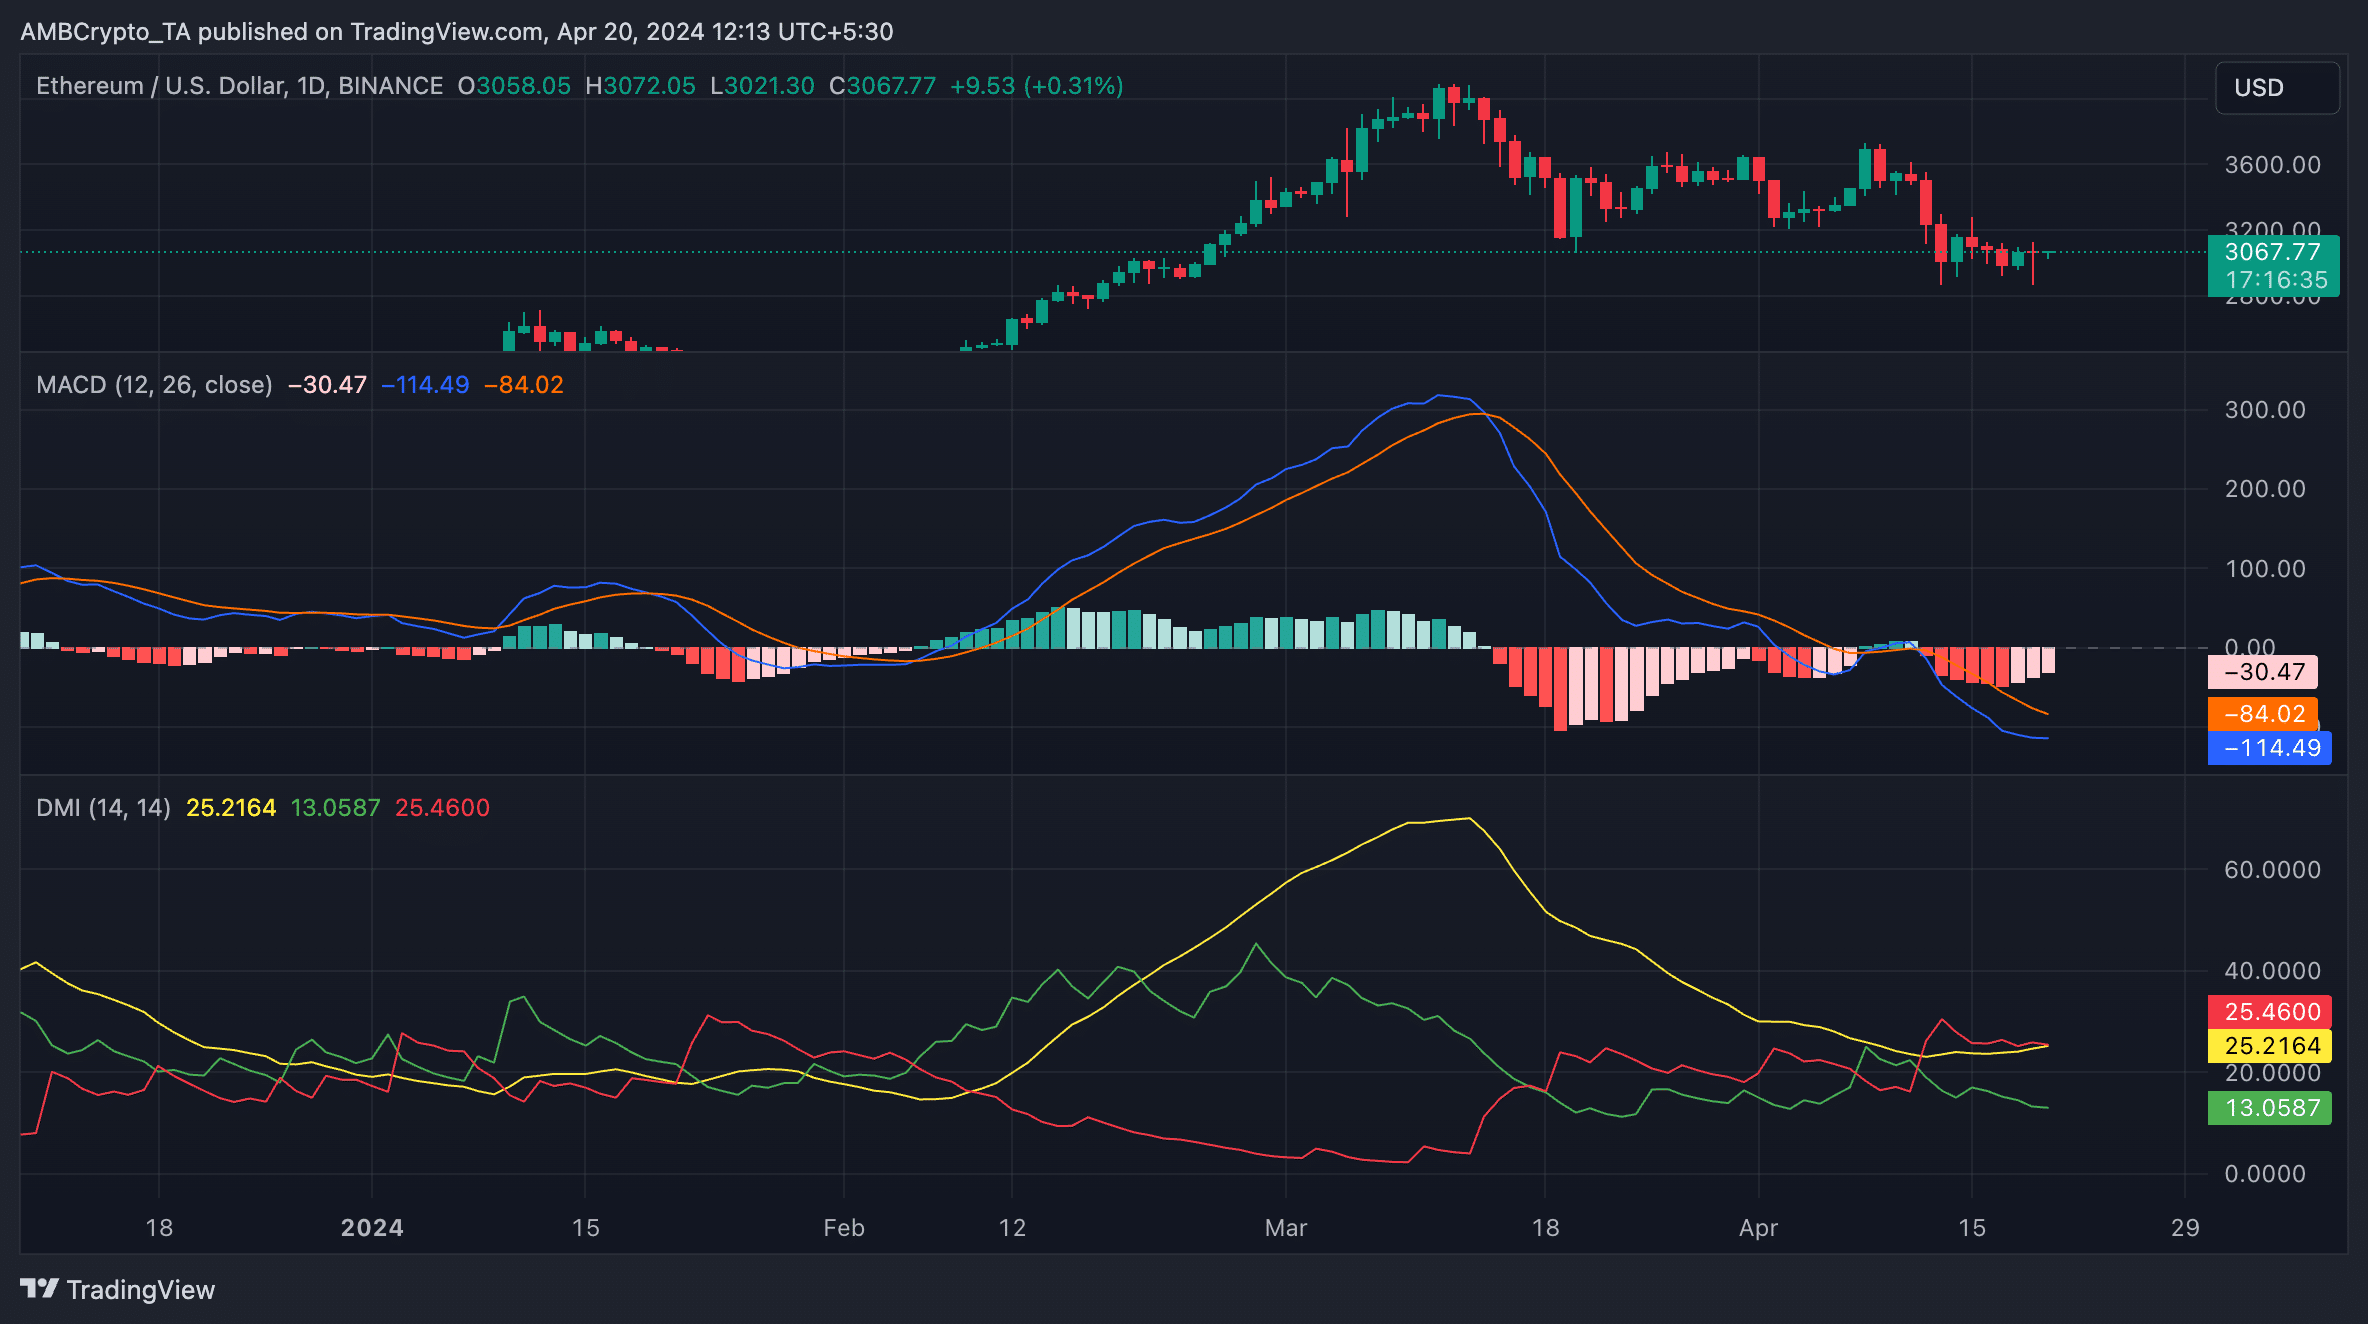
If these lines are arranged in this fashion, it’s a clear sign of a robust downward trend in the market, suggesting that an asset’s price may continue to drop.
Market observers typically view it as a sign to sell their Ethereum holdings and buy for shorting. In simpler terms, the Ethereum market may present some challenges for investors at this moment.
Read More
- PI PREDICTION. PI cryptocurrency
- WCT PREDICTION. WCT cryptocurrency
- Quick Guide: Finding Garlic in Oblivion Remastered
- Katy Perry Shares NSFW Confession on Orlando Bloom’s “Magic Stick”
- Florence Pugh’s Bold Shoulder Look Is Turning Heads Again—Are Deltoids the New Red Carpet Accessory?
- Unforgettable Deaths in Middle-earth: Lord of the Rings’ Most Memorable Kills Ranked
- Elon Musk’s Wild Blockchain Adventure: Is He the Next Digital Wizard?
- Disney Quietly Removes Major DEI Initiatives from SEC Filing
- Shundos in Pokemon Go Explained (And Why Players Want Them)
- BLUR PREDICTION. BLUR cryptocurrency
2024-04-20 17:11