Just When You Thought It Was Safe to Go Back in the Water… The Jaws 2 Tagline Explained
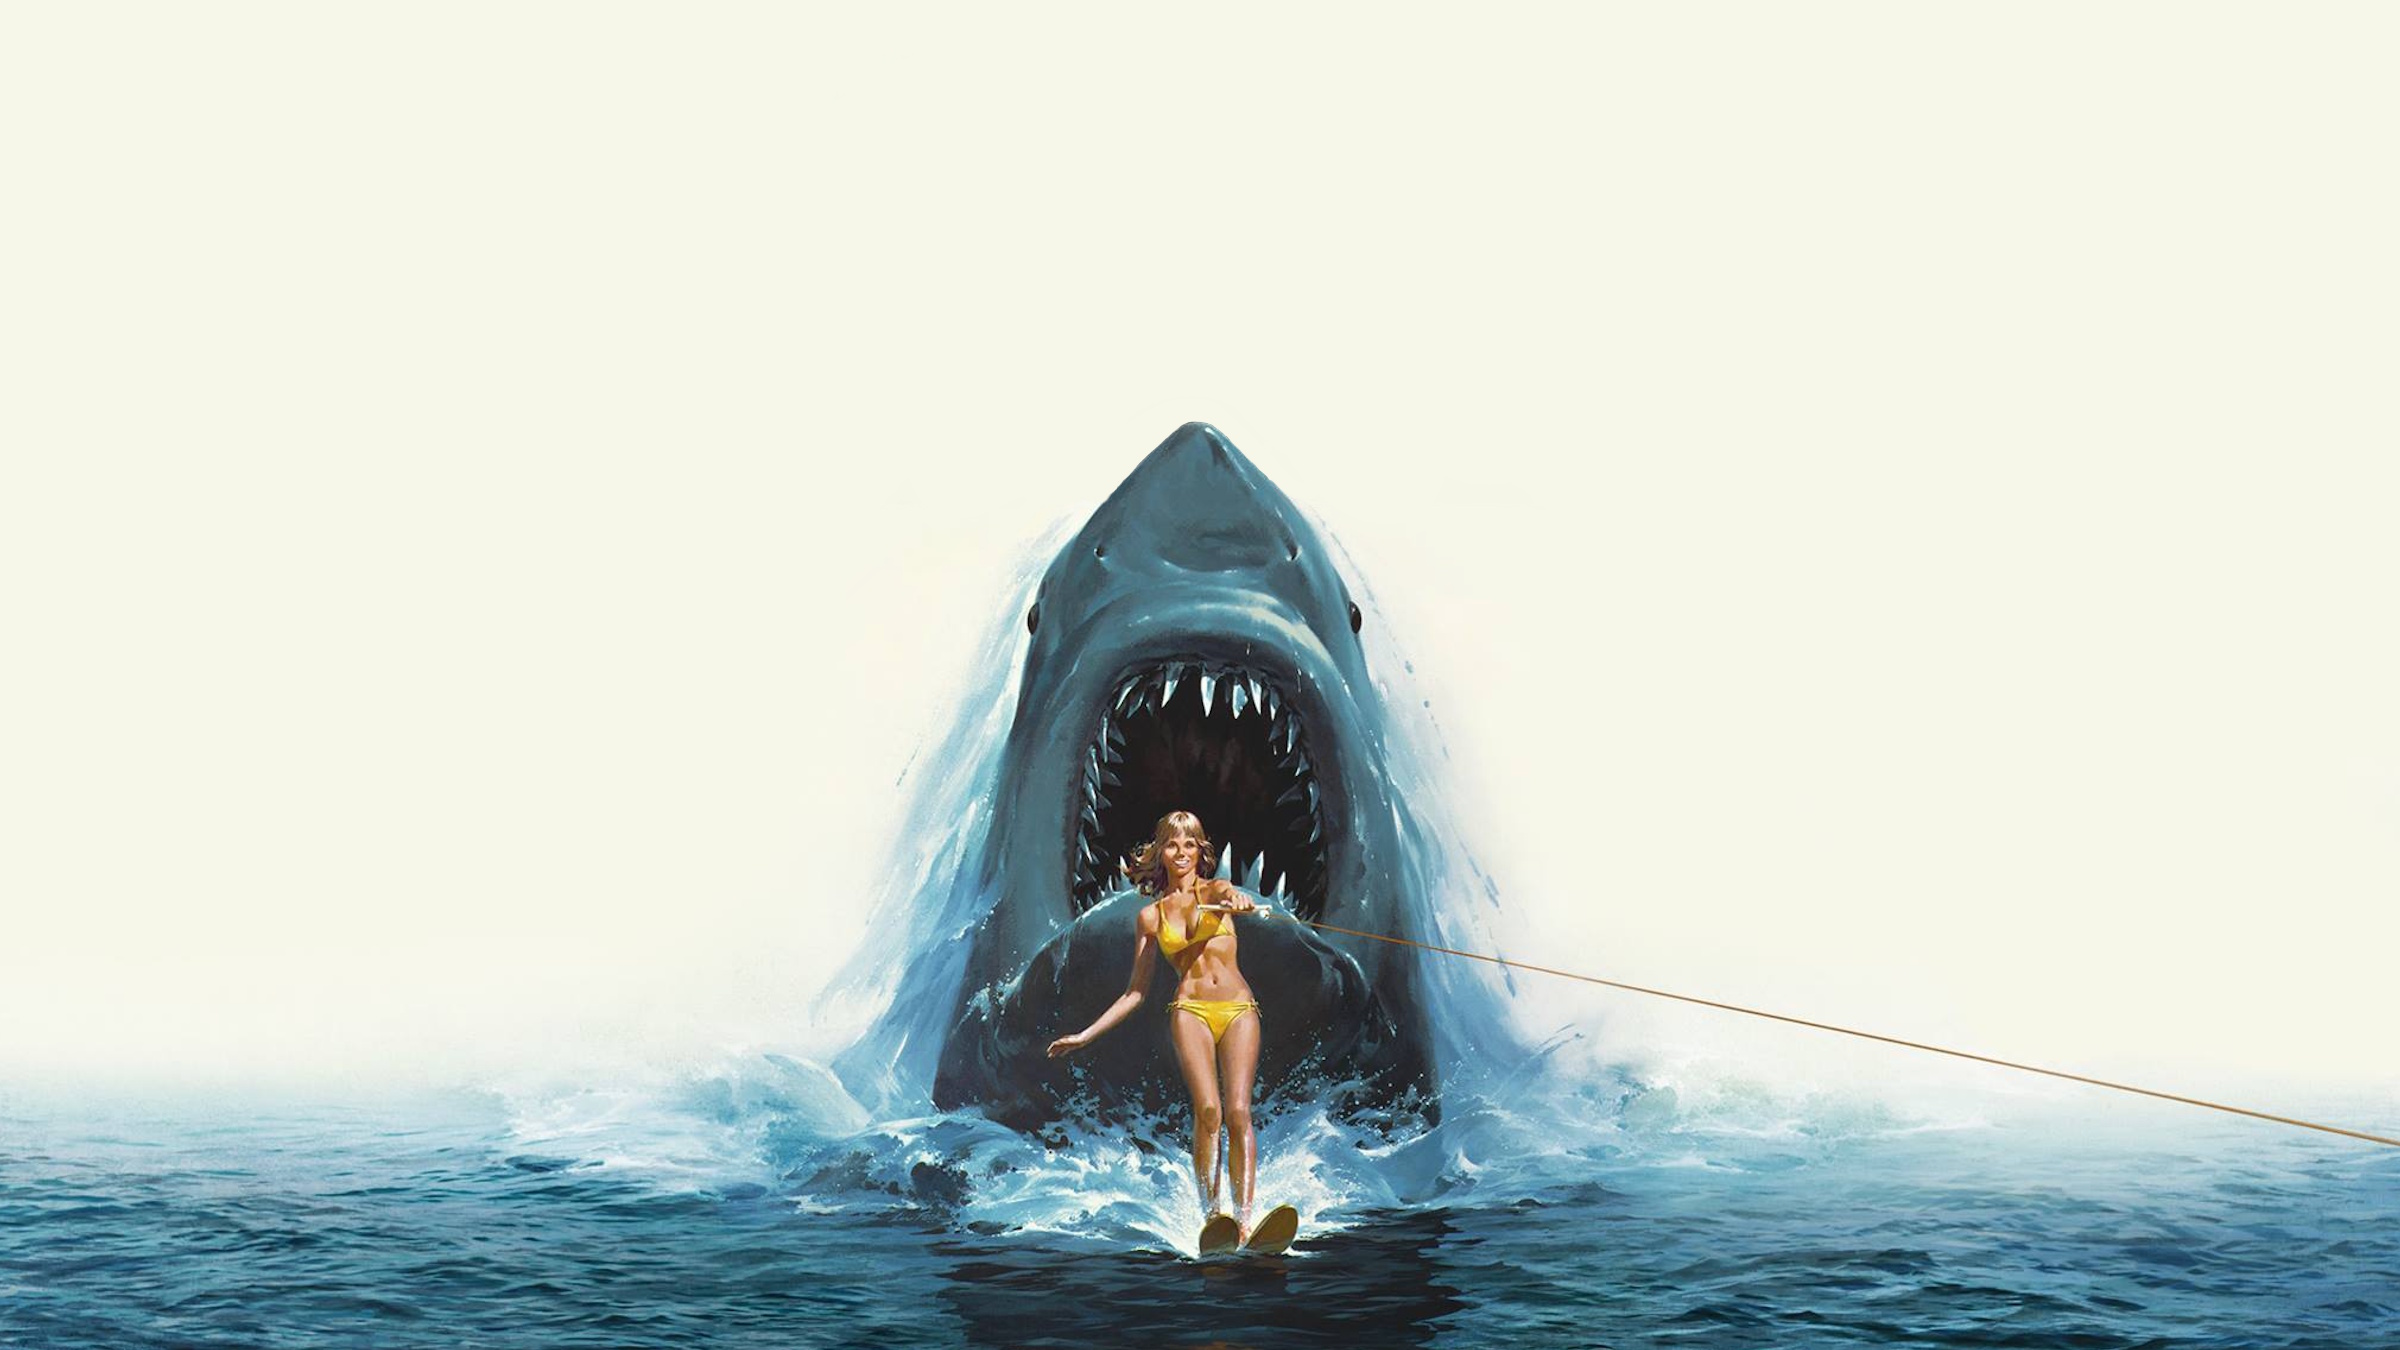
In contrast to the general perception, which often groups it with the other poorly received Jaws sequels, Jaws 2‘s tagline, “Just when you thought it was safe to go back in the water…”, is widely acclaimed as one of the best ever written. This catchy phrase, so iconic that it’s often recognized by those who haven’t even seen the film, could be argued to have transcended its original source and become a significant part of broader pop culture rather than just being associated with one movie.