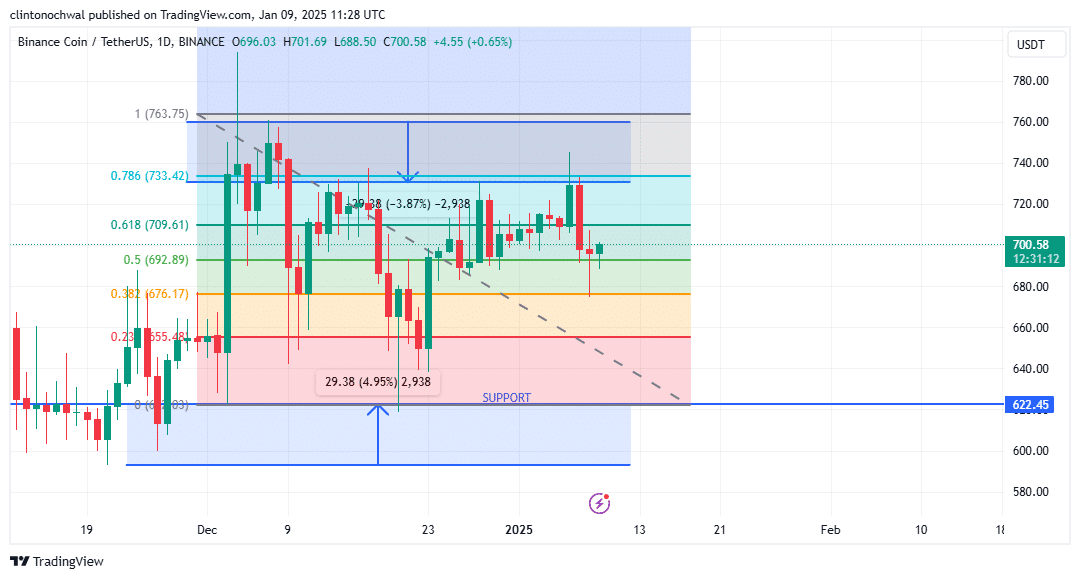
- Binance Coin saw significant retracement in its recent price action, coinciding with Bitcoin’s ongoing market correction
- As BNB approached the $733.42 resistance, volume spikes indicated heightened selling pressure
The price of Binance Coin (BNB) has dropped noticeably in its recent movements, and this is around the same time Bitcoin’s market is correcting. Traders are keeping a close eye on certain levels on the daily chart, as BNB’s rejection at the Fibonacci Retracement Zone suggests there may be chances for smart buying opportunities.
Fibonacci retracement levels
Fibonacci retracement levels offer crucial clues about Binance Coin’s (BNB) price fluctuations, serving as key indicators for possible reversals or sustained trends. As illustrated by BNB’s price graph, for example, the 0.618 level at $709.61, the 0.5 level at $692.89, and the 0.382 level at $676.17 have become significant areas of support.

BNB’s upward push beyond the 0.786 level at $733.42 didn’t sustain, suggesting decreasing bullish energy. This reversal led to a pullback towards the $500 mark, indicating a brief halt in the bearish trend as the price stabilized there.
Previously, the 0.618 level has often served as a robust support for bullish patterns. If BNB falls back to around $709.61 and then bounces back, this could indicate increased buying activity returning.
At approximately $692.89, the 0.5-level stands out as it’s quite close to the current price. Maintaining above this point might suggest a period of stabilization preceding a possible price surge upward.
Instead, if the price falls below the 0.382 level at $676.17, it could potentially lead to more significant drops, targeting the crucial support area around $607.16.
Based on the Fibonacci sequence’s analysis, traders are advised to keep an eye out for bullish candle formations or significant volume surges near these key levels as they might signal potential price reversals. If Binance Coin (BNB) manages to regain its strength and rebound towards the 0.786 Fibonacci level, which is around $733.42, it could potentially push further upwards, aiming for the $763.75 resistance level. This potential rise aligns with the 1.0 Fibonacci extension.
Support and resistance zones
The measurement of support and resistance levels is vital when predicting the future price movement of BNB. Currently, $607.16 appears to be a critical level where accumulation might occur. In the past, this area has shown significant buying activity for BNB, making it an important spot that traders are closely watching for potential rebound signals.
Apart from the $607.16 mark, the $572.85 area also appeared to provide additional safety against further declines. A fall to this point might attract long-term investors looking to take advantage of reduced prices. On the positive side, a resistance at $733.42 lined up with the 0.786 Fibonacci level, acting as a hindrance for further bullish advancement. Beyond this, the $763.75 point seemed significant, potentially serving as a point where traders could consider taking profits or cashing out their gains.
The cost fluctuations of BNB are primarily influenced by outside circumstances, including the behavior of Bitcoin and broader economic trends.
Volume metrics
Lately, the changes in BNB’s pricing have come hand-in-hand with varying trading volumes, shedding light on the overall market mood.

As BNB neared the resistance at $733.42, increased selling activity was evident from the spikes in trading volume, leading to a rejection of further price increase. On the other hand, when the price fell back towards $692.89, the trading volume started to become more steady – suggesting that the intense selling pressure had lessened.
Consequently, an increase in trading activity around the $607.16 level might suggest that long-term investors are amassing shares, possibly pointing towards a future price turnaround.
Furthermore, a scarcity of trading activity close to key support levels might indicate reduced buying enthusiasm, potentially leading to additional drops. Conversely, a surge past $733.42 accompanied by increased volume would signal bullish energy, setting the stage for an uptrend that could propel prices towards $763.75.
By integrating Fibonacci retracement levels, identifying key support and resistance zones, and analyzing volume trends, you can construct a broad approach for navigating the dynamic market environment of BNB. Remember, it’s crucial to consider external factors and overall market sentiment when making decisions to boost your trading performance.
Read More
- WCT PREDICTION. WCT cryptocurrency
- The Bachelor’s Ben Higgins and Jessica Clarke Welcome Baby Girl with Heartfelt Instagram Post
- PI PREDICTION. PI cryptocurrency
- AMD’s RDNA 4 GPUs Reinvigorate the Mid-Range Market
- Guide: 18 PS5, PS4 Games You Should Buy in PS Store’s Extended Play Sale
- Chrishell Stause’s Dig at Ex-Husband Justin Hartley Sparks Backlash
- Royal Baby Alert: Princess Beatrice Welcomes Second Child!
- SOL PREDICTION. SOL cryptocurrency
- Studio Ghibli Creates Live-Action Anime Adaptation For Theme Park’s Anniversary: Watch
- Dragon Ball Z: Kakarot DLC ‘DAIMA: Adventure Through the Demon Realm – Part 1’ launches between July and September 2025, ‘Part 2’ between January and March 2026
2025-01-10 10:15