- POL saw strong network growth and bullish patterns, targeting a breakout above $0.5324
- Market sentiment improved as retail activity rose, with technical indicators hinting at a trend reversal
Over the past seven days, there has been an impressive surge of 426% in active users on the Polygon network (POL), indicating robust growth in user interaction. Currently, the cryptocurrency is being exchanged at $0.4533, marking a decline of 1.91% over the last day.
Even though there was a slight decline, it’s worth noting that POL’s technical and underlying factors appear to be in agreement, hinting at a possible surge ahead. Can this cryptocurrency conquer its obstacles and trigger a bullish change of direction?
Any bullish possibilities?
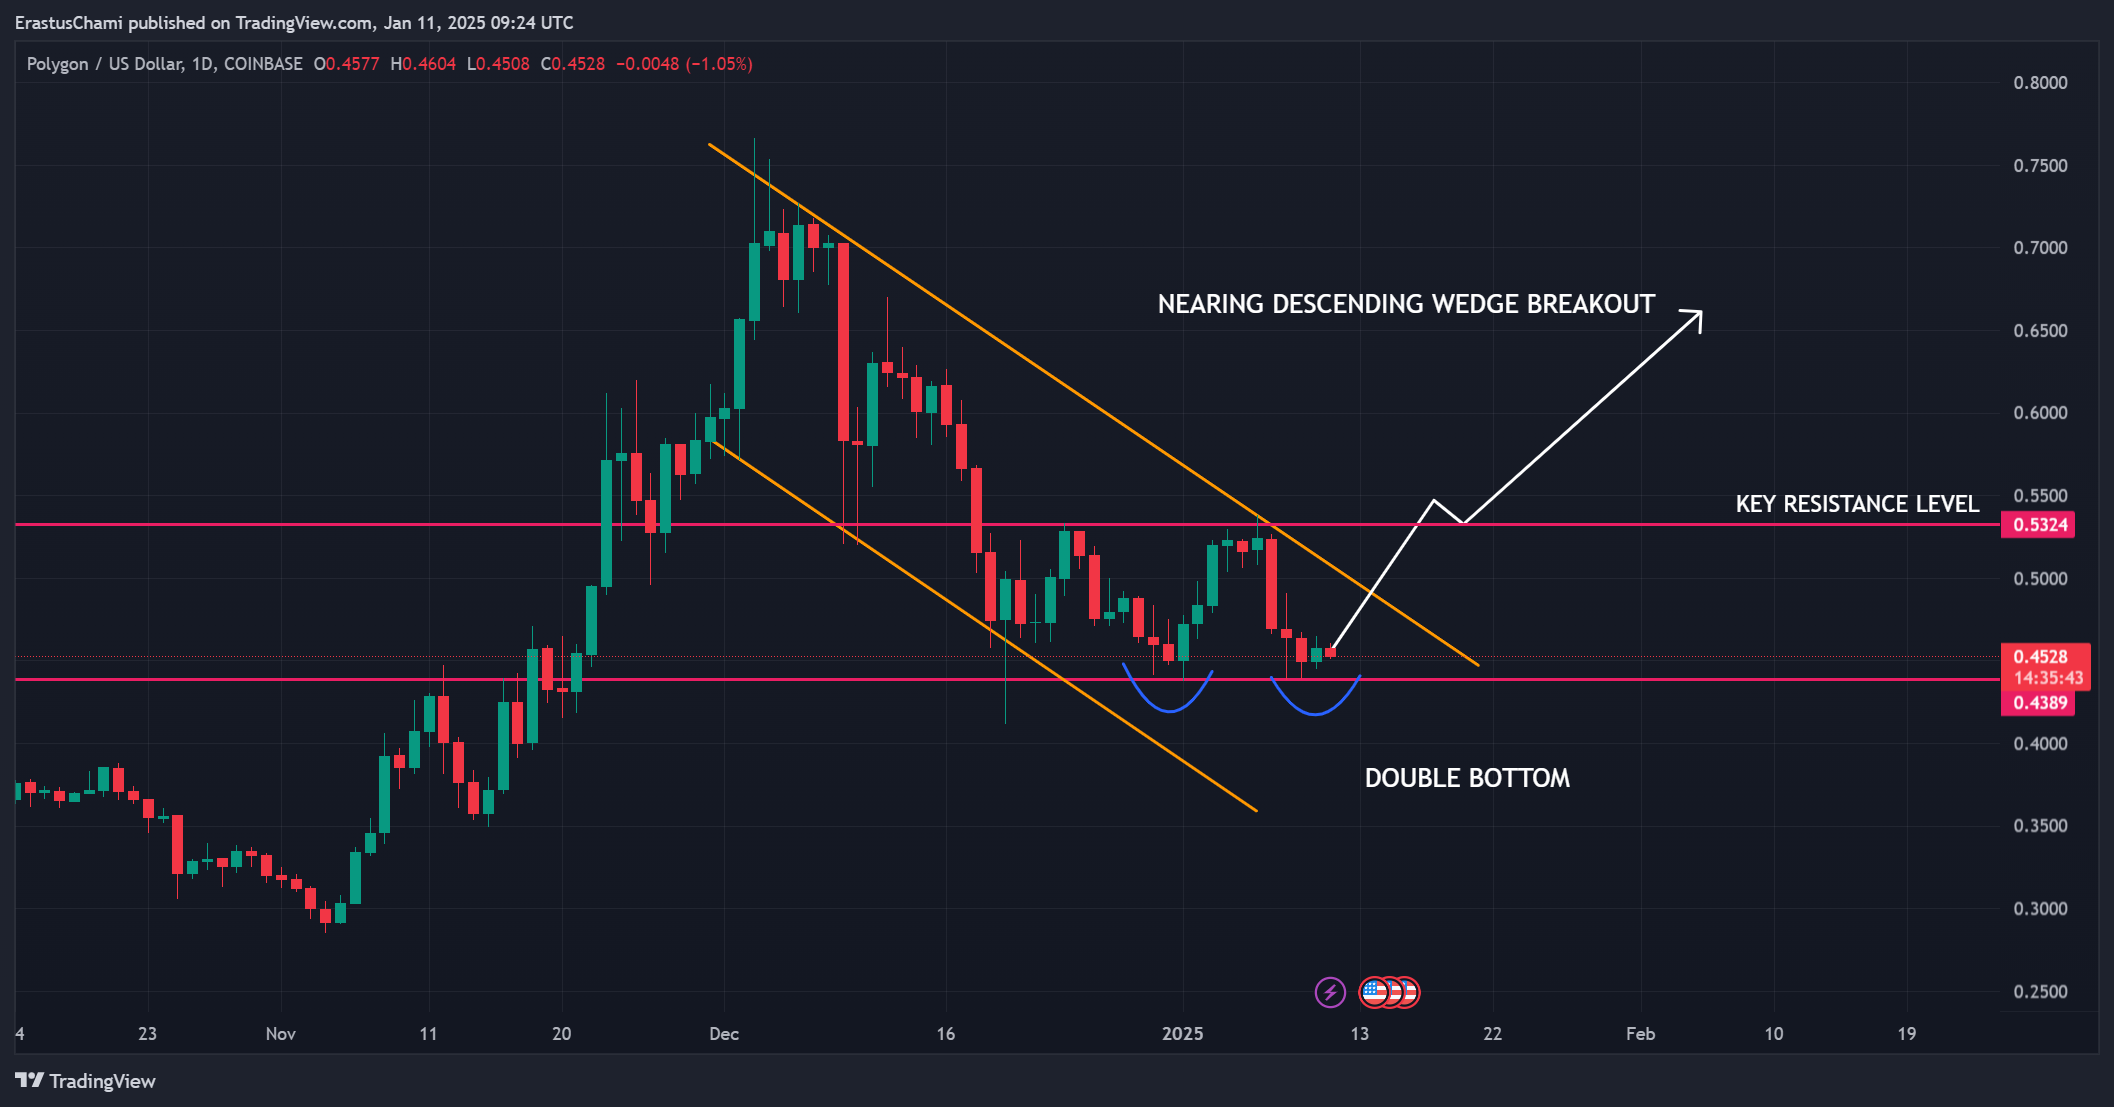
The behavior of POL’s price suggested a falling triangle pattern, which typically indicates a bullish turnaround. This pattern was further strengthened by the development of a double bottom around $0.4389, offering extra backing and increasing the likelihood of an upward price movement.
Should POL surpass the key resistance point at $0.5324, it might initiate a robust upward price movement. Nevertheless, it’s crucial for the token to sustain a consistent influx of purchases to breach this resistance and reverse its descending trend.
Network activity indicates rising adoption
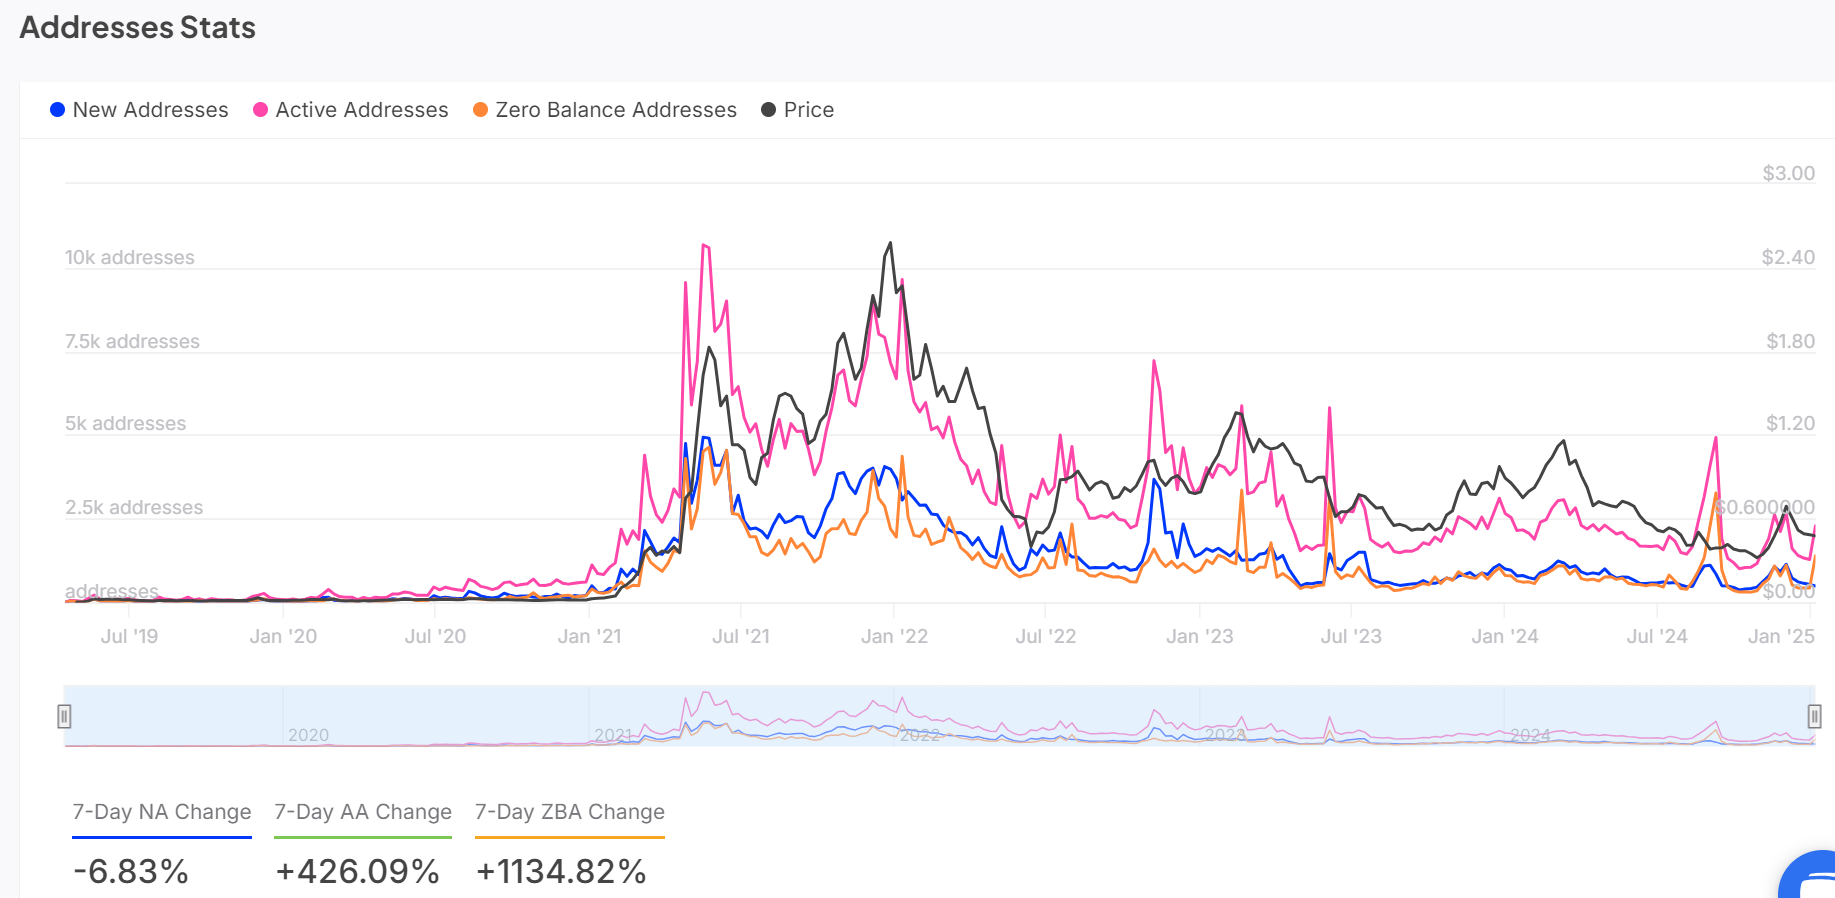
Polygon’s network activity has significantly escalated in recent days, as active addresses have spiked by a staggering 426% within the past week. Furthermore, there has been an astounding growth of 1,134.82% in accounts with zero balance – a clear indication that user interaction on the network is at an all-time high.
While there was a minor decrease of 6.83% in newly added addresses, the significant increase in active users suggests a high level of engagement with the platform’s features. This growth spurt has strategically placed the altcoin in an advantageous position for potential positive price movements.
Technical indicators show room for recovery
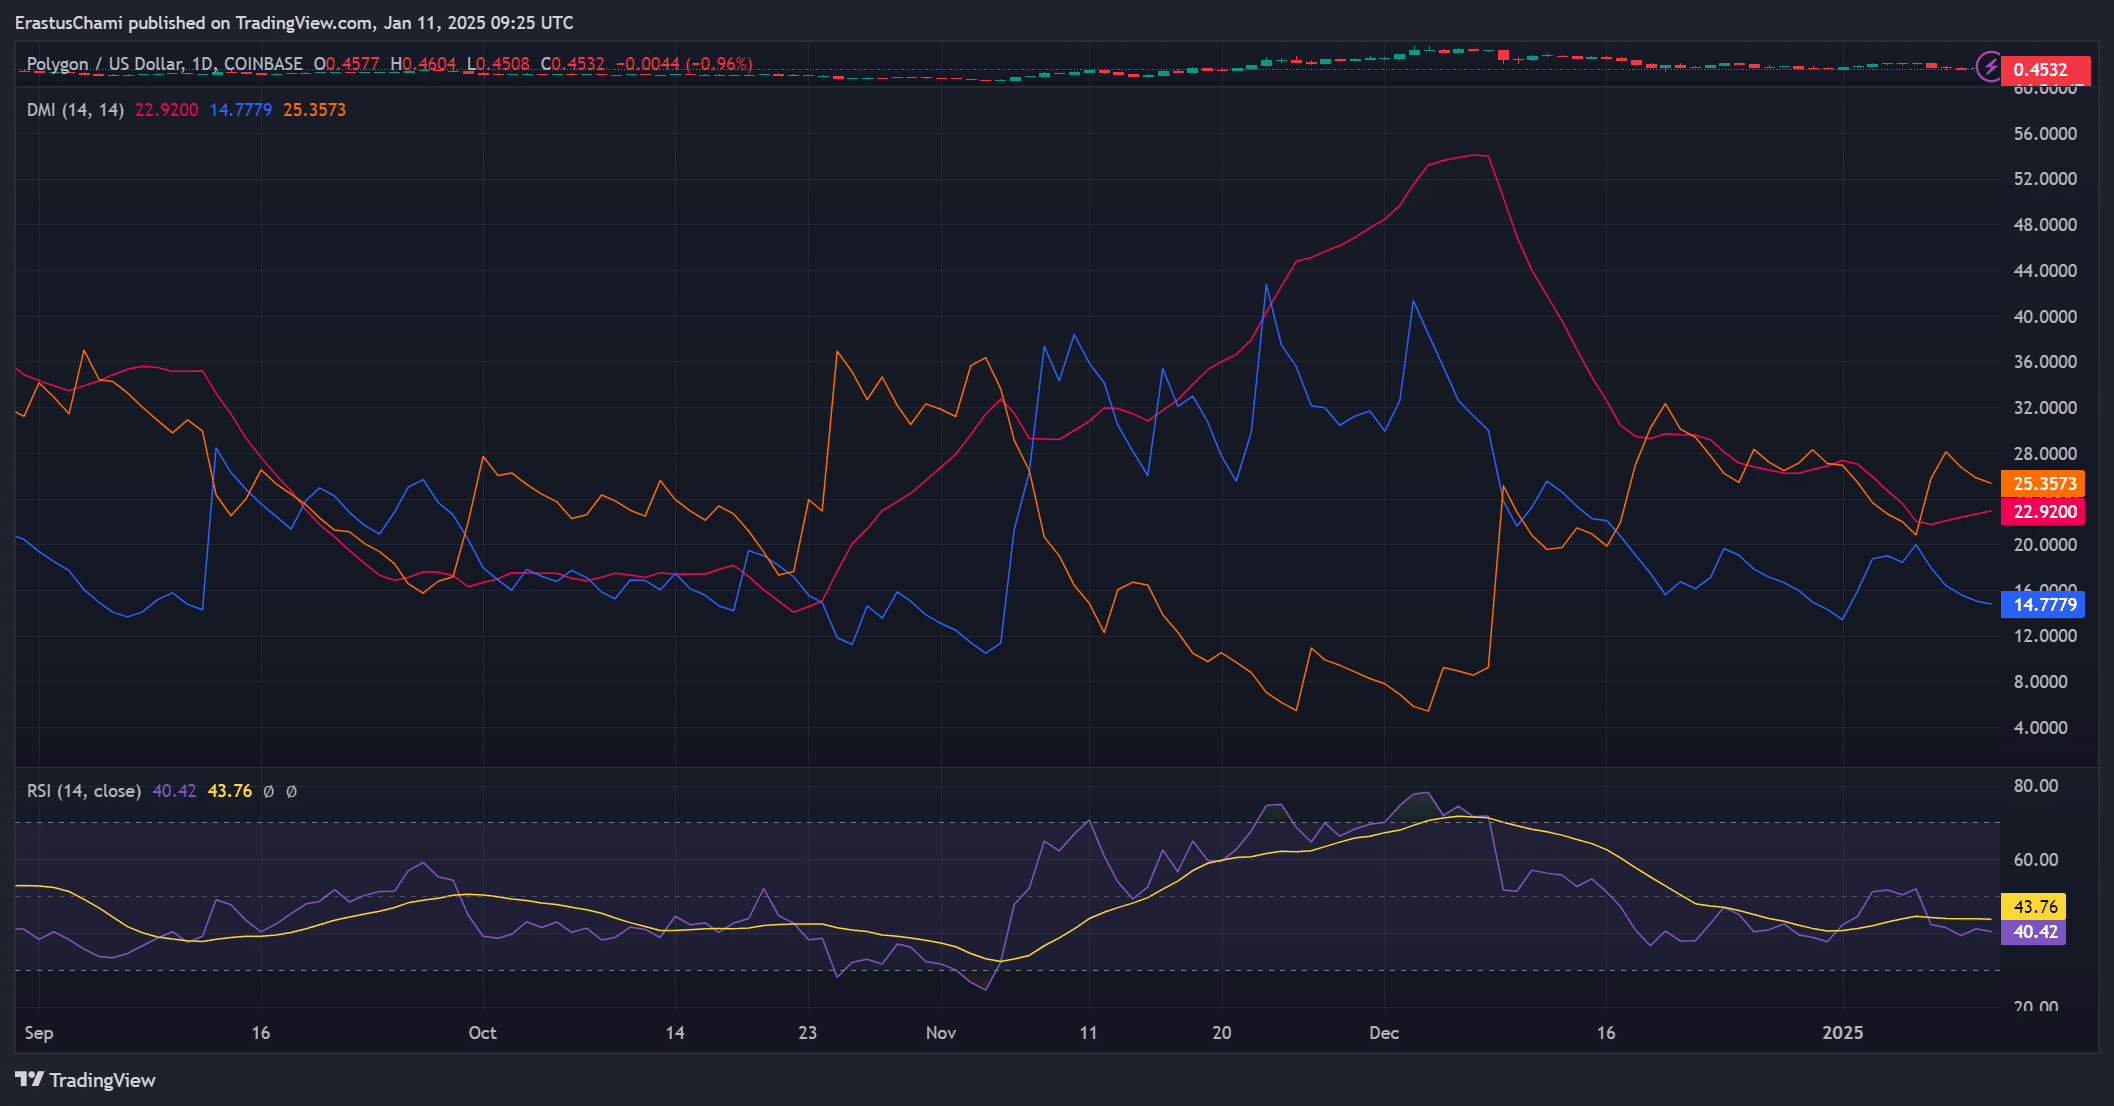
The RSI value of POL, which measures the speed and change of price movements, is currently at 43.76. This figure suggests the market may be approaching oversold territory. Historically, such situations have been followed by a rise in prices.
Adding to that, the Directional Movement Index (DMI) showed a +DI of 14.77 and a -DI of 25.35, with an ADX of 22.92 indicating a decline in bearish momentum. If the +DI surpasses the -DI, it might signal a trend reversal, suggesting a potential setup for a bullish surge, supporting the notion of a bullish breakout.
Transactional stats show hike in retail activity
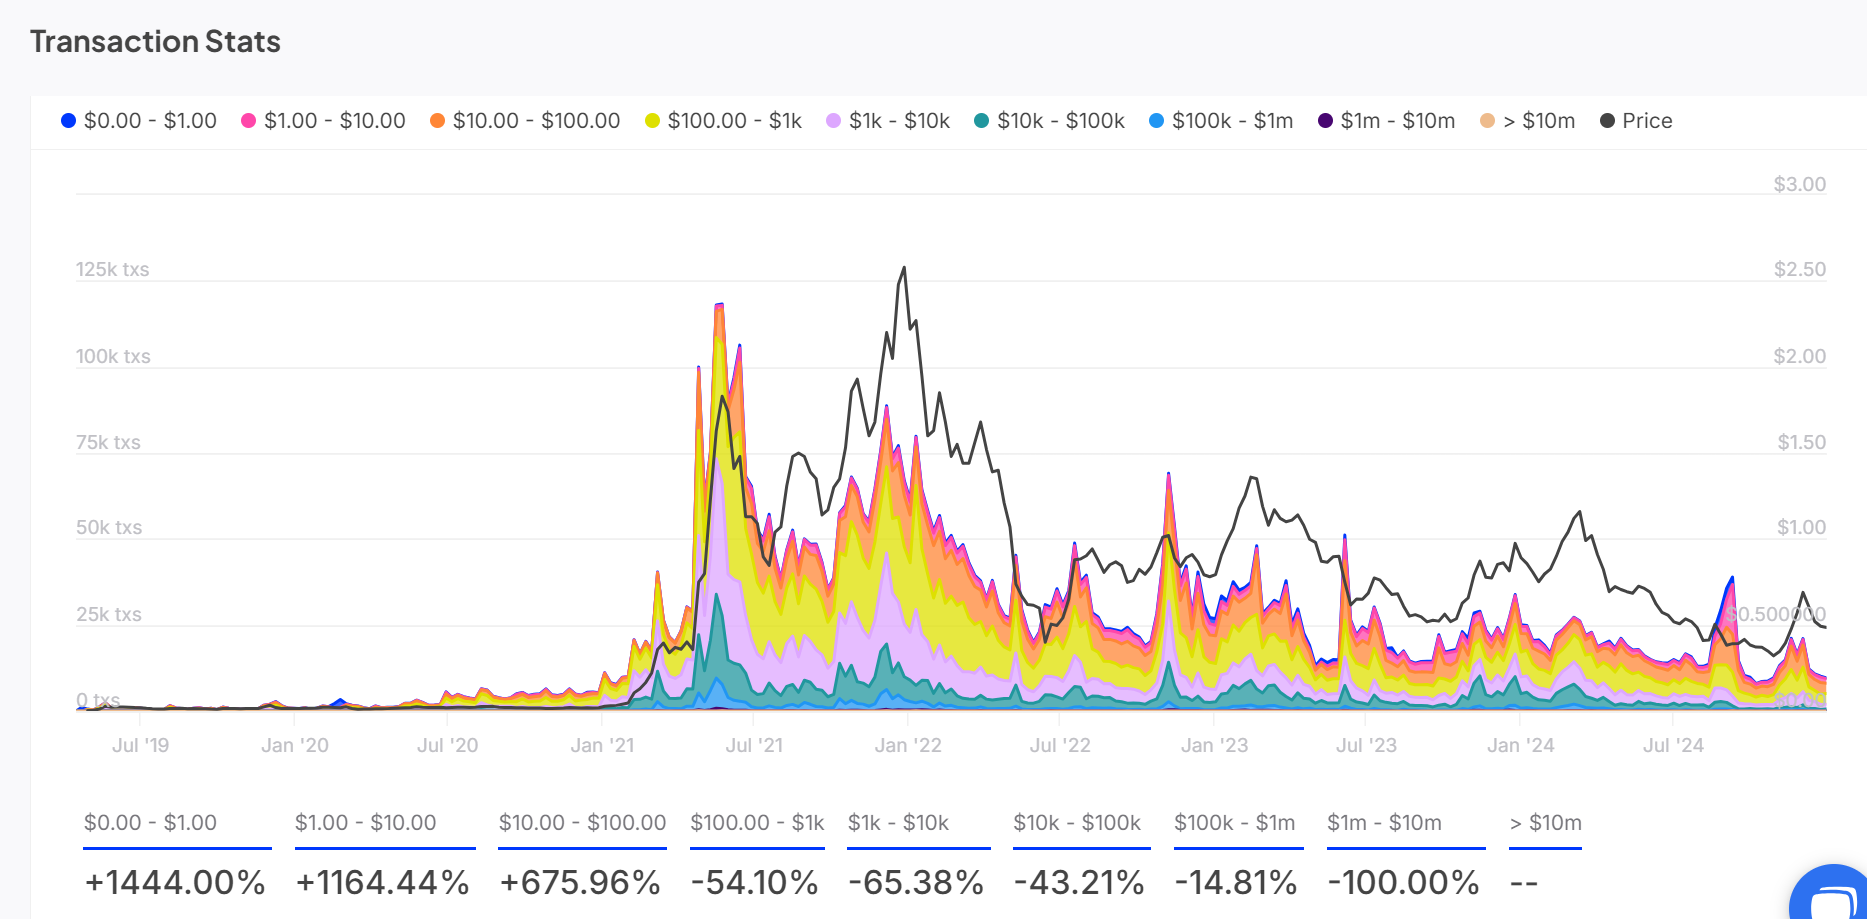
The data on transactions for Polygon showed a notable change in user behavior. Specifically, the number of small-scale transactions (less than $10) skyrocketed by 1,444% and 1,164.44%, suggesting increased engagement from individual investors.
In the meantime, large transactions exceeding $1,000 saw a substantial decrease, with a drop of 65.38% in transactions ranging from $1,000 to $10,000. However, this decline was offset by an increase in smaller transactions, suggesting that the network is being utilized more frequently for everyday purposes.
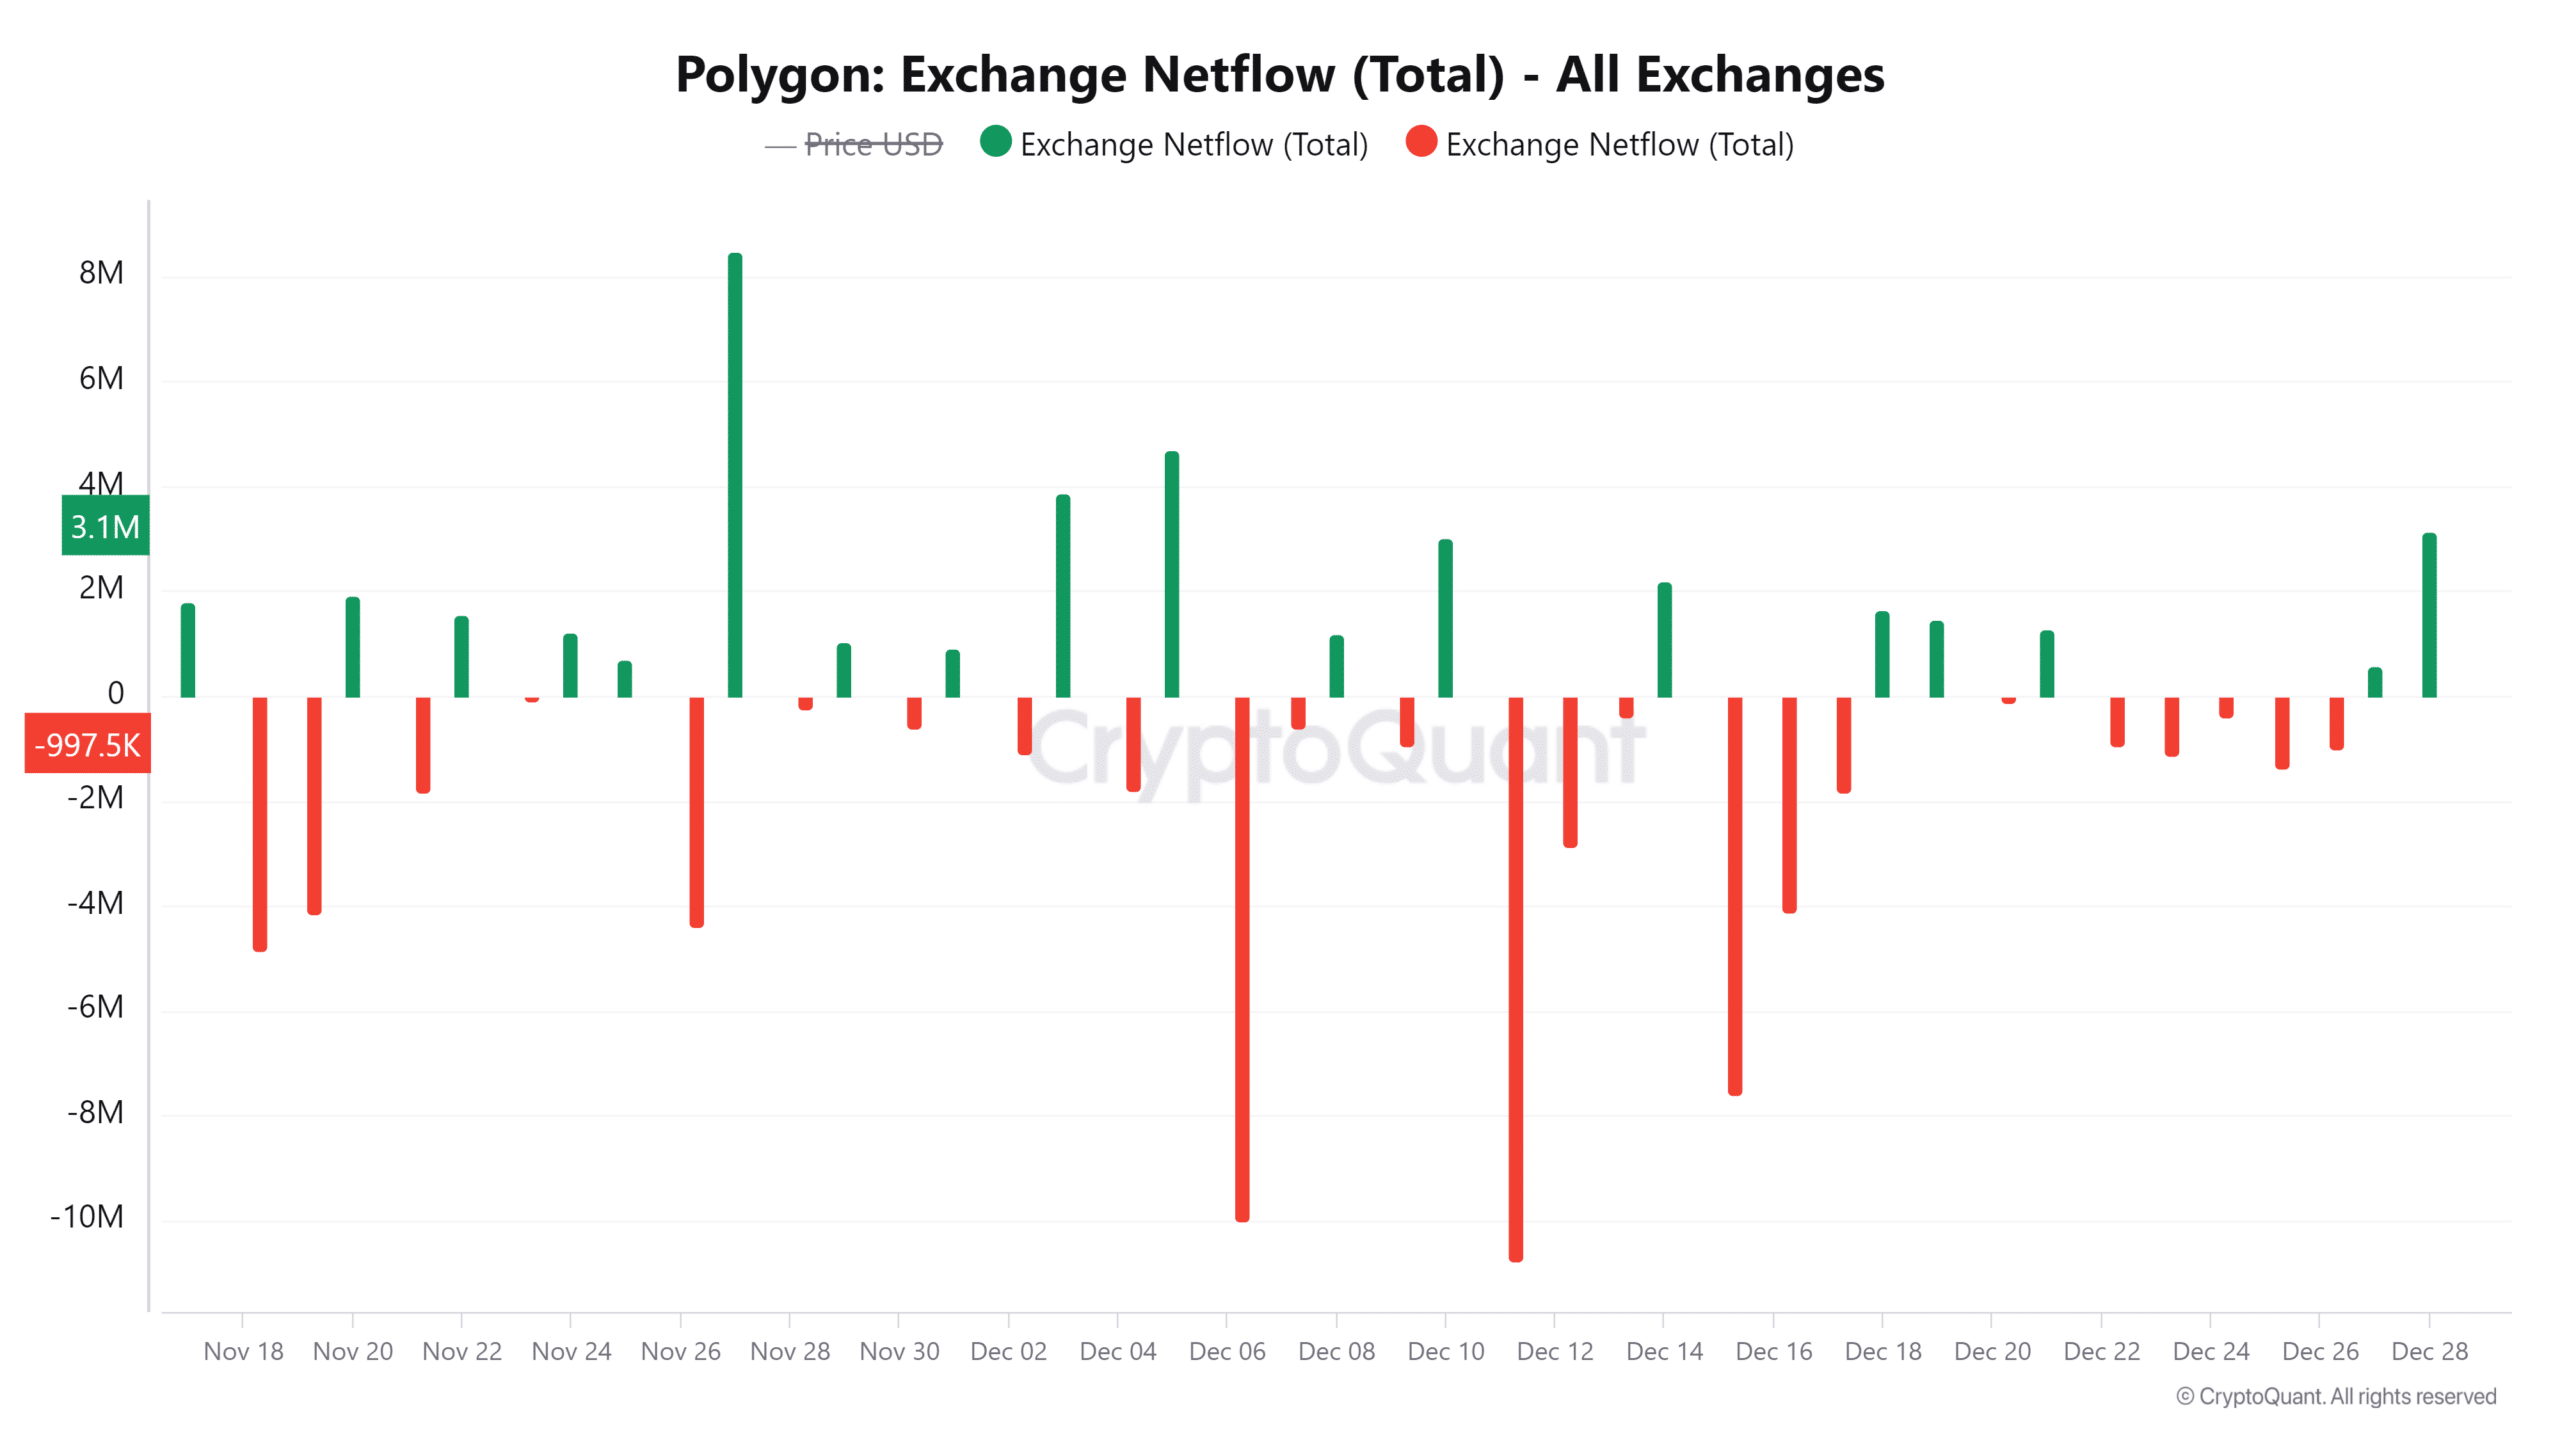
Exchange netflow hints at potential price action
The analysis of netflow showed an increase in incoming tokens amounting to approximately 449,617.5, equating to a 0.23% growth. This upward trend suggests increased liquidity, typically indicative of heightened trading action.
Consequently, this influx could lead to increased market turbulence, making it possible for POL to surge past its resistance points.
Read More
- Gold Rate Forecast
- Masters Toronto 2025: Everything You Need to Know
- We Loved Both of These Classic Sci-Fi Films (But They’re Pretty Much the Same Movie)
- SteelSeries reveals new Arctis Nova 3 Wireless headset series for Xbox, PlayStation, Nintendo Switch, and PC
- Rick and Morty Season 8: Release Date SHOCK!
- Discover the New Psion Subclasses in D&D’s Latest Unearthed Arcana!
- Mission: Impossible 8 Reveals Shocking Truth But Leaves Fans with Unanswered Questions!
- Eddie Murphy Reveals the Role That Defines His Hollywood Career
- PI PREDICTION. PI cryptocurrency
- ‘The budget card to beat right now’ — Radeon RX 9060 XT reviews are in, and it looks like a win for AMD
2025-01-11 21:12