- OFFICIAL TRUMP, Raydium, and Flare registered the week’s biggest gains
- Pudgy Penguin, Fantom, and Floki Inu emerged as the week’s biggest losers
This past week in the world of cryptocurrencies was filled with excitement, as notable launches and substantial fluctuations took place among both well-established and up-and-coming digital tokens. Some investments displayed impressive strength and expansion, while others experienced intense selling, underscoring the market’s unpredictability.
Biggest winners
OFFICIAL TRUMP
Trump’s official debut on the trading market was nothing short of spectacular, soaring by an astounding 626%! This impressive performance made it the star of the week. The token, launched on January 18th, experienced a dramatic price increase from roughly $10 to over $55 in just a short period. Its rapid ascent showcased strong momentum and propelled its market value beyond $11 billion.
During the trading period, a strong buying trend was evident as every minor dip was followed by renewed demand. Key periods of consolidation near the $30 level fueled subsequent growth, and significant increases in trading volume coincided with major breakthroughs. At the current moment, its trading volume exceeded 13 billion dollars.
In a mere 24 hours after its release, TRUMP has skyrocketed to become one of the biggest meme coins by market value. Its steep upward trajectory and swift increase in capitalization suggest the possibility of substantial price fluctuations, up or down, as the market processes this extraordinary launch event.
Raydium (RAY)
This week, Raydium (RAY) has emerged as another stellar performer, escalating from $4.50 to $7.44, resulting from significant gains of 67%. Unlike the usual volatile spikes typical in cryptocurrency markets, its price movement displayed a steady upward trend instead.
Over the course of a week, the price pattern showed a distinct three-part progression. First, there was a period of stabilization near $4.50, then a gradual ascent to $5.70, and finally an impressive spike that propelled the price beyond $7. The trading activity, consistently high at 1.07 million RAY, has been robust throughout this upward trend, serving as confirmation of the momentum’s legitimacy.
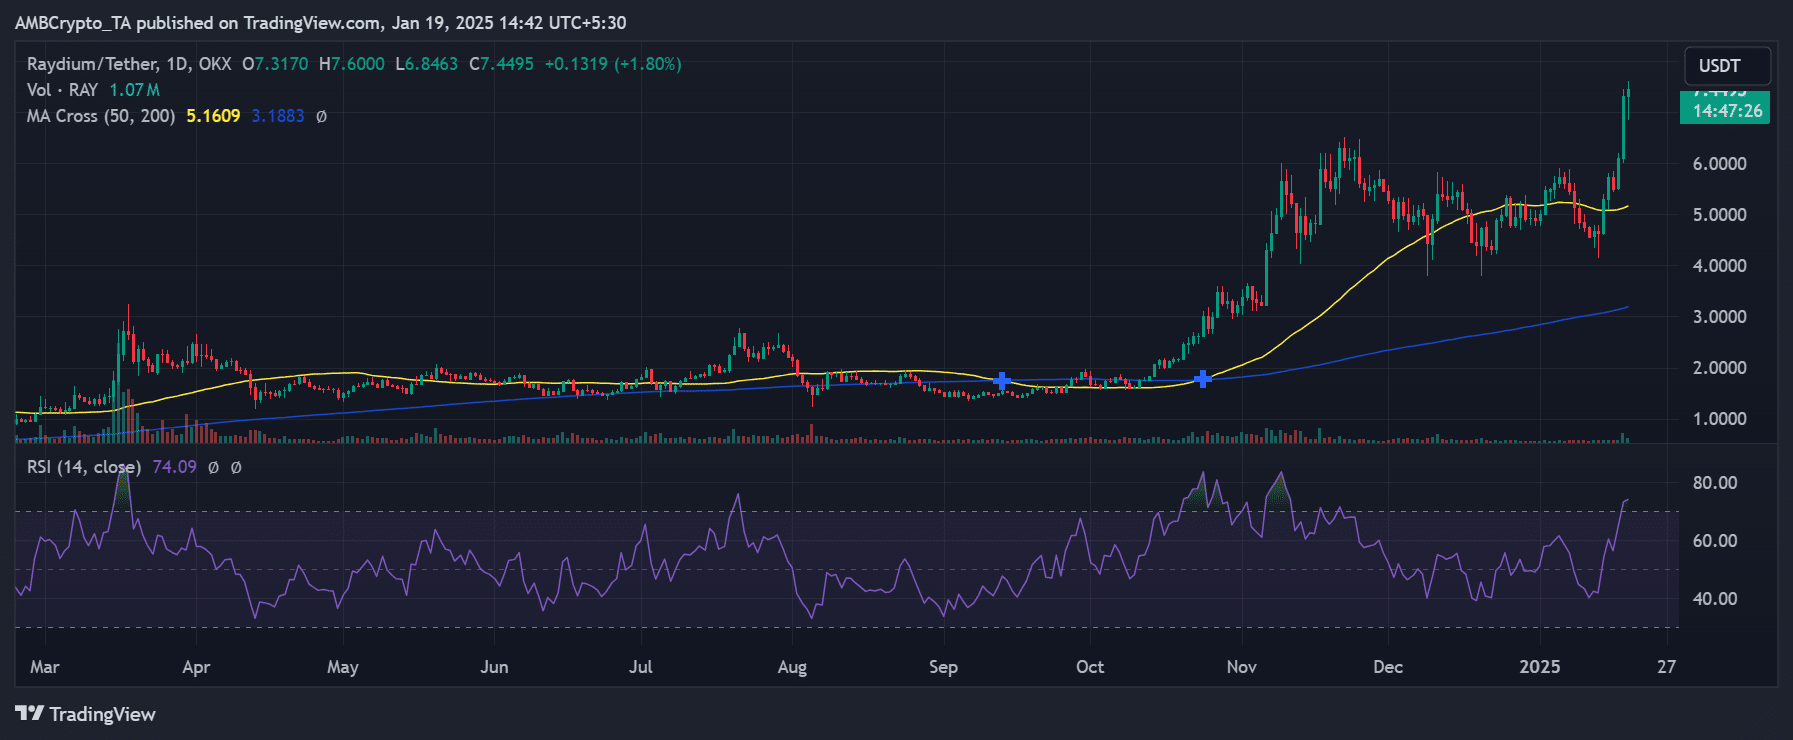
Technically speaking, RAY consistently held a strong stance above its 50-day (5.1609) and 200-day (3.1883) average lines, suggesting a stable long-term bullish trend. Additionally, the Relative Strength Index (RSI) read 74.09, indicating that the market was overbought, but strong uptrends can often sustain high RSI levels for prolonged periods.
It’s worth noting that the price pattern around the $6 resistance point stood out, initially functioning as a barrier but eventually being overpowered. Once breached, the following price movement underscored robust buying confidence, as each dip met support at increasingly higher points.
As the market trend appears bullish, traders need to be aware of the overly optimistic RSI readings and look out for possible periods of consolidation near the current levels. The $6 area, which previously acted as resistance, could now offer support during any pullbacks. Additionally, volume patterns suggest that this rise in price might be due to institutional investment rather than retail speculation, possibly indicating a prolonged increase in value.
Flare (FLR)
Likewise, Flare (FLR) showed remarkable progress this week, increasing from $0.025 to $0.029 – Reflecting robust 17% growth. The token’s price trend displayed a well-organized uptrend, highlighted by rising bottoms and consistent buying interest.
The first day of the week saw a quick drop to $0.023, paving the way for an eventual rise. From this low point, FLR displayed a clear upward trajectory, with each pause in growth acting as a platform for further increases. The spike on January 17 was particularly significant, propelling the price to $0.033, although some selling pressure ensued afterwards.
Even though there was a dip towards $0.029 late in the week, the overall pattern still looks positive, as declines keep finding support at successively higher points. The steady progression of the rise and the growing volume during upward movements suggest genuine buying rather than mere speculation, hinting at potential future growth.
Biggest losers
Pudgy Penguin (PENGU)
At the other extreme, PENGU faced difficulty in preserving backing, dropping from $0.033 to $0.026. This represented a significant 17% drop, positioning it among the most substantial losers this week. The token’s price movements suggest a narrative of decreasing buyer confidence and mounting selling pressure.
As a crypto investor, I’ve been closely monitoring the weekly chart, and it’s become clear that the price structure has taken a turn for the worse. The week started off with a tough battle around $0.033, but there was a brief surge to $0.036 on January 16. Unfortunately, this rise was short-lived as sellers quickly took over, causing the price to plummet down to its current levels of approximately $0.026. Today’s trading has been particularly concerning, with a significant drop of about 9.97%.
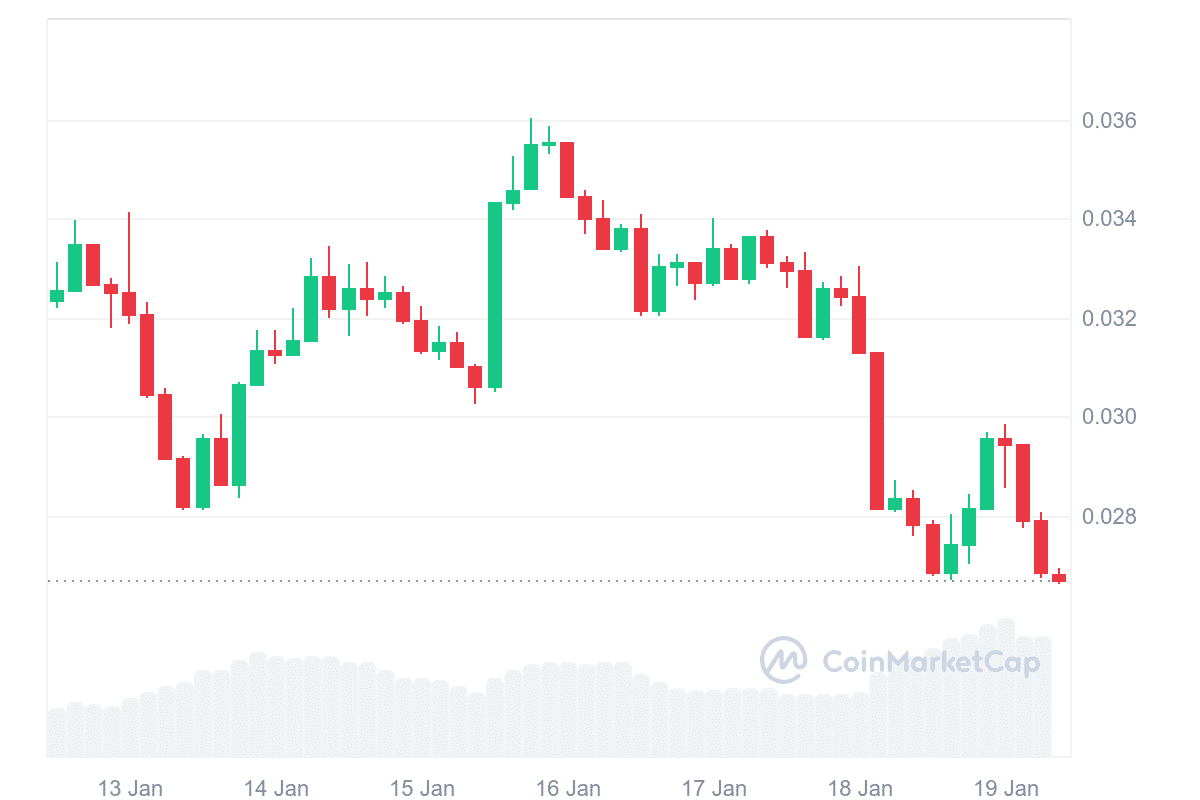
The technical indicators showed a strongly bearish outlook. The RSI fell to 40.21, and the MACD showed increasing negative momentum with a reading of -0.001036, suggesting that the downward trend may continue. Moreover, the trading volume of 2.8 billion PENGU pointed to substantial selling activity, especially during the recent market decline.
What stood out was the absence of substantial support points after falling below $0.030. Every effort to recover has faced increased selling force, creating a trend of decreasing highs and lows. The token’s inability to maintain support at $0.028 might suggest more vulnerability to come.
In simpler terms, when a market is oversold (overly sold), it often suggests an upcoming rise. However, if you notice less trading activity during brief market recoveries and more during sell-offs, it indicates that there are few confident buyers willing to purchase at a dip. Traders should keep an eye on the $0.025 price level, as breaking below it could intensify the selling pressure.
Fantom (FTM)
As an analyst, I’ve noticed a notable fluctuation in the value of Fantom (FTM). After peaking at around $0.70, it dipped down to $0.65, representing a 13% drop. The price movement appears bipolar, reminiscent of Dr. Jekyll and Mr. Hyde’s persona, with an initial spike up to $0.825 on 16th January, followed by a period where sellers seemed to gain the upper hand.
During the first part of the week, FTM held steady near $0.70 before launching a strong surge that increased its value by approximately 18%. Yet, this growth spurt couldn’t be maintained as selling activity intensified, resulting in a swift reversal. The downward trend noticeably quickened on January 18, as the token broke through several support barriers.
The latest price trend is quite worrying as it’s been consistently dropping, accompanied by higher selling activity. The fact that the price couldn’t hold at $0.70 indicates decreasing buyer enthusiasm, and the current fluctuations around $0.65 don’t show any signs of becoming stable. Unless there’s a major change in market trends, FTM might dip to lower support levels in the upcoming trading periods.
Floki Inu (FLOKI)
This week’s trend in FLOKI’s price shows an increasing tendency towards selling, as it has dipped from $0.0316 to $0.0315, representing a 4% decrease. Yet, this downward trajectory wasn’t a simple one; the path taken was quite complex.
Initially, the value of the token plummeted to $0.0315 on January 14th, but it quickly rebounded and reached $0.0319 by January 18th. This surge was significant, yet short-lived, as sellers appeared at these high points. This renewed selling pressure caused the prices to retreat, undoing the midweek growth and moving them closer to the week’s lowest point.
The graph shows a recurring trend of unsuccessful breakout efforts, where every upward surge is followed by rising sell volumes. At the current price point of approximately $0.0315, the market behavior hints at persisting weakness. However, the steady pace of the descent suggests organized selling rather than mass panic.
Read More
- PI PREDICTION. PI cryptocurrency
- How to Get to Frostcrag Spire in Oblivion Remastered
- We Ranked All of Gilmore Girls Couples: From Worst to Best
- How Michael Saylor Plans to Create a Bitcoin Empire Bigger Than Your Wildest Dreams
- Kylie & Timothée’s Red Carpet Debut: You Won’t BELIEVE What Happened After!
- Gaming News: Why Kingdom Come Deliverance II is Winning Hearts – A Reader’s Review
- S.T.A.L.K.E.R. 2 Major Patch 1.2 offer 1700 improvements
- Florence Pugh’s Bold Shoulder Look Is Turning Heads Again—Are Deltoids the New Red Carpet Accessory?
- The Elder Scrolls IV: Oblivion Remastered – How to Complete Canvas the Castle Quest
- WCT PREDICTION. WCT cryptocurrency
2025-01-20 04:08