- Bitcoin‘s MVRV deviation bands suggest it’s ripe for profit-taking, but who’s counting?
- UTXO price distribution shows strong support around $90K, but can it hold? Only time will tell…
Ah, Bitcoin! Still hovering near $97,000, as if it has nowhere better to be. But don’t let that price stability fool you—it’s just the calm before the storm. Some would say it’s consolidating, others call it an act of quiet rebellion against the volatility gods.
On-chain data, technical indicators, and a vague sense of hope all seem to suggest Bitcoin’s in a good place. Yet, the dance with resistance and support will decide its fate, like an old drama with a predictable ending that somehow still keeps us on edge.
Bitcoin MVRV Bands: So, Are We Going Up or What?
The MVRV (Market Value to Realized Value) Extreme Deviation Pricing Bands have spoken. And guess what? They show Bitcoin lounging near the +1.0 band, a zone historically known to signal powerful price momentum. I mean, Bitcoin’s basically showing off at this point. 🤑

Now, if Bitcoin dares to break above this mark, it might just fly to new heights. But—plot twist—it might also dive for a quick breather and settle back down to the mean. Classic Bitcoin. 😅
And, while we’re here, the strongest support is around $93,000. So, don’t go worrying too much just yet.
UTXO’s Crystal Ball: Support Levels or Doom?
Behold, the UTXO Realized Price Distribution (URPD) chart, a mystical map of Bitcoin’s past transactions. It reveals that a significant chunk of Bitcoin was bought and sold between $90,000 and $101,000. Curious, isn’t it? Almost like Bitcoin’s decided to build a fort right here.
The concentration of transactions in these price zones suggests solid support, so Bitcoin’s not likely to plummet below $90,000 unless something big goes wrong. Which—spoiler alert—could happen.
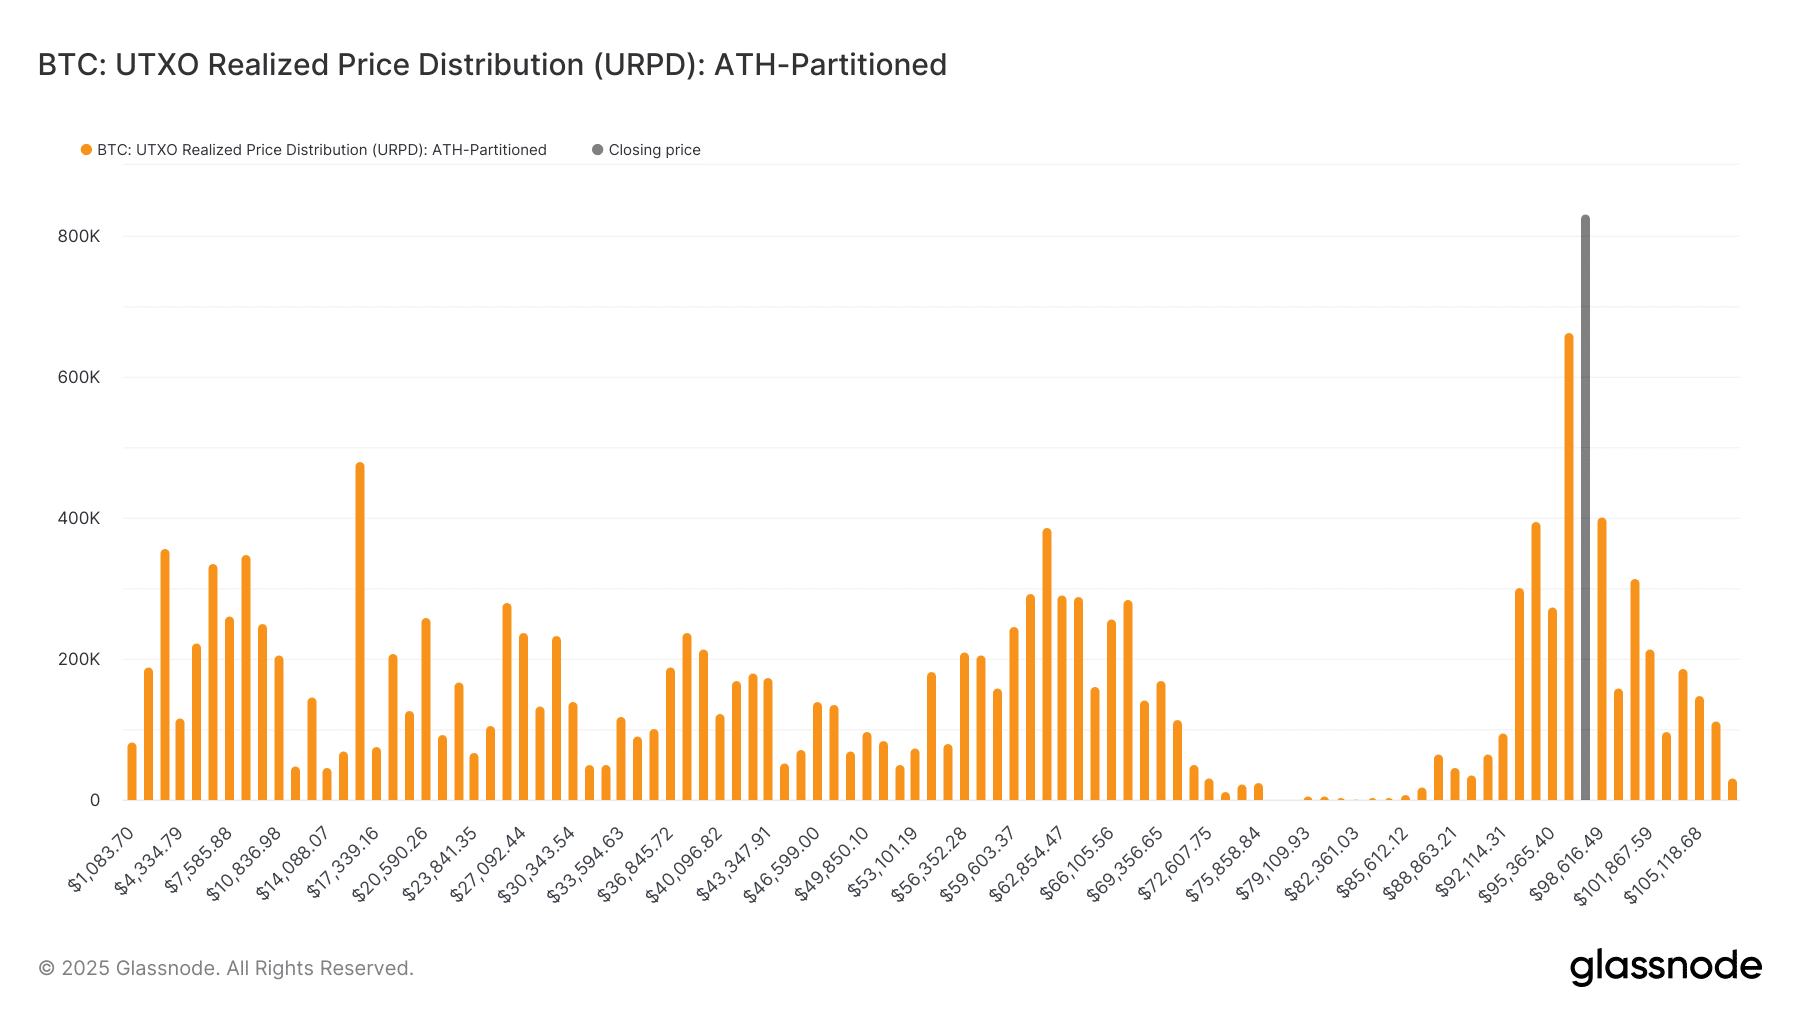
Above $101,000, however, is a different story. Bitcoin will need a proper rally to bust through that resistance. Can it summon the energy? Stay tuned. 🙄
BTC’s Technical Indicators: Hope and Caution in a Delicate Balance
Looking at Bitcoin’s technicals, it’s been holding steady, still trading below the 50-day moving average of $98,801. Not exactly the most exciting place to be, but at least it’s not plummeting off a cliff.
And don’t forget the 200-day moving average, sitting pretty at $80,021, like a comfy safety net. 😌
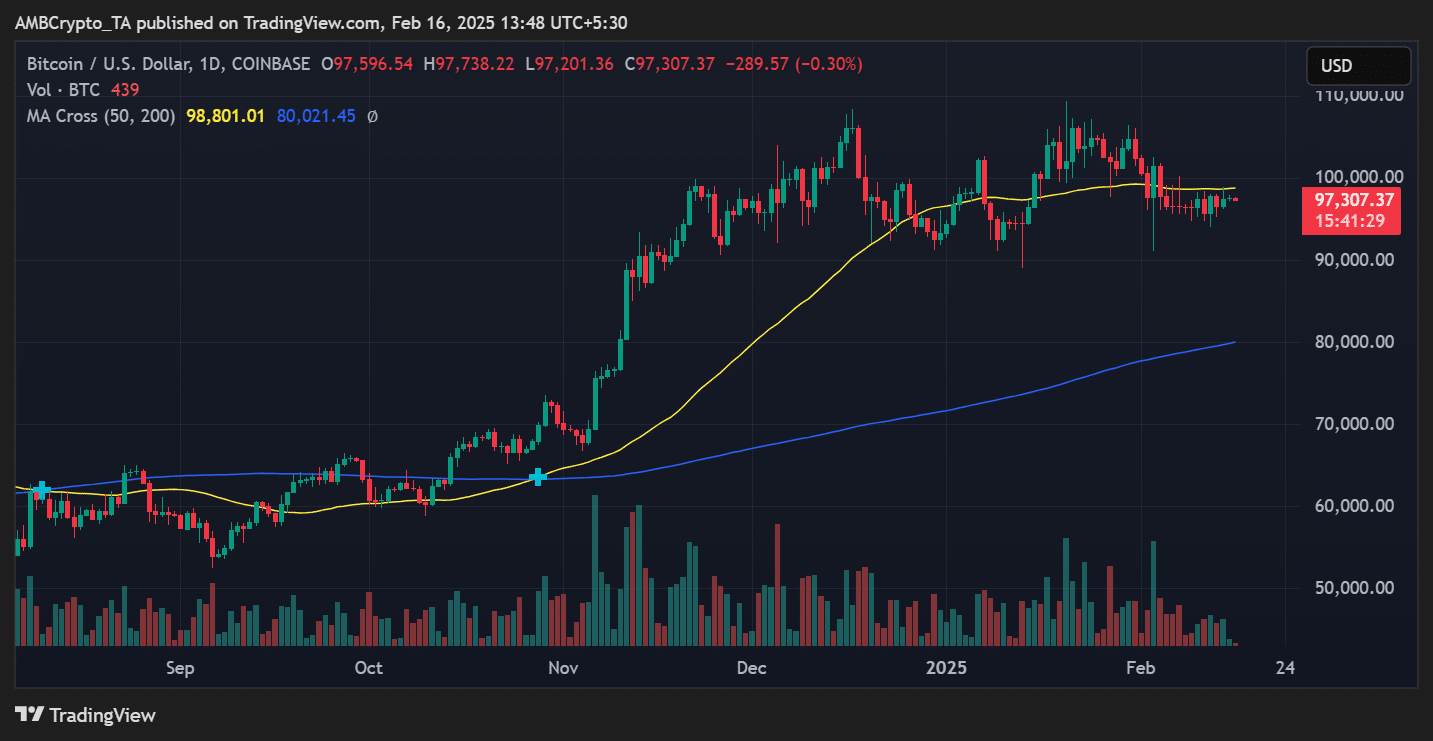
The price is struggling with some resistance, but the overall bullish structure remains intact. Translation: if buyers can muster enough enthusiasm, another rise is on the horizon. Go ahead, do your thing, Bitcoin.
The Big Question: Will Bitcoin Soar or Crash?
At this juncture, Bitcoin’s market positioning is like a coin toss. The MVRV bands whisper of upside potential, while the UTXO distribution warns of key support and resistance zones. Classic Bitcoin, always keeping us on our toes.
If it manages to break above $101,000, prepare yourself for fireworks. If it falls below $90,000… well, it might just give us all a reason to panic for a while. 🥴
Keep your eyes peeled, my friends. This could go either way. Or both. Who knows? It’s Bitcoin.
Read More
2025-02-17 05:16