- QNT triumphantly shatters resistance, skyrocketing 15.29% as bulls set their sights on the $135-$140 price range.
- Open Interest leaps 23.98% to $13.47M, signaling robust trader confidence and bullish momentum.
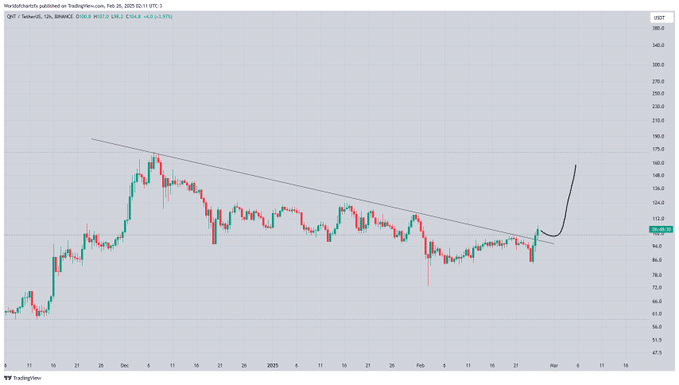
Quant [QNT] has valiantly broken free from a long-standing downtrend, hinting at a potential rally towards the $135-$140 range.
At the time of writing, QNT was trading at $106.15, marking a 15.29% daily increase and a 10.65% rise over the past week. With a circulating supply of 15 million QNT, the token boasts a market capitalization of $1.50 billion.
Key levels and price action
As we speak, Quant’s price chart reveals a clear-cut breakout from a descending trendline that has been in place since December 2023.
This breakout signifies a shift in market sentiment, as buyers propel QNT towards higher resistance levels.
With this breakout confirmed, the next resistance zone lies between $135 and $140, a historically significant level. If buying momentum persists, QNT could test these levels in the coming days.
On the downside, if QNT fails to hold above the breakout zone, the previous resistance at $95-$100 will act as key support.
Holding this level would confirm the breakout’s validity, while a drop below could lead to further consolidation.
Strengthening momentum ahead
Technical indicators suggest that QNT’s bullish momentum is gaining traction. The Relative Strength Index (RSI) stands at 59.68, nearing bullish territory but not yet in the overbought zone.
If RSI moves above 70, it could indicate resistance, potentially leading to a short-term pullback.
The MACD line at 1.56 has crossed above the signal line at -0.08, forming a bullish crossover. Additionally, the MACD histogram turned positive, reflecting increasing buying pressure.
If this trend continues, QNT could maintain its upward trajectory, further confirming the breakout’s strength.

Futures market and spot activity
According to Coinglass data, QNT’s Open Interest surged 23.98% to $13.47M, indicating rising trader participation. Historical data suggests that OI spikes above $30M in December and April led to higher price volatility.
If Open Interest continues to rise, QNT could see further price movement, potentially testing higher resistance levels.
Additionally, QNT spot netflow surged to $2.35M on the 26th of February, reflecting a strong inflow of assets into exchanges. This could indicate potential selling pressure, as traders may be preparing to offload holdings.
However, if market demand absorbs the inflow, QNT could sustain its bullish momentum and continue its upward move.

Can QNT sustain its bullish run?
With growing Open Interest, rising trading volume, and bullish technical signals, QNT appears to be in a strong position for further gains. If momentum holds, a move toward the $135-$140 resistance zone remains likely.
Traders will closely monitor volume trends, RSI levels, and price action to assess whether QNT can maintain its upward trajectory or enter a consolidation phase.
Read More
- Gold Rate Forecast
- PI PREDICTION. PI cryptocurrency
- Rick and Morty Season 8: Release Date SHOCK!
- Discover Ryan Gosling & Emma Stone’s Hidden Movie Trilogy You Never Knew About!
- SteelSeries reveals new Arctis Nova 3 Wireless headset series for Xbox, PlayStation, Nintendo Switch, and PC
- Masters Toronto 2025: Everything You Need to Know
- Mission: Impossible 8 Reveals Shocking Truth But Leaves Fans with Unanswered Questions!
- Discover the New Psion Subclasses in D&D’s Latest Unearthed Arcana!
- Linkin Park Albums in Order: Full Tracklists and Secrets Revealed
- We Loved Both of These Classic Sci-Fi Films (But They’re Pretty Much the Same Movie)
2025-02-27 01:15