Author: Denis Avetisyan
A new stochastic model captures how light propagates through complex, ever-changing environments, offering insights into phenomena like atmospheric scintillation.
This review details a stochastic partial differential equation approach to light propagation in space-time random media, incorporating fractional Brownian motion and hyperbolic Anderson modeling.
Understanding light propagation through turbulent, time-varying media remains a significant challenge in optical physics. This is addressed in ‘Study on Light Propagation through Space-Time Random Media via Stochastic Partial Differential Equations’, which introduces a stochastic model leveraging stochastic partial differential equations to characterize light’s behavior in such complex environments. The research demonstrates that non-Markovian characteristics and spatial correlations substantially influence propagated light fields, validated through outdoor experiments and quantified by metrics like the scintillation index. Could this framework ultimately enable more robust designs for free-space optical communication and advanced imaging systems operating in challenging atmospheric conditions?
The Illusion of Order: Randomness in the World Around Us
A surprising number of real-world systems, from the scattering of light through fog to the flow of fluids in porous rocks and even the propagation of ultrasound in biological tissues, are fundamentally characterized as random media. These materials lack the predictable, uniform structure that underpins traditional modeling techniques; their properties fluctuate unpredictably across space. Consequently, applying conventional analytical methods-often reliant on assumptions of homogeneity and regularity-can yield inaccurate or misleading results. This necessitates the development of novel approaches that explicitly account for the inherent disorder, allowing for more realistic simulations and a deeper understanding of phenomena within these complex environments. The challenge lies not merely in describing what happens within random media, but in accurately predicting how it happens, demanding innovative mathematical frameworks and computational tools.
Traditional analyses of disordered materials often rely on the simplifying assumptions of homogeneity and isotropy – that a material’s properties are uniform and identical in all directions. However, many real-world “random media,” such as fractured rocks, biological tissues, and certain composite materials, exhibit intricate internal correlations that invalidate these assumptions. These correlations arise from complex microstructures and interactions, meaning a property measured at one point significantly influences measurements at others, and directional dependencies are prevalent. Accurately characterizing these media therefore necessitates advanced techniques capable of resolving these spatial correlations, potentially employing methods like n\$-point correlation functions or sophisticated statistical modeling to capture the full complexity of their internal structure and predict their effective properties. Ignoring these correlations leads to inaccurate predictions and a limited understanding of how these materials behave, hindering advancements in fields ranging from geophysics and materials science to biomedical engineering.
Whispers of Memory: Fractional Brownian Motion
Fractional Brownian Motion (fBm) is a Gaussian process used to model time series data exhibiting long-range dependence, a characteristic where correlations persist over extended time intervals. Unlike standard Brownian motion which assumes independent increments, fBm incorporates a parameter, the Hurst exponent H, to define the degree of self-similarity and long-term memory within the process. This allows fBm to accurately represent phenomena in various fields, including fluid dynamics, finance, and image processing, where traditional stochastic models fail to capture the observed temporal correlations present in random media. The mathematical framework relies on defining the increments of the process as having a power-law autocorrelation function, enabling the quantification and modeling of these persistent or anti-persistent dependencies.
The Hurst Index, denoted as H, is a statistical measure used to quantify long-range dependence in time series data, and ranges between 0 and 1. A value of 0.5 indicates a Brownian motion with no correlation; values greater than 0.5 suggest persistent behavior, where large values are more likely to be followed by other large values, and small values by small values. Conversely, a Hurst Index less than 0.5 indicates anti-persistent behavior, where a large value is more likely to be followed by a small value, and vice versa. The index is typically estimated using techniques like rescaled range analysis or detrended fluctuation analysis, and provides a critical parameter in defining the characteristics of Fractional Brownian Motion H.
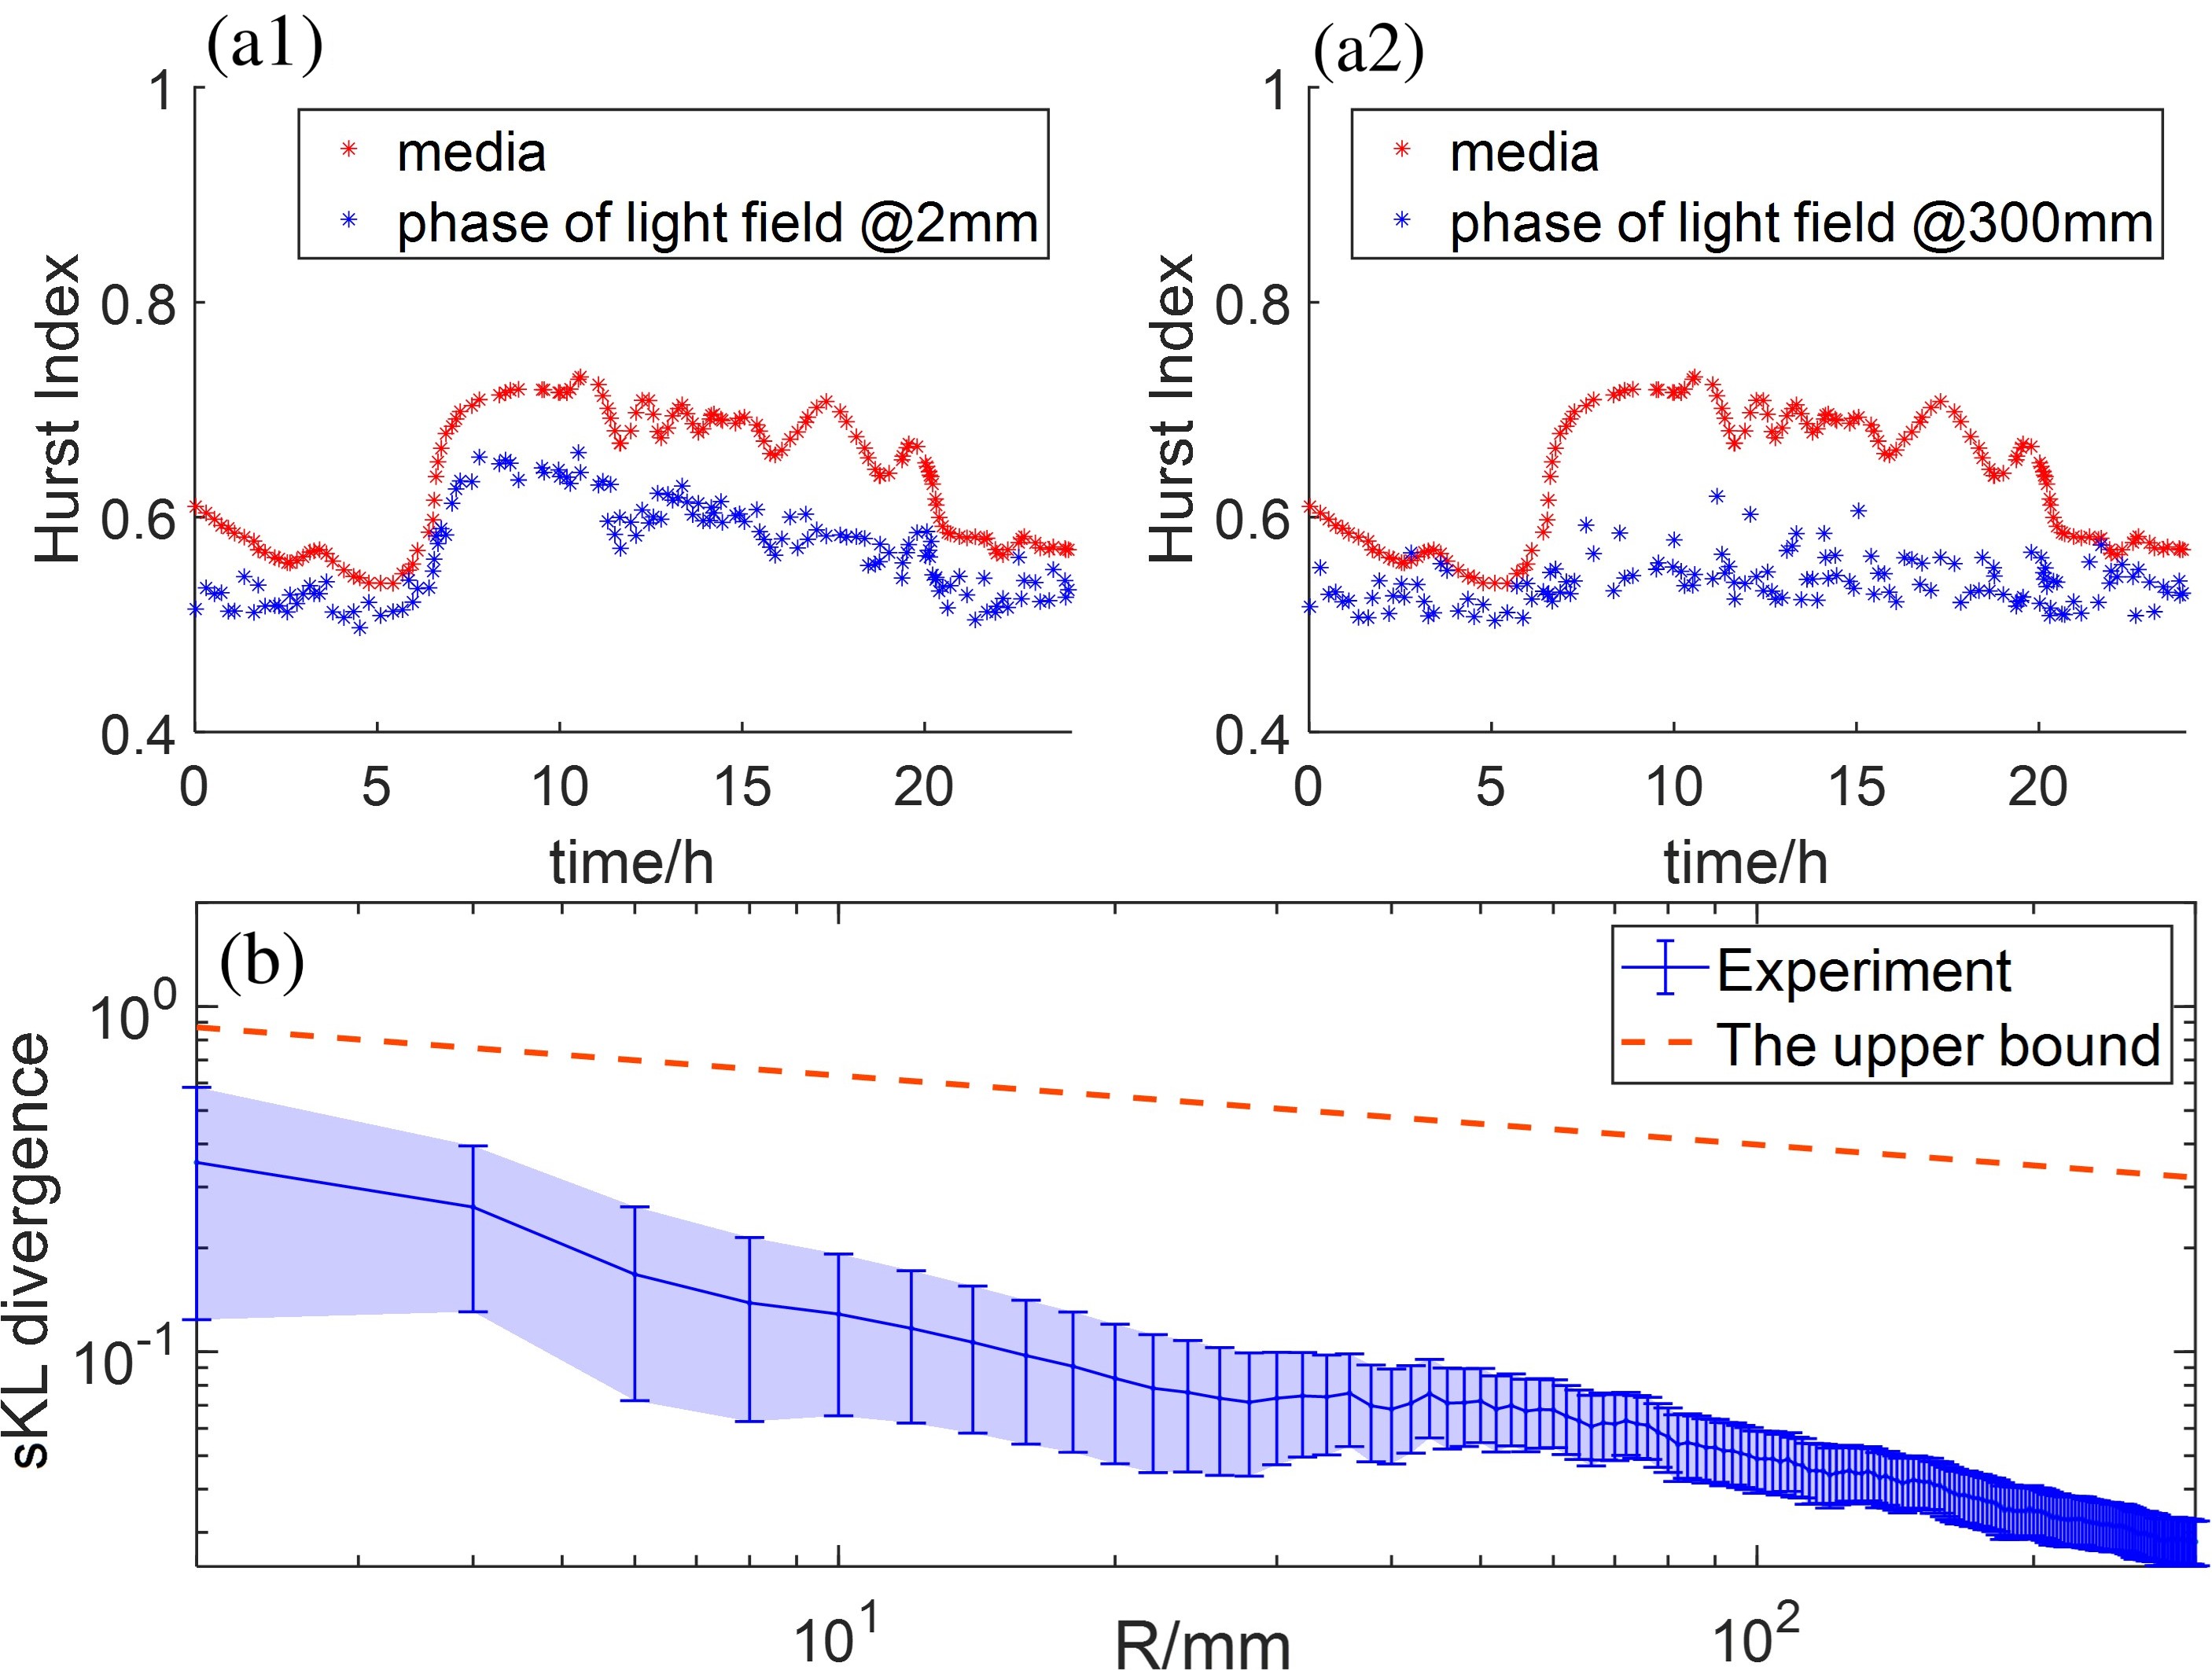
Fractional Brownian Motion (fBm) distinguishes itself from simpler stochastic models by its capacity to model both persistent and anti-persistent temporal correlations. Persistent behavior indicates a positive autocorrelation, where past trends continue into the future, while anti-persistent behavior demonstrates negative autocorrelation, suggesting a reversal of past trends. Experimental validation of fBm’s modeling capabilities has been observed in studies analyzing correlation reduction with varying aperture sizes; specifically, data shows a Pearson correlation coefficient of 0.905 for a 2mm aperture, decreasing to 0.341 with a 300mm aperture, illustrating the model’s sensitivity to scale and its ability to capture complex system dynamics beyond those represented by purely random or trending processes.
Tracing the Past: Rescaled Range Analysis in Practice
Rescaled Range Analysis (RRA) is a statistical technique used to characterize the long-term memory of time series. Developed by Harold Edwin Hurst in the 1950s, RRA estimates the Hurst exponent, H, by examining the scaling relationship between the range of cumulative deviations of a time series and its time interval. The process involves calculating the rescaled range for various subseries lengths and then plotting the logarithm of the average rescaled range against the logarithm of the subseries length. The slope of this resulting line provides an estimate of H, with values between 0 and 1 indicating persistence (positive correlation), 0.5 representing a random walk, and values between 0.5 and 1 indicating anti-persistence (negative correlation). This method has been applied across diverse fields, including hydrology, finance, and climatology, to assess the degree of long-range dependence in observed data.
Rescaled Range Analysis (RRA) quantifies the variability of a time series by calculating the range, R, of the cumulative deviation from the mean for different time intervals. This range is then normalized by the standard deviation, σ, of the time series and the time interval, n, resulting in the rescaled range, R/(\sigma \sqrt{n}) . By examining the relationship between the rescaled range and the time interval across multiple subseries of varying lengths, the Hurst exponent, H, can be estimated as the slope of a log-log plot of the rescaled range versus the time interval. This normalization aims to account for both the magnitude of fluctuations and the duration over which they are measured, providing a scale-independent measure of time series roughness.
Rescaled Range Analysis (RRA) fundamentally assumes the time series data exhibits long-range dependence, specifically stationarity and self-similarity. Deviations from these assumptions can introduce bias into the Hurst exponent estimate. Specifically, non-stationarity, such as trends or seasonality, violates the requirement for a consistent scaling behavior, leading to inaccurate results. Furthermore, RRA is known to be susceptible to noise; high-frequency random fluctuations can artificially inflate the estimated range, thereby impacting the Hurst exponent and potentially mischaracterizing the underlying fractal behavior of the time series. Consequently, data preprocessing techniques, like detrending or filtering, are often necessary to mitigate these effects and improve the reliability of the Hurst estimate derived from RRA.
Echoes of Structure: Spatial Correlations and Power-Law Spectra
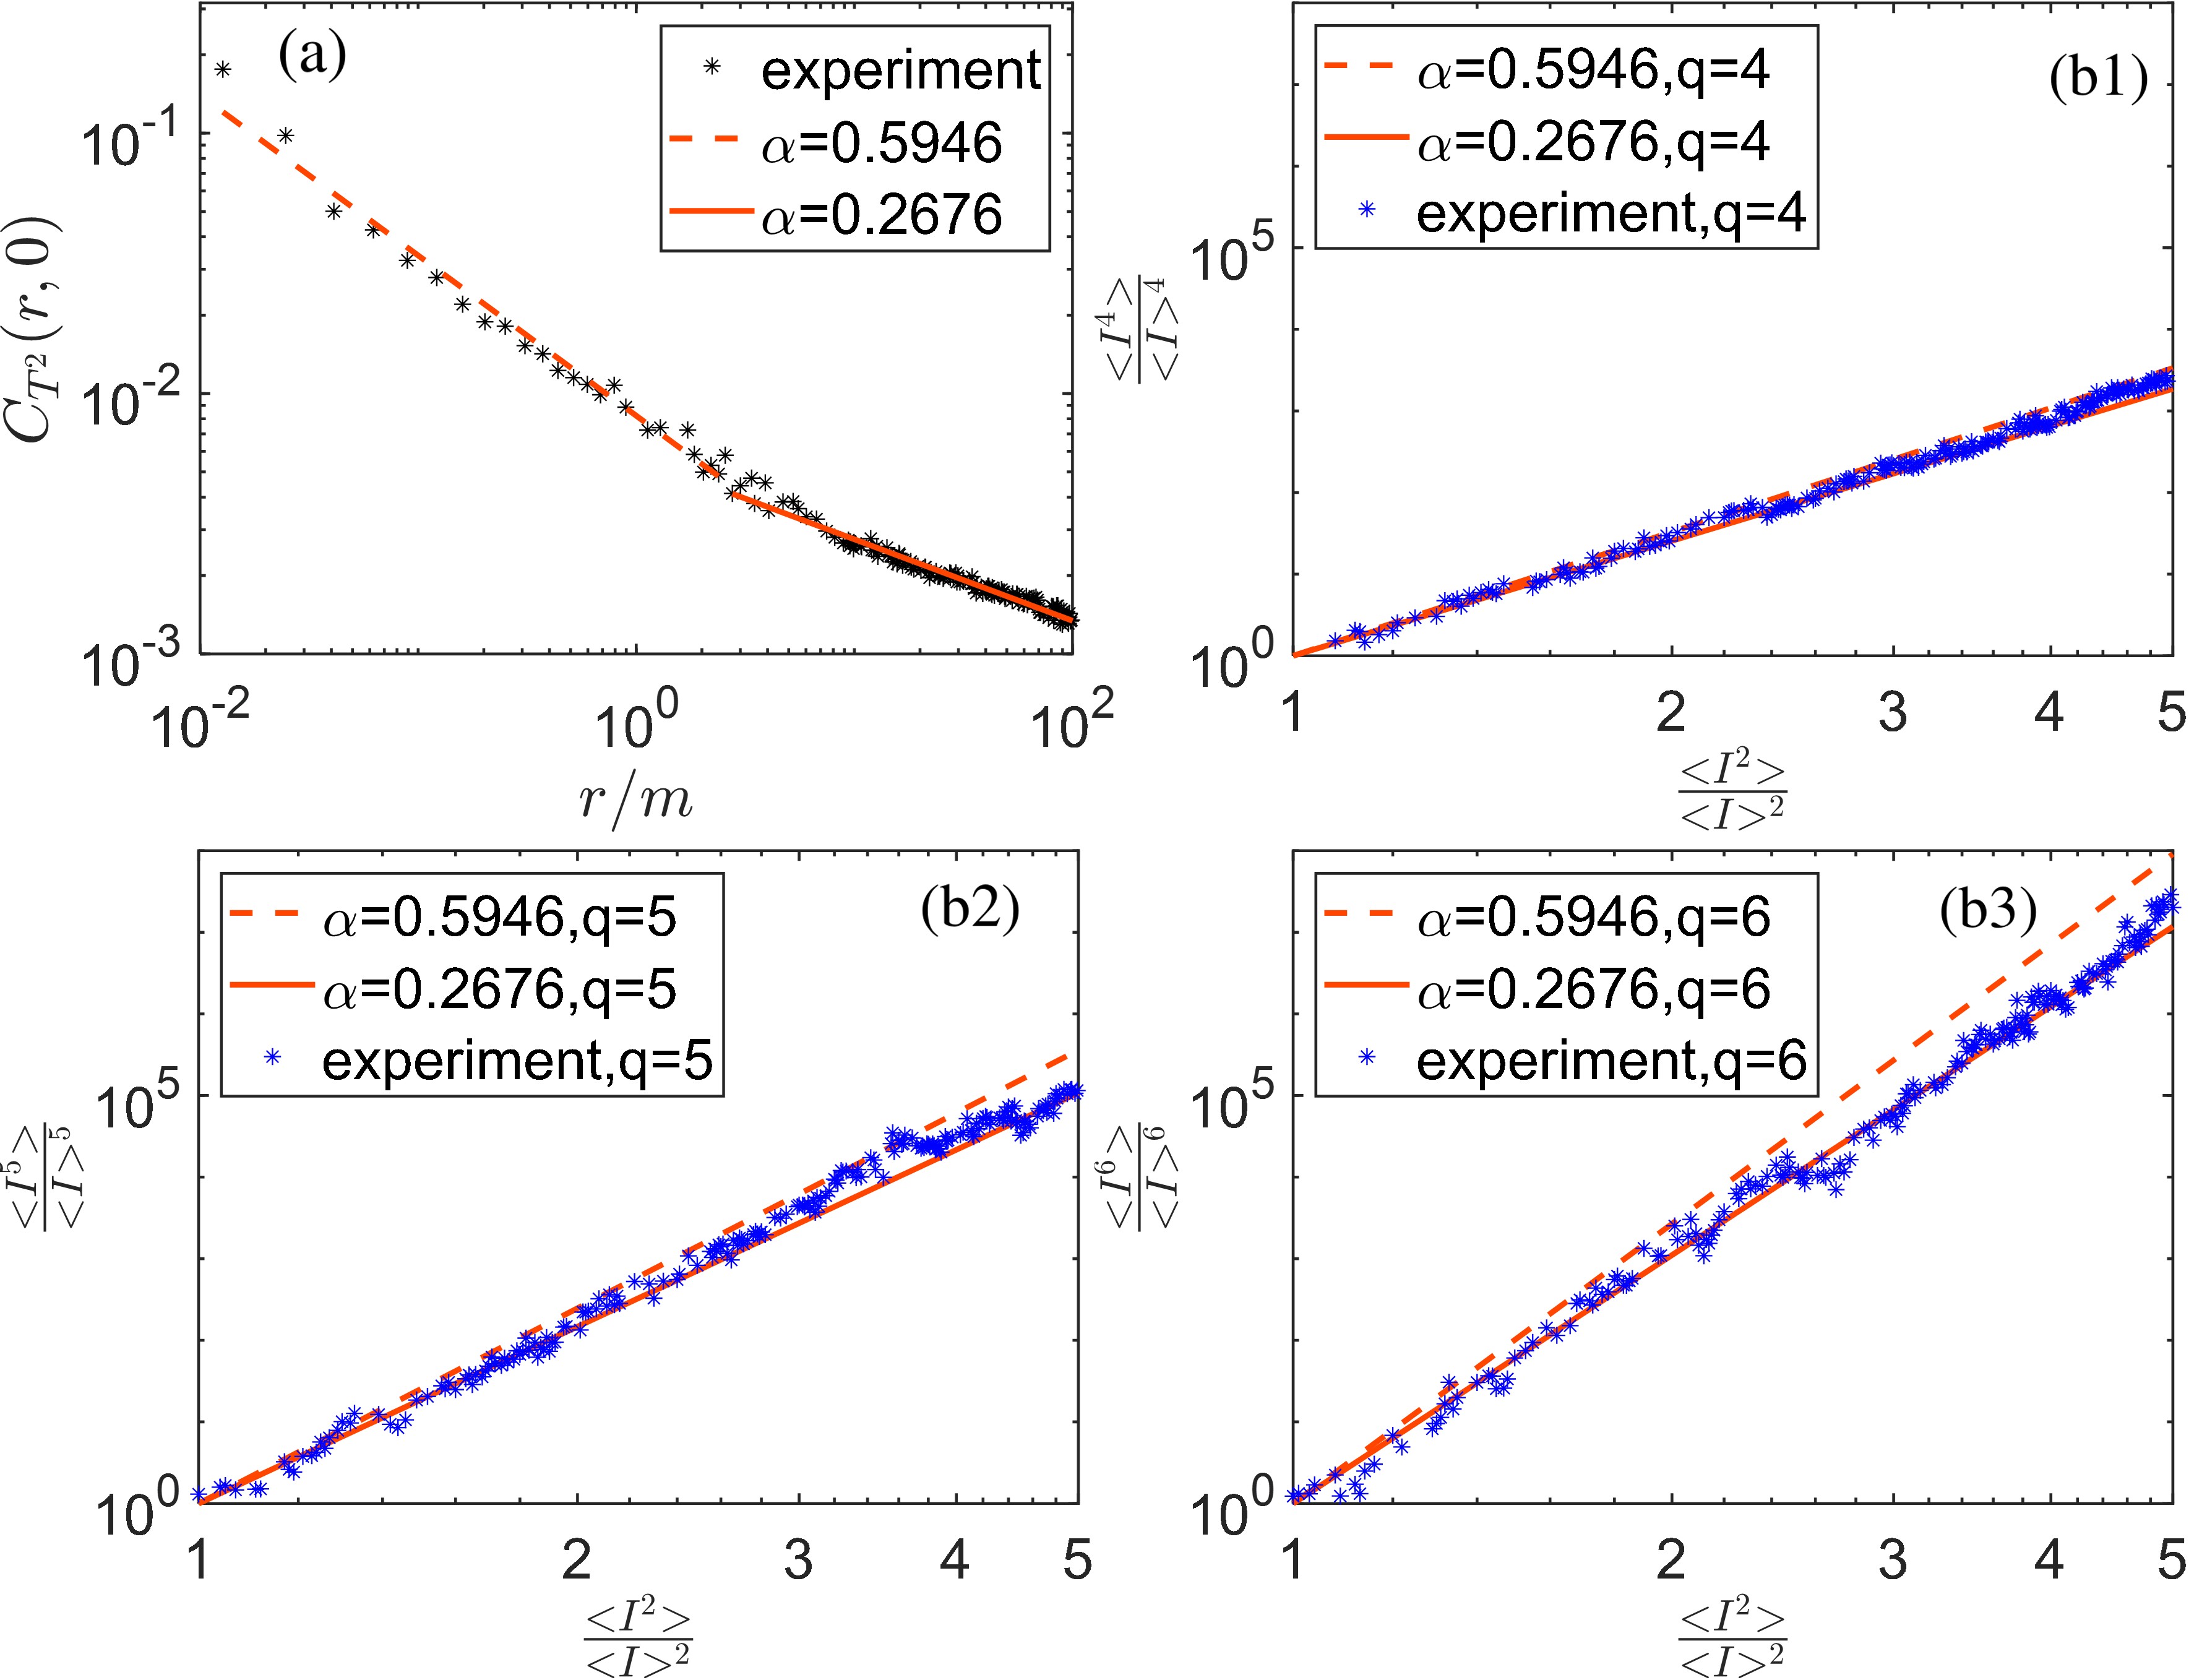
The behavior of scalar fields within complex, disordered environments – often termed random media – frequently exhibits spatial correlations best characterized by a power-law spectrum. This spectrum doesn’t simply describe that correlation exists, but crucially, how it diminishes with increasing distance. A power-law relationship implies that the correlation strength doesn’t fade uniformly; instead, it decays proportionally to a power of the distance, indicating a hierarchical structure within the medium. Essentially, similar patterns repeat at different scales, creating a self-similar organization. Analyzing this spectrum allows researchers to quantify the roughness or homogeneity of the random medium and provides insight into the underlying physical processes governing the field’s propagation, influencing phenomena ranging from light scattering to turbulence and even the distribution of matter in the universe. The exponent of this power law is a critical parameter, defining the rate of decay and reflecting the degree of order or disorder present in the system.
The manner in which correlations diminish with increasing distance within a random medium provides a crucial window into its hidden structure. A power-law spectrum quantifies this decay, effectively mapping the relationships between points at varying separations. Strong correlations at short distances suggest highly organized, clustered features, while rapid decay indicates a more homogeneous and disordered medium. By analyzing the exponent of this power law – how quickly the correlation ‘falls off’ with distance – researchers can characterize the medium’s roughness, porosity, or the scale of its dominant fluctuations. This technique isn’t simply about measuring randomness; it’s about discerning patterns within that randomness, revealing whether the medium exhibits features clustered at specific scales, or if its properties are distributed more uniformly. Ultimately, understanding this correlation decay is vital for predicting how waves, light, or other signals propagate through complex environments.
Characterizing turbulent flows within random media requires a nuanced understanding of spatial correlations, and Extended Self-Similarity (ESS) provides a critical parameter – the spatial power law indicator – to achieve this. Recent investigations utilized a highly refined experimental setup, employing a laser source with a narrow linewidth of 0.85 kHz and an intermediate frequency of 80 MHz to ensure exceptionally precise amplitude and phase measurements. The selection of a Short-Time Fourier Transform (STFT) bin width of 10 kHz, exceeding the Nyquist sampling rate for the media’s fluctuations-approximately 1 kHz-allowed for accurate resolution of these dynamic patterns. Importantly, findings from these studies corroborate theoretical predictions, specifically demonstrating that the sKL divergence – a measure of the difference between two probability distributions – scales with C^2R^{-\alpha^2}, thus validating the ESS framework and its capacity to quantify turbulence characteristics within complex media.
The study meticulously details light propagation through space-time random media, acknowledging the inherent complexities of modeling such phenomena. This pursuit echoes a sentiment expressed by Ernest Rutherford: “If you can’t explain it to me simply, you don’t understand it well enough.” The research demonstrates that simplifying assumptions – like those often employed in traditional models – can obscure crucial non-Markovian characteristics and spatial correlations, necessitating strict mathematical formalization. The validation through outdoor experiments underscores the importance of grounding theoretical frameworks in empirical observation, ensuring any model doesn’t succumb to the limitations of incomplete understanding, much like a theory vanishing beyond an event horizon.
What Lies Beyond the Horizon?
The presented work, while establishing a framework for modeling light propagation through stochastic space-time media, merely illuminates the depth of what remains unknown. The reliance on the hyperbolic Anderson model, while practically expedient, presupposes a separation of scales that may not hold universally. Any attempt to extend this approach to regimes where temporal and spatial correlations are intrinsically intertwined demands rigorous mathematical analysis and, inevitably, numerical methods. The stability of solutions to the governing stochastic partial differential equations under increasingly complex boundary conditions requires further investigation.
Furthermore, the validation through outdoor experiments, while laudable, introduces inherent limitations in controlling the true nature of the atmospheric turbulence. The scintillation index, a convenient metric, offers only a partial description of the full field behavior. A complete understanding necessitates consideration of higher-order statistical moments and the development of novel observational techniques. The assumption of fractional Brownian motion, while capturing non-Markovian effects, represents a specific choice within a broader class of stochastic processes.
Ultimately, this work serves as a reminder that any model, however sophisticated, is but a fleeting approximation of reality. The true complexity of light’s interaction with a turbulent universe likely exceeds the capacity of current analytical tools. The horizon of knowledge, like that of a black hole, promises an ever-expanding boundary of ignorance, a humbling truth for those who dare to peer into the void.
Original article: https://arxiv.org/pdf/2601.11213.pdf
Contact the author: https://www.linkedin.com/in/avetisyan/
See also:
- Gold Rate Forecast
- Forza Horizon 6 Car List So Far: Confirmed Highlights, Cover Cars, DLC, and Rewards
- 10 Greatest Manga Endings of All Time
- Mark Zuckerberg & Wife Priscilla Chan Make Surprise Debut at Met Gala
- Elon Musk’s Ex Ashley St. Clair Reveals When Romance Became “Weird”
- Why There’s No New Episode Of From S4 This Weekend (May 24) & When The Show Returns
- OKB PREDICTION. OKB cryptocurrency
- 10 Most Powerful Versions of Superman, Ranked
- Hollow Knight: Silksong Guide – All 30 Lost Flea Locations
- 38 Years Later, Murder, She Wrote’s Most Overlooked Episode Still Pulls Off TV’s Greatest Crossover
2026-01-21 07:39