So here we are again: Bitcoin, more temperamental than my last relationship, currently flirting outrageously at $103,581. Total market cap is flexing at $2.057 trillion, and 24-hour trading volume is $35.91 billion—because who needs sleep, right? Price ping-ponged between $101,109 and $104,293 today. Traders trading, bots botting, and somewhere, a billionaire misplaced his private keys.
Bitcoin
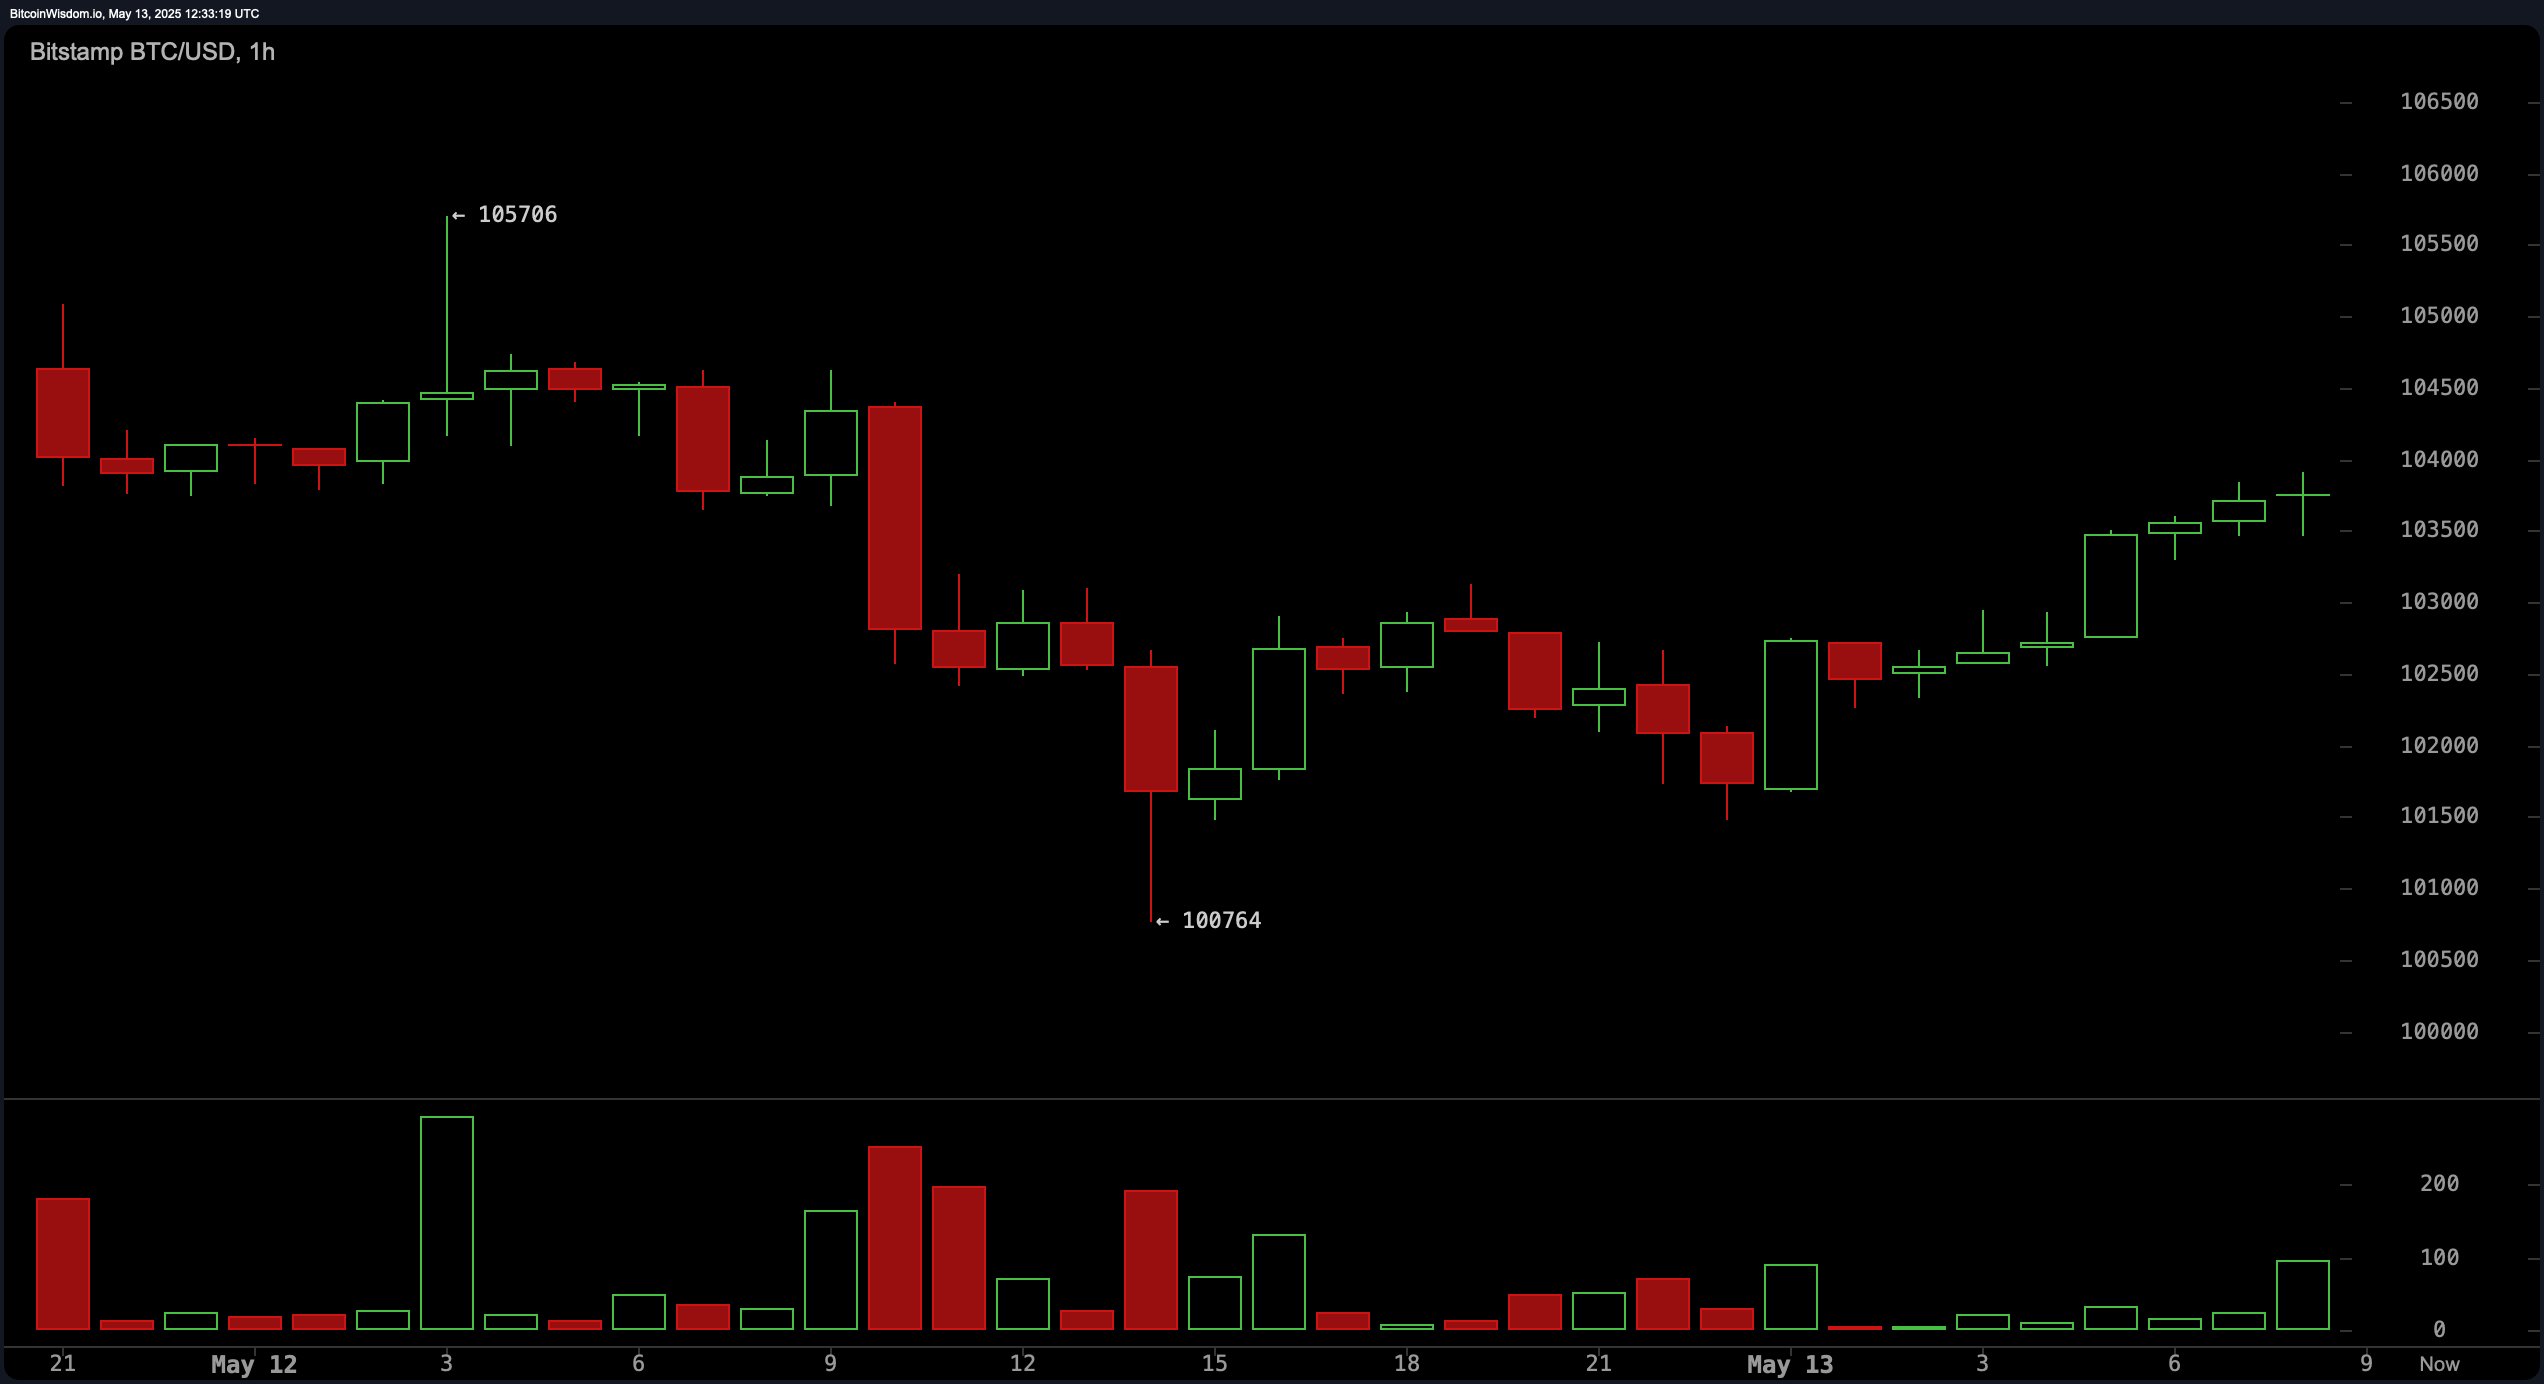
The 1-hour BTC/USD chart is honestly just drama: brief spiral downward, then a heroic V-shaped comeback—as if Bitcoin remembered it left the oven on. Now we’re glued to the $103,800 range like it’s the last breadstick at dinner. Higher lows tease us with hope, but volume is basically twiddling its thumbs in the corner—traders hedging their bets like they’re answering a text from their ex. Want some quick profit-induced adrenaline? Dip-buyers sniff around $103,000, scalpers lurking like raccoons. Deeper dips to $102,500? That’s for the bold (or the desperate, let’s be honest). Resistance looms at $104,500 to $105,000, the financial equivalent of a bouncer with a clipboard unless volume storms the doors.
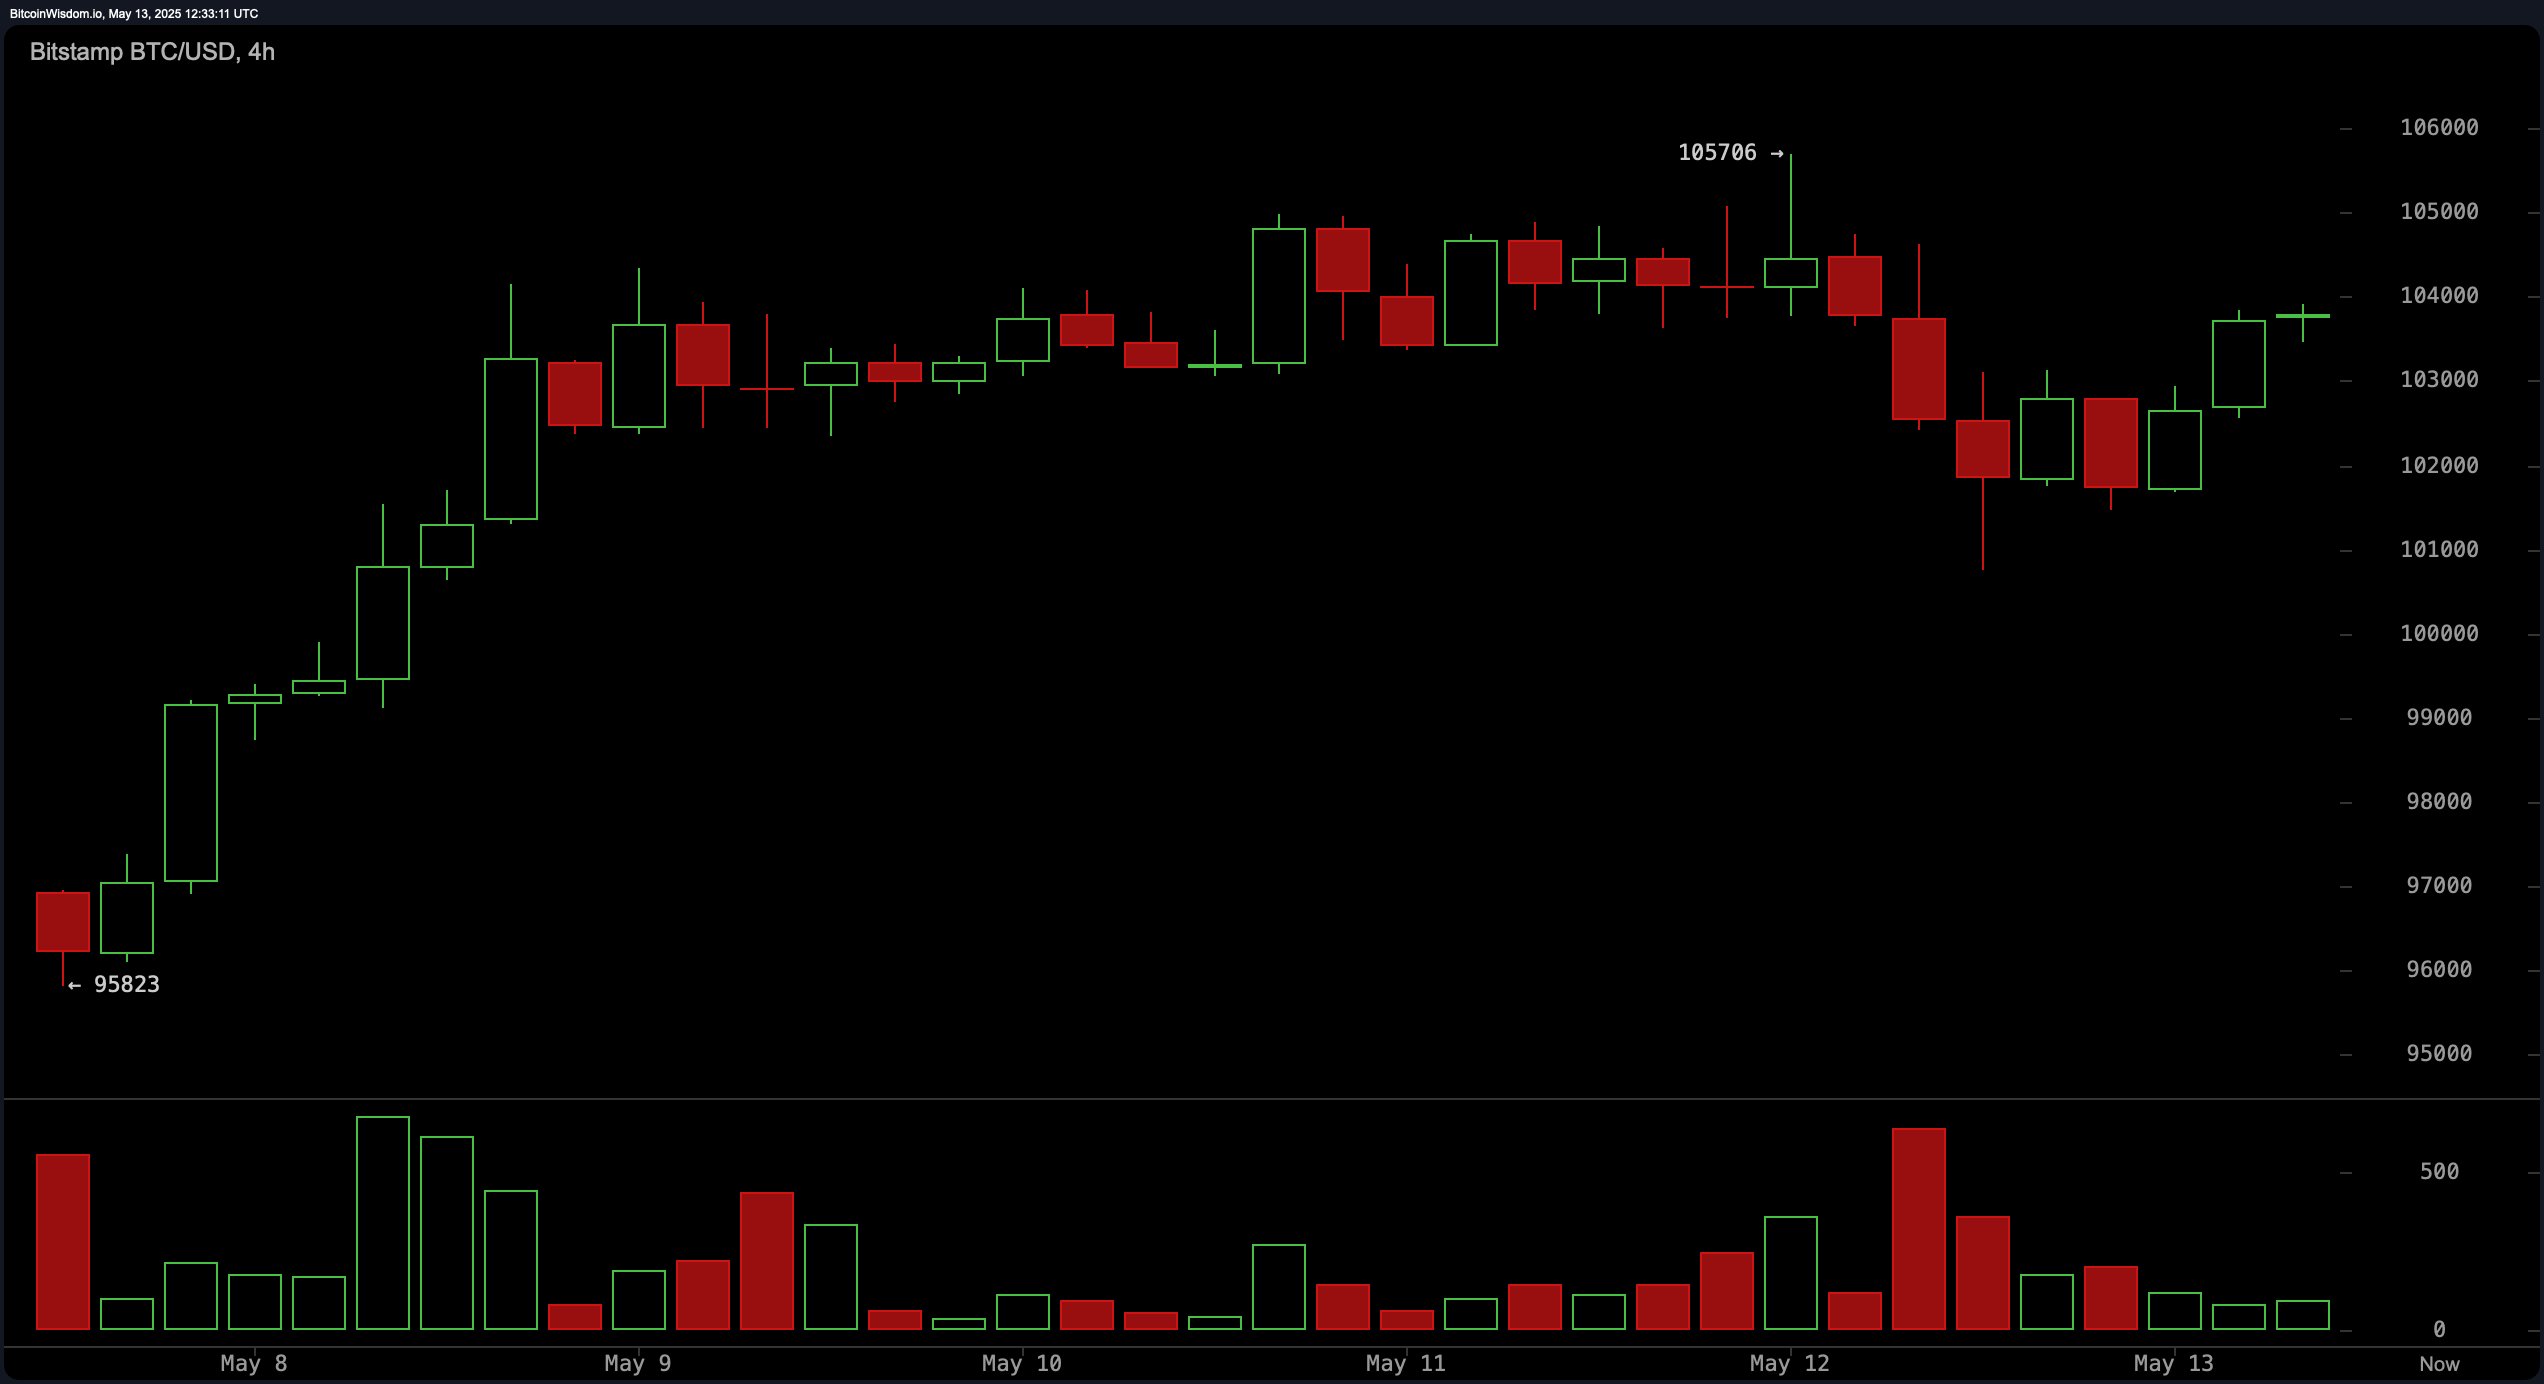
Zoom out to the 4-hour chart and things get complicated—like my Saturday mornings. We’ve fallen from an uptrend into “sideways consolidation” (otherwise known as “napping with one eye open”). Found a local bottom at $100,764, which sounds reassuring but, honestly, volume is still missing (starting to think volume eloped with conviction). Any upside push needs price to swagger confidently past $102,500–$103,000 while resistance is still glaring at $105,000 because it has nothing better to do.
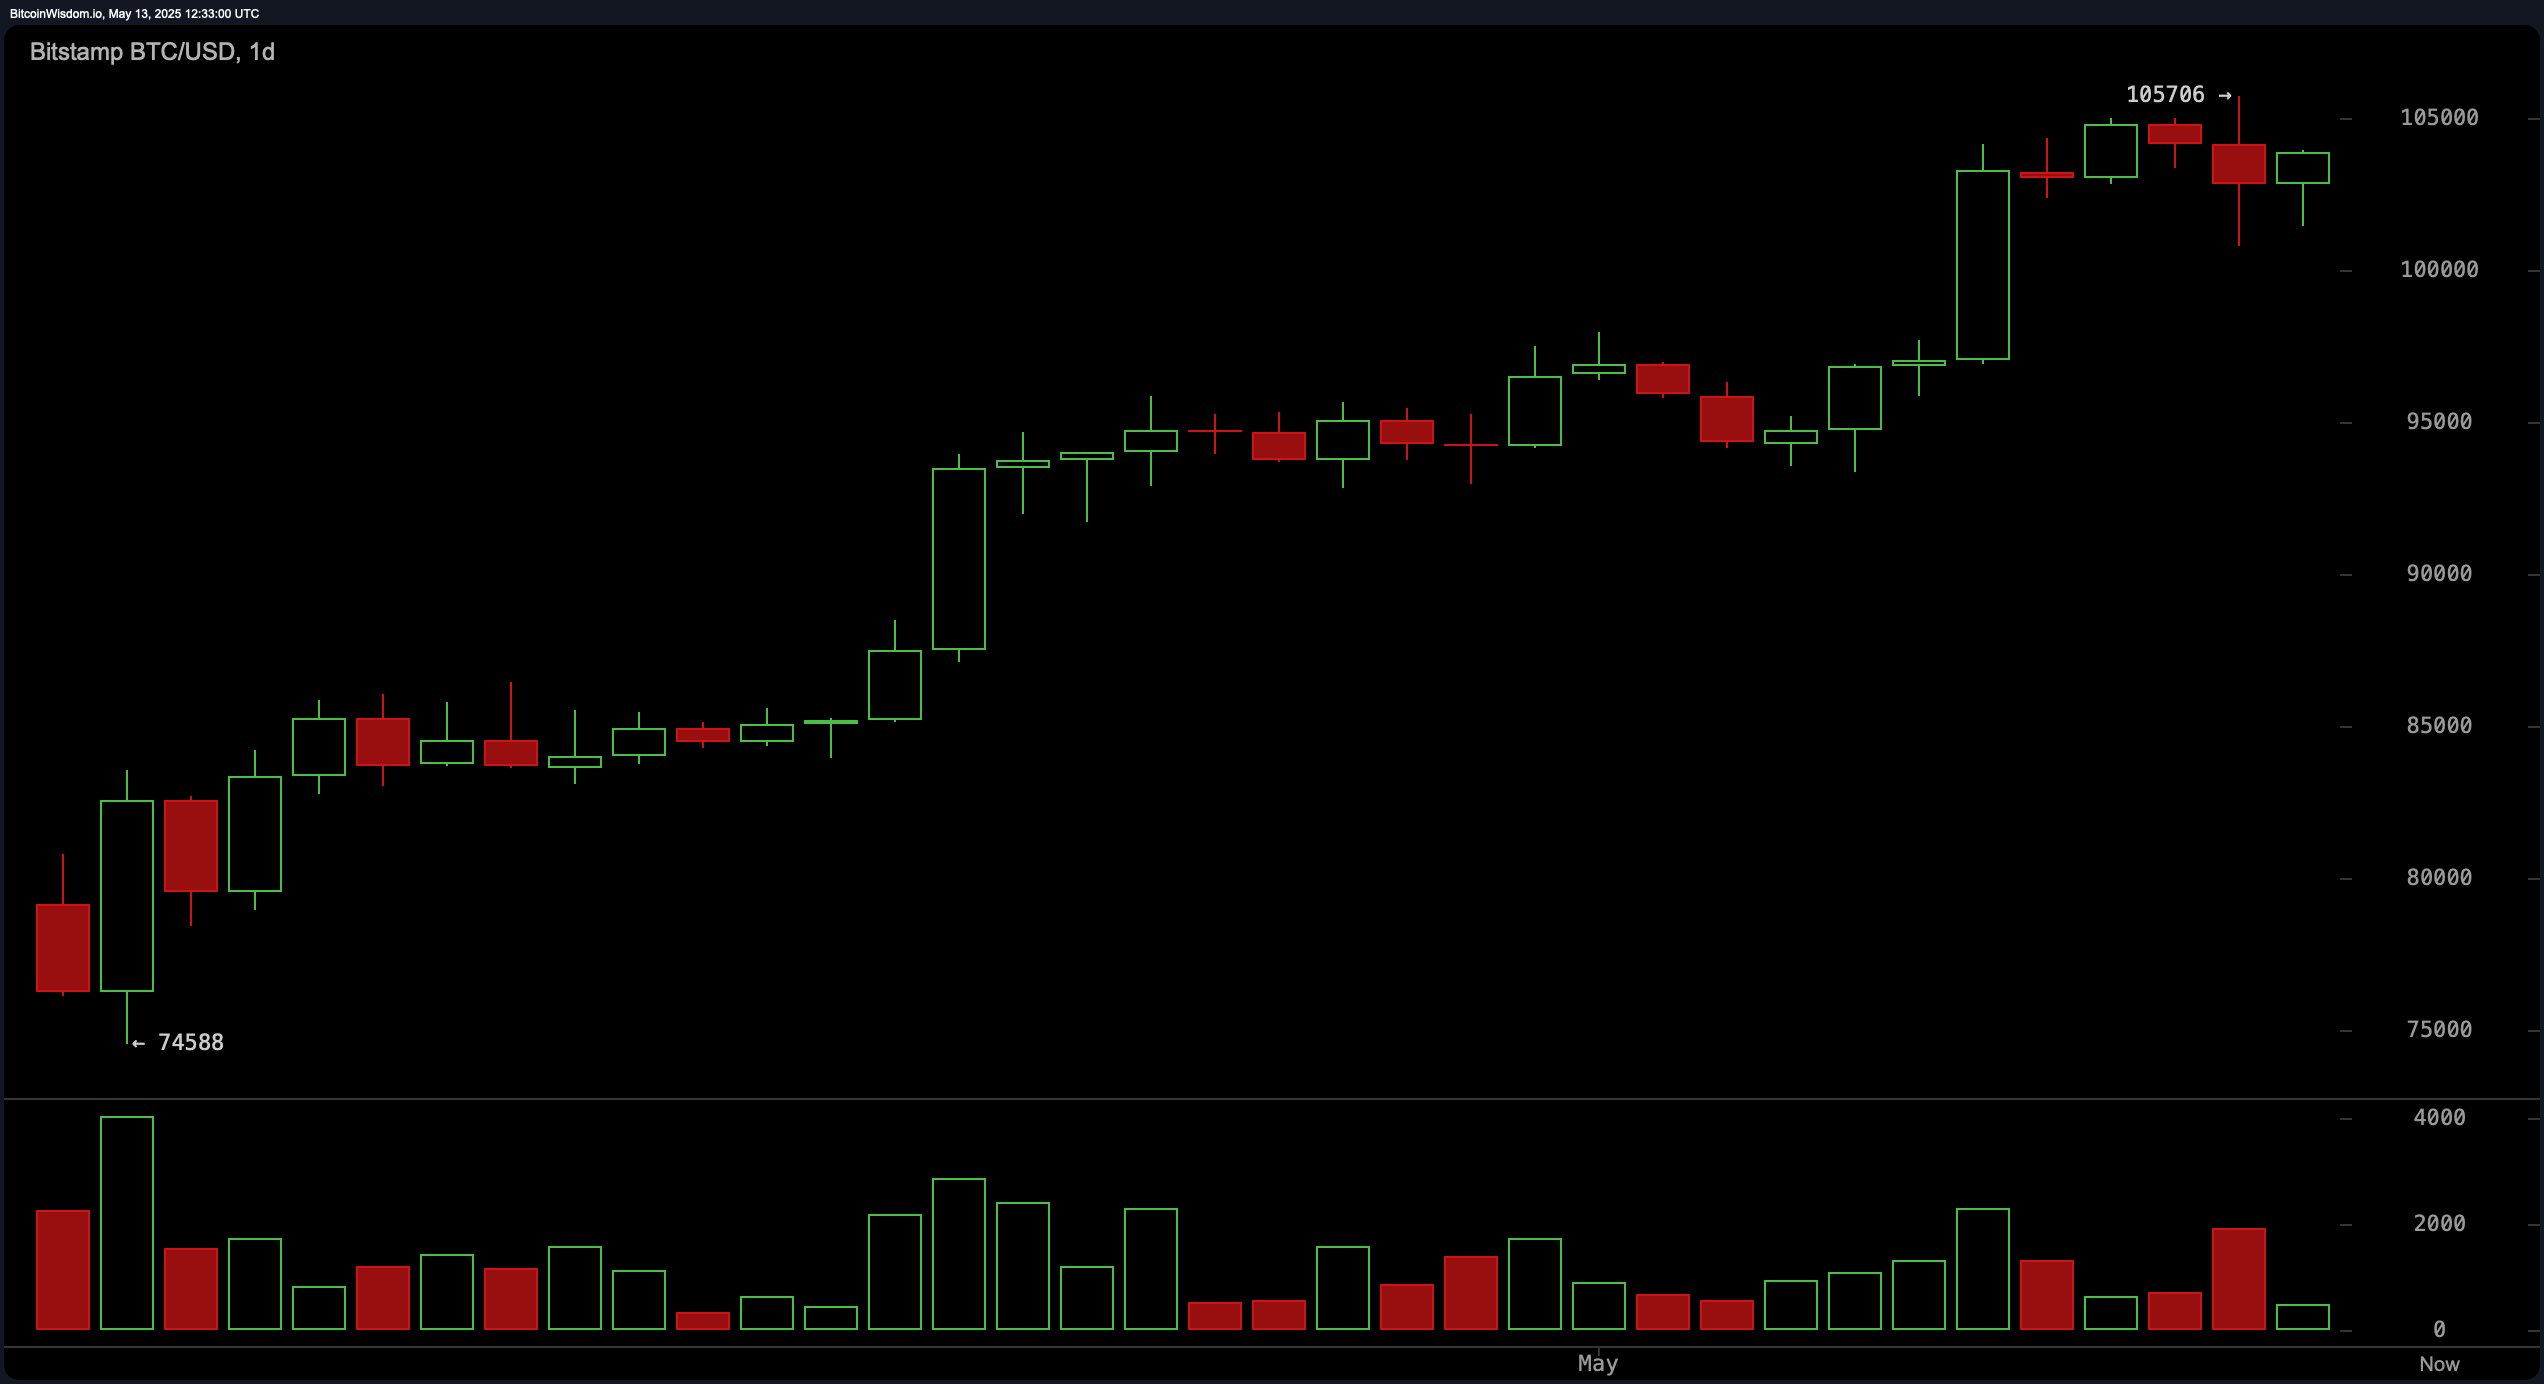
If you’re into Big Picture Angst, the daily chart’s your jam. We soared, we exhausted ourselves, now we’re eyeing a double top at $105,706 or…a glorious launch? (Suspense! 😱) Those shrinking red candles say buyers are sobering up. Should $98,000 to $100,000 make a cameo, classic “buy the dip!” shenanigans may ensue. Reversal candlesticks, bullish engulfing patterns, interpretive dance—pick your harbinger. But $105,000 to $106,000 is ready to slap down any advances not backed by serious volume. Go big or go…sideways.
Oscillator update! (No, it’s not a lightsaber.) On the 1-day: RSI chilling at 71, Stochastic at 85—acting all neutral—while CCI throws a hissy fit at 109 screaming “sell!”. Meanwhile, momentum (7,970) and MACD (4,090) make heart-eyes and whisper “buy” conspiratorially. ADX at 36 and the awesome oscillator at 11,033 are just here for a mildly bullish picnic. Cheers. 🍾
The legendary moving averages just can’t quit—every single one of them (10 EMA at 101,151, 200 EMA at 87,512 etc.) is yelling “buy!” like a crowd at a boy band concert. The trend is up, true, but don’t be shocked if prices do the cha-cha down to support levels now and then. More plot twists possible than in season two of your favourite show.
Bull Verdict:
Despite acting coy recently, bitcoin is still hot across all the timeframes. Moving averages are in full cheerleader mode. So long as prices don’t trip embarrassingly and volume cheers them on, we might just see another shot at the highs. Go on, surprise us. 🚀
Bear Verdict:
But wait, the mood could sour—overbought indicators, limp volume, and the ever-judgy $105,000 resistance threaten correction. If BTC faceplants below $100K, brace for a descent to the $96,000–$97,000 basement, where optimism gets slightly damp.
Read More
- Gold Rate Forecast
- PI PREDICTION. PI cryptocurrency
- Rick and Morty Season 8: Release Date SHOCK!
- Masters Toronto 2025: Everything You Need to Know
- We Loved Both of These Classic Sci-Fi Films (But They’re Pretty Much the Same Movie)
- Mission: Impossible 8 Reveals Shocking Truth But Leaves Fans with Unanswered Questions!
- SteelSeries reveals new Arctis Nova 3 Wireless headset series for Xbox, PlayStation, Nintendo Switch, and PC
- Eddie Murphy Reveals the Role That Defines His Hollywood Career
- LPT PREDICTION. LPT cryptocurrency
- Elden Ring Nightreign Recluse guide and abilities explained
2025-05-13 17:19