Well, well, well… it looks like Bitcoin’s having a little tantrum, falling below the mighty $110,000 mark, a price that used to be the comfy chair for all those lovely buyers. And guess what? The bulls? They’ve packed their bags. Traders are rushing to cash out their winnings like kids on Christmas morning. 🤑
After several attempts (and many failures) to keep that $116,000 resistance zone in check, BTC has decided it’s time to chill out below $109,000. The mood? Definitely less “party time” and more “uh-oh.” 😬 And as the broader market cools off like a forgotten cup of coffee, Bitcoin might just be headed for some lower support zones to test its mettle.
Technical Breakdown: Oh, the Drama of It All
Let’s get nerdy for a sec. The 4-hour and daily charts are showing us a dramatic rejection from the $116,000 resistance zone, followed by a sad drop in trading volume-classic sign of a trend reversal. Yup, it’s happening, folks. Grab your popcorn. 🍿
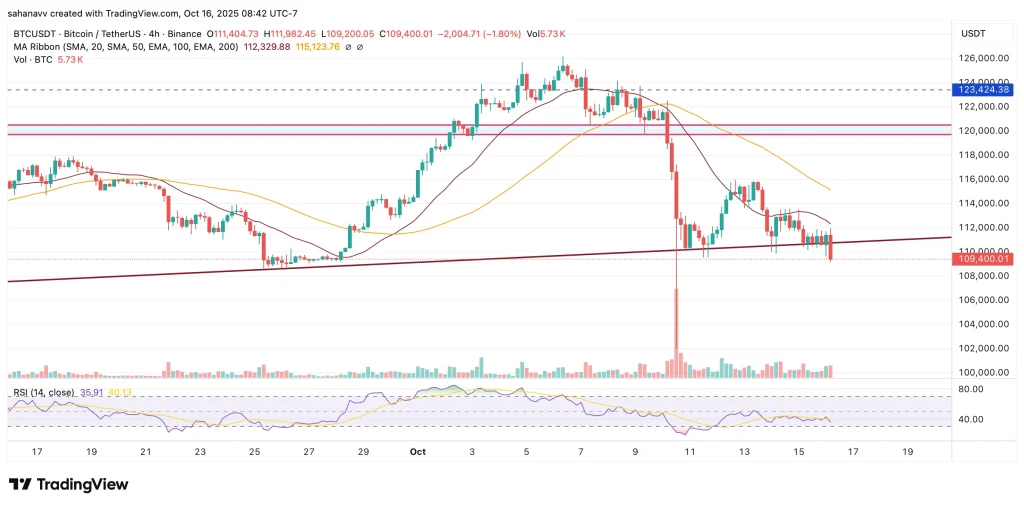
- Moving Averages: The 20-day moving average is just sitting there, flat as a pancake, near $111,000. Meanwhile, the 50-day MA is crawling toward $107,500. If it crosses below that? Oh boy, short-term pain might be on the way.
- RSI: The Relative Strength Index has dropped below 50-goodbye, momentum! The sellers are clearly taking the wheel now. 🏎️
- CMF (Chaikin Money Flow): And what’s this? The CMF’s gone negative. Looks like whales are leaving the party, folks. 🐋
The chart now looks like a sad little descending channel, hinting at more downside unless Bitcoin gets its act together and pulls a Houdini on this mess.
Key Levels to Watch: Keep Your Eyes Peeled
| Zone | Importance |
| $110,000-$111,000 | Oops, it broke! Now a tricky resistance zone. Beware! |
| $108,000 – $104,000 | Possible safe zone for buyers to swoop in. Or not. Who knows? |
| $100,000 – $95,000 | Big-time support, but don’t get too comfy. It could get messy! |
| $116,000 | Upper resistance-beat this and the bears will have to pack up. 🐻 |
If Bitcoin doesn’t manage to claim $110,000 and make it look easy, we might just see a move down toward $104,000-$100,000. Hold on tight!
On-Chain and Market Sentiment: No Need for Panic… Yet
Looking at the on-chain data, we can see a slight slowdown in accumulation. Whale wallets have been making their way to exchanges like it’s a Black Friday sale. 🦈 While derivative funding rates are neutral, it’s clear traders aren’t too sure which side of the fence to jump on just yet.
The overall sentiment is… let’s say… cautiously bearish. But hey, there’s still hope! Traders are eyeing that sweet $100,000 level, which just so happens to line up with Bitcoin’s long-term trend. So, no need to panic-yet.
Scenario Outlook and Price Targets: The Drama Continues
Bearish Scenario: If the selling pressure keeps pounding below $108,000, Bitcoin’s next stop could be $104,000. Cross that line, and it’s $100,000-$95,000 for the next thrilling episode.
Bullish Reversal Scenario: If Bitcoin bounces like a pro and reclaims $110,000, followed by a solid close above $112,500, we might just have a bullish party on our hands. Who doesn’t love a good comeback story? 🎉
Neutral/Range-Bound Setup: If Bitcoin decides to just sit around between $104,000 and $111,000 like a teenager on a lazy Sunday, the market will likely stay in limbo. It’s a “waiting game” situation. ⏳
Final Thoughts: Hold On, It’s Not Over Yet
Bitcoin’s fall below $110,000 is a huge plot twist in the short-term drama. For now, the bears are in control, and it looks like BTC might test some deeper support zones like $104,000-$100,000. But wait-don’t throw in the towel just yet! As long as Bitcoin stays above $95,000, the big picture is still looking positive.
If Bitcoin can snap back and reclaim $110,000 quickly, we might just see the rally pick up speed again, heading for $125,000! The saga continues… 📈
Read More
- Gold Rate Forecast
- Dune 3 Gets the Huge Update Fans Have Been Waiting For
- Hazbin Hotel Secretly Suggests Vox Helped Create One of the Most Infamous Cults in History
- 22 actors who were almost James Bond – and why they missed out on playing 007
- Every Creepy Clown in American Horror Story Ranked
- Jack Osbourne Shares Heartbreaking Tribute to Late Dad Ozzy Osbourne
- Jason Statham’s Hit Creature Feature Is Heading to Streaming for Free
- Kingdom Come: Deliverance 2 – Legacy of the Forge DLC Review – Cozy Crafting
- As Dougal and friends turn 60, Radio Times explores the magic behind The Magic Roundabout
- Arknights: Endfield – Everything You Need to Know Before You Jump In
2025-10-16 19:25