Attention, all crypto enthusiasts and skeptics alike! Bitcoin has once again hit a new all-time high, briefly moving above $121,000 before stabilizing near $120,500. The price is up 2.54% today, continuing a strong trend that started earlier this month. But is this rally sustainable, or nearing a slowdown?
Well, grab your popcorn and buckle up, because it’s about to get interesting!
Holders Aren’t Taking Profits Yet
The adjusted Spent Output Profit Ratio (aSOPR) currently sits at 1.03, well below the early July 2025 levels, where aggressive profit-taking pushed the ratio much higher. This time, despite Bitcoin making new highs, traders appear to be holding instead of selling.

This means most coins being moved on-chain are not being sold for massive gains, which suggests the rally is not overheated. In other words, we’re not seeing a mad dash for the exits just yet.
SOPR shows whether BTC moved on-chain is being sold at a profit (>1) or at a loss (<1). Adjusted SOPR fine-tunes the metric and filters out short-term internal transactions to show whether BTC moved on-chain is being sold at a profit or loss.
Volume is Supporting the Rally
On-Balance Volume (OBV) is moving up in tandem with Bitcoin’s price, a key sign that buying volume is keeping pace with the rally. There’s no visible divergence, no breakdown in momentum.
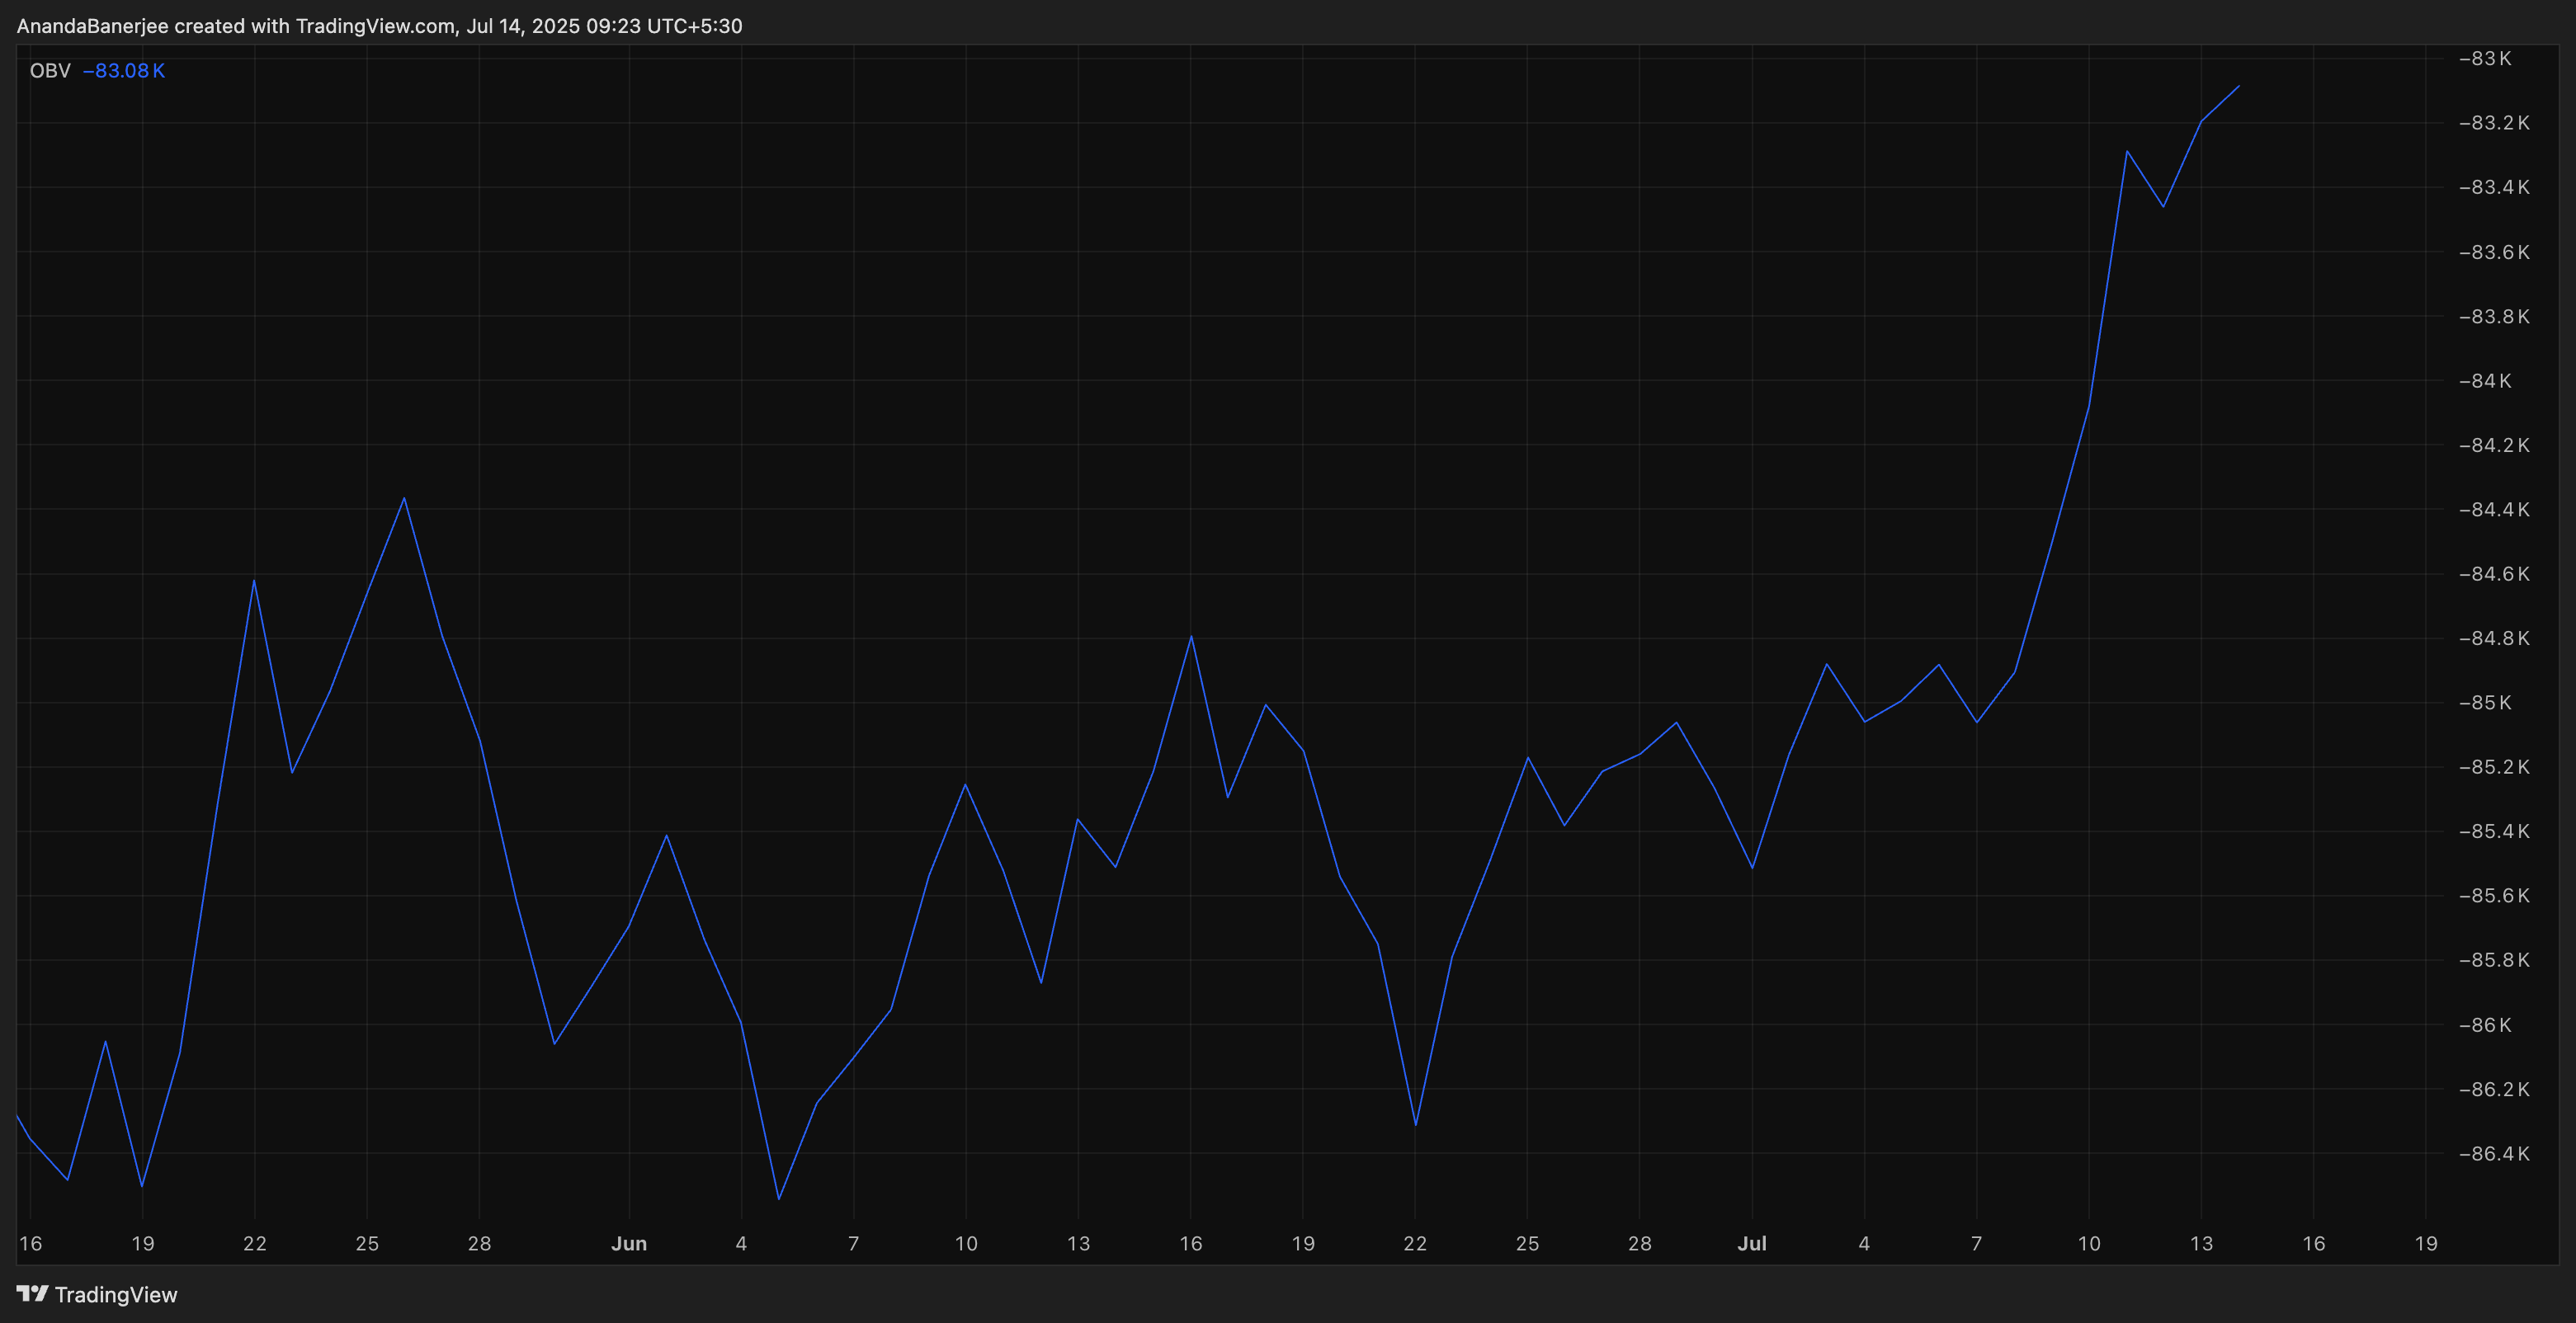
BTC is going up, and the volume is going with it, not against it. It’s like having a parade where everyone’s marching in step, instead of a chaotic mob.
OBV measures cumulative buy/sell pressure based on daily volume direction. It is a bullish sign when it follows a positive price trend.
BTC Price Structure and Next Levels
BTC is currently holding just below $121,519, a key resistance level from the Trend-Based Fibonacci Extension. If Bitcoin closes above this level, the next extension target is $127,798, followed by $135,425. These are long-range projections based on previous trend behavior.
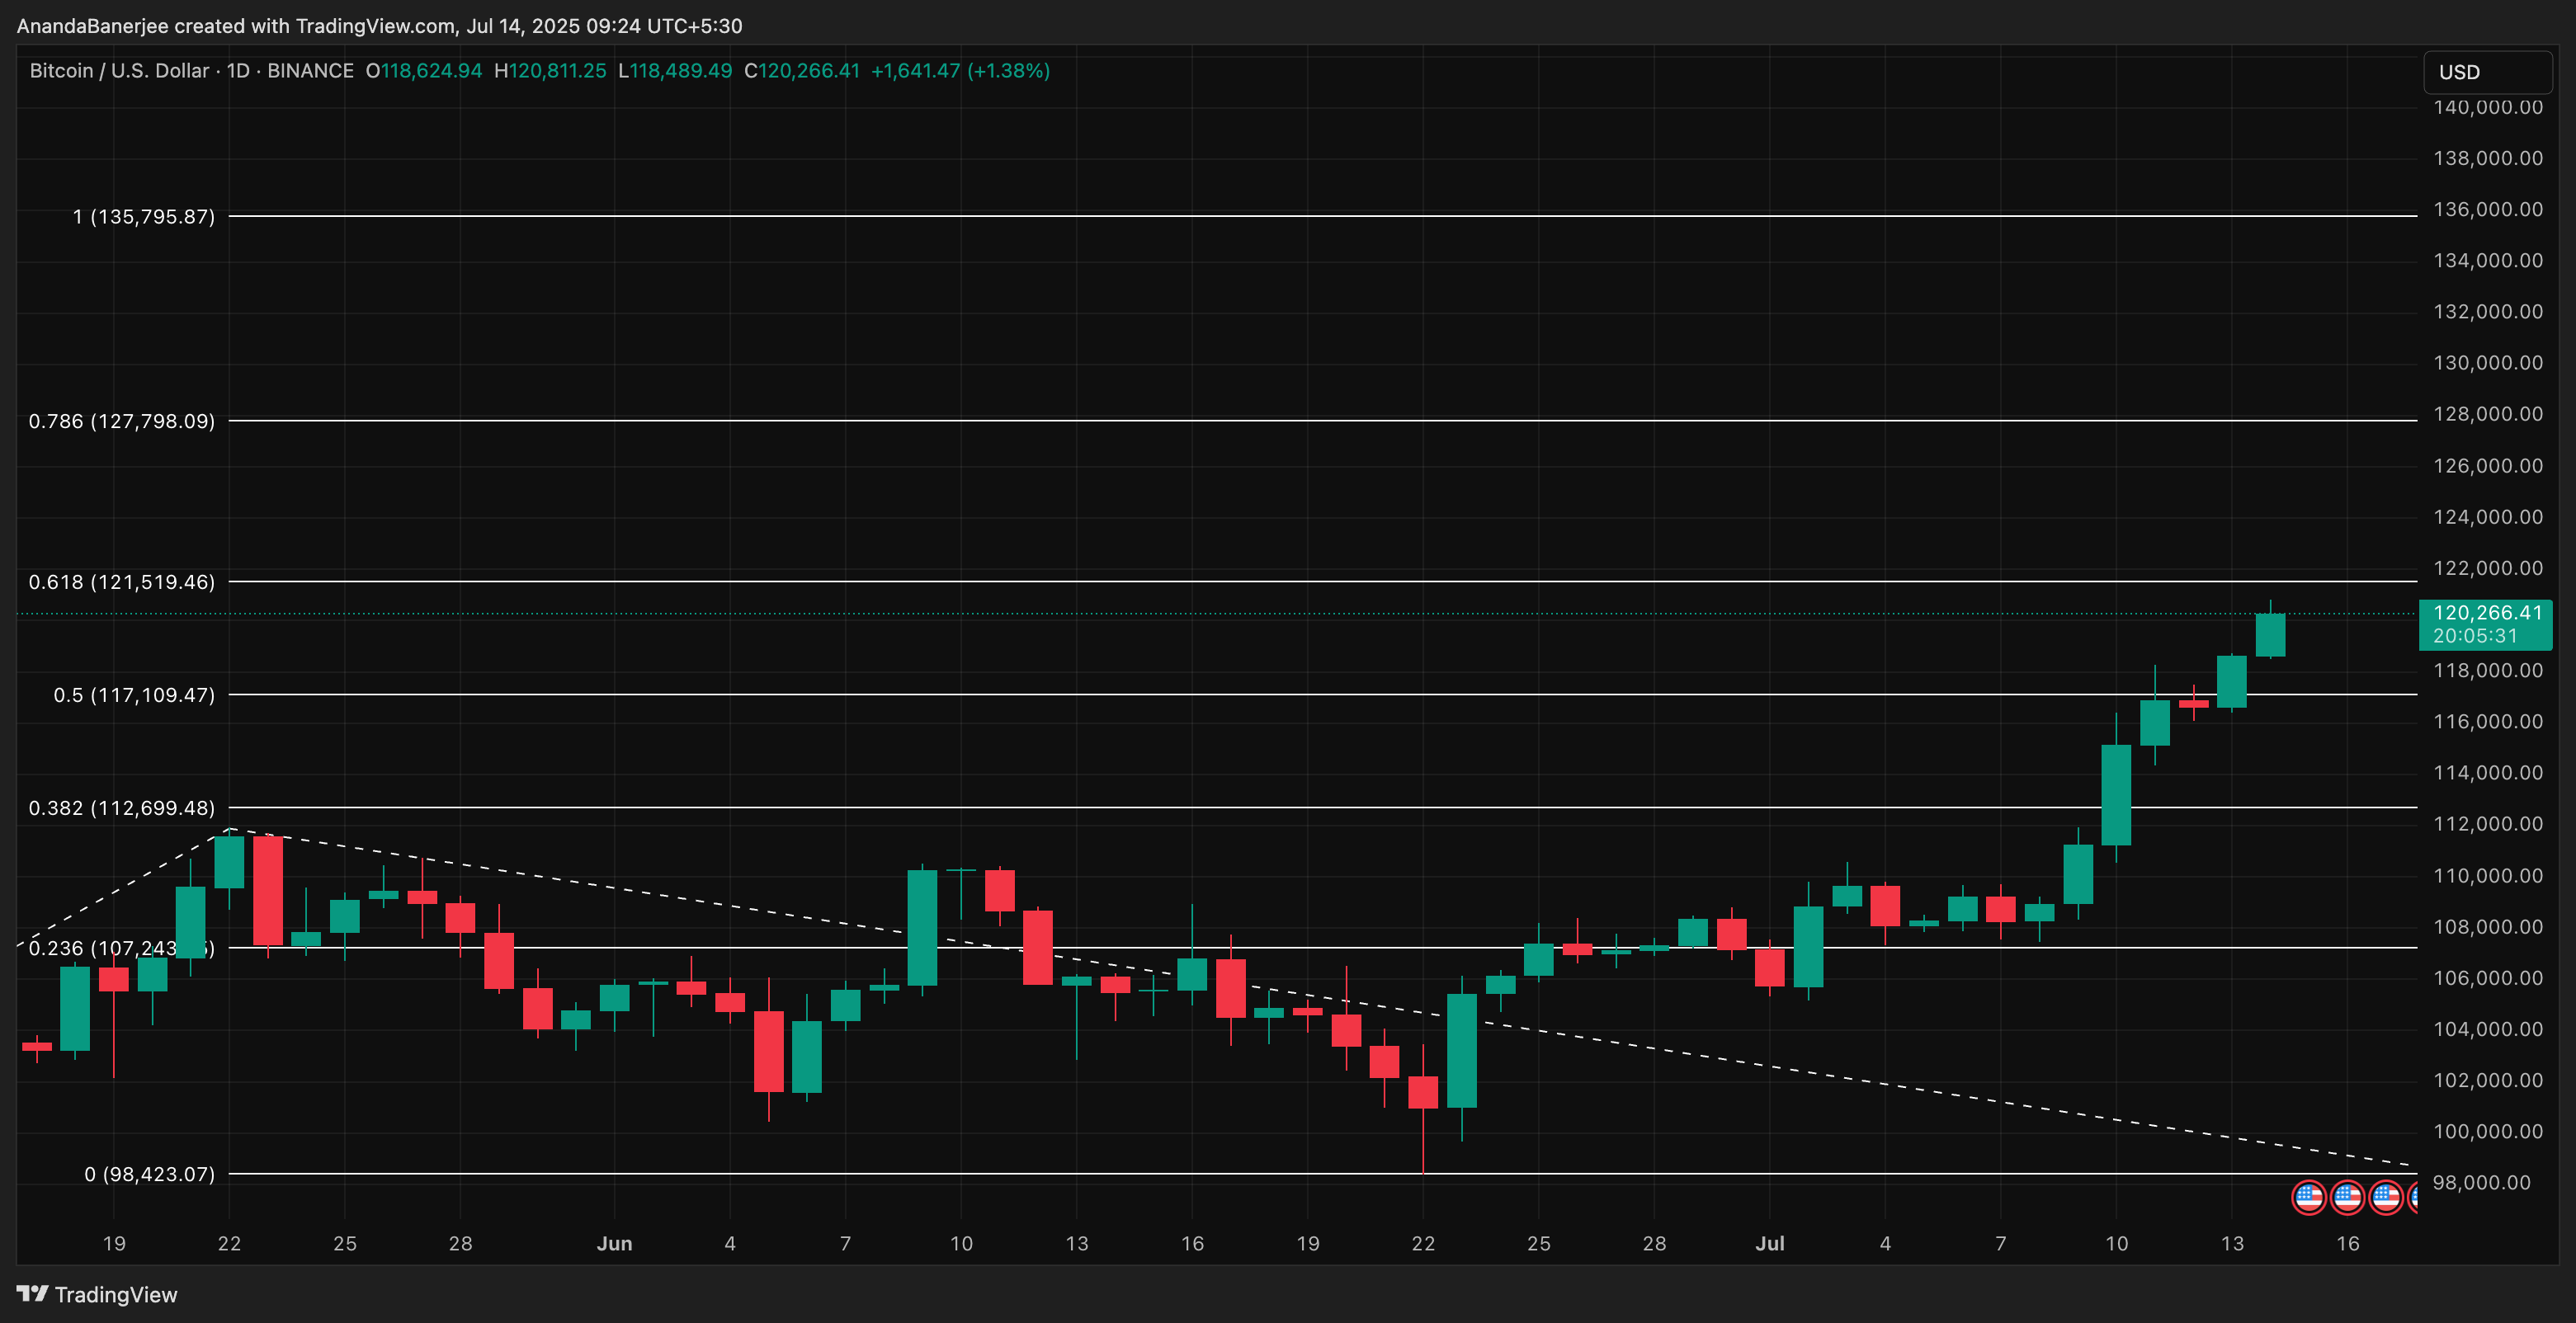
Trend-Based Fibonacci Extension is a tool that uses three key price points: a low, a high, and a retracement, to project future resistance levels in a trending market. It’s like having a crystal ball that tells you where the price might go next, but with a fancy name and a bit more math involved.
If BTC consolidates, near-term support sits at; $117,109, which is a prior breakout area. The bullish trend would weaken if BTC falls below $112,699, a key support level near the first all-time high, especially if exchange inflows spike or SOPR starts to rise sharply. That would suggest holders are starting to take profits aggressively, which could lead to a pullback or trend reversal. But hey, who doesn’t love a good plot twist?
Read More
- What Song Is In The New Supergirl Trailer (& What It Means For The DC Movie)
- Eurogamer Gives ARC Raiders 2/5 Over AI Voices, Dropping Metacritic Score from 94 to 84
- One of Hulu’s Best New Shows Lands on Disney+ Ahead of Season 2
- Gold Rate Forecast
- The Champions 7 Deadliest Villains, Ranked
- 10 Best Connie Episodes of King of the Hill
- 5 Best Superman-Centric Crossover Events
- How Derek Hough is Keeping His & Hayley Erbert’s Baby Close
- Did The Simpsons Retire a Major Character After Nearly 30 Years?
- MCU’s Lost Squirrel Girl Star Addresses Marvel Return, 9 Years After Cancellation
2025-07-14 07:56