Bitcoin, everyone’s favorite digital rollercoaster, has been bobbing between $107,029 to $107,290 over the past hour on June 12, 2025. With a market cap of $2.13 trillion and a 24-hour trading volume of $34.26 billion, it’s safe to say the crypto world is still alive and kicking—well, mostly kicking.
Bitcoin
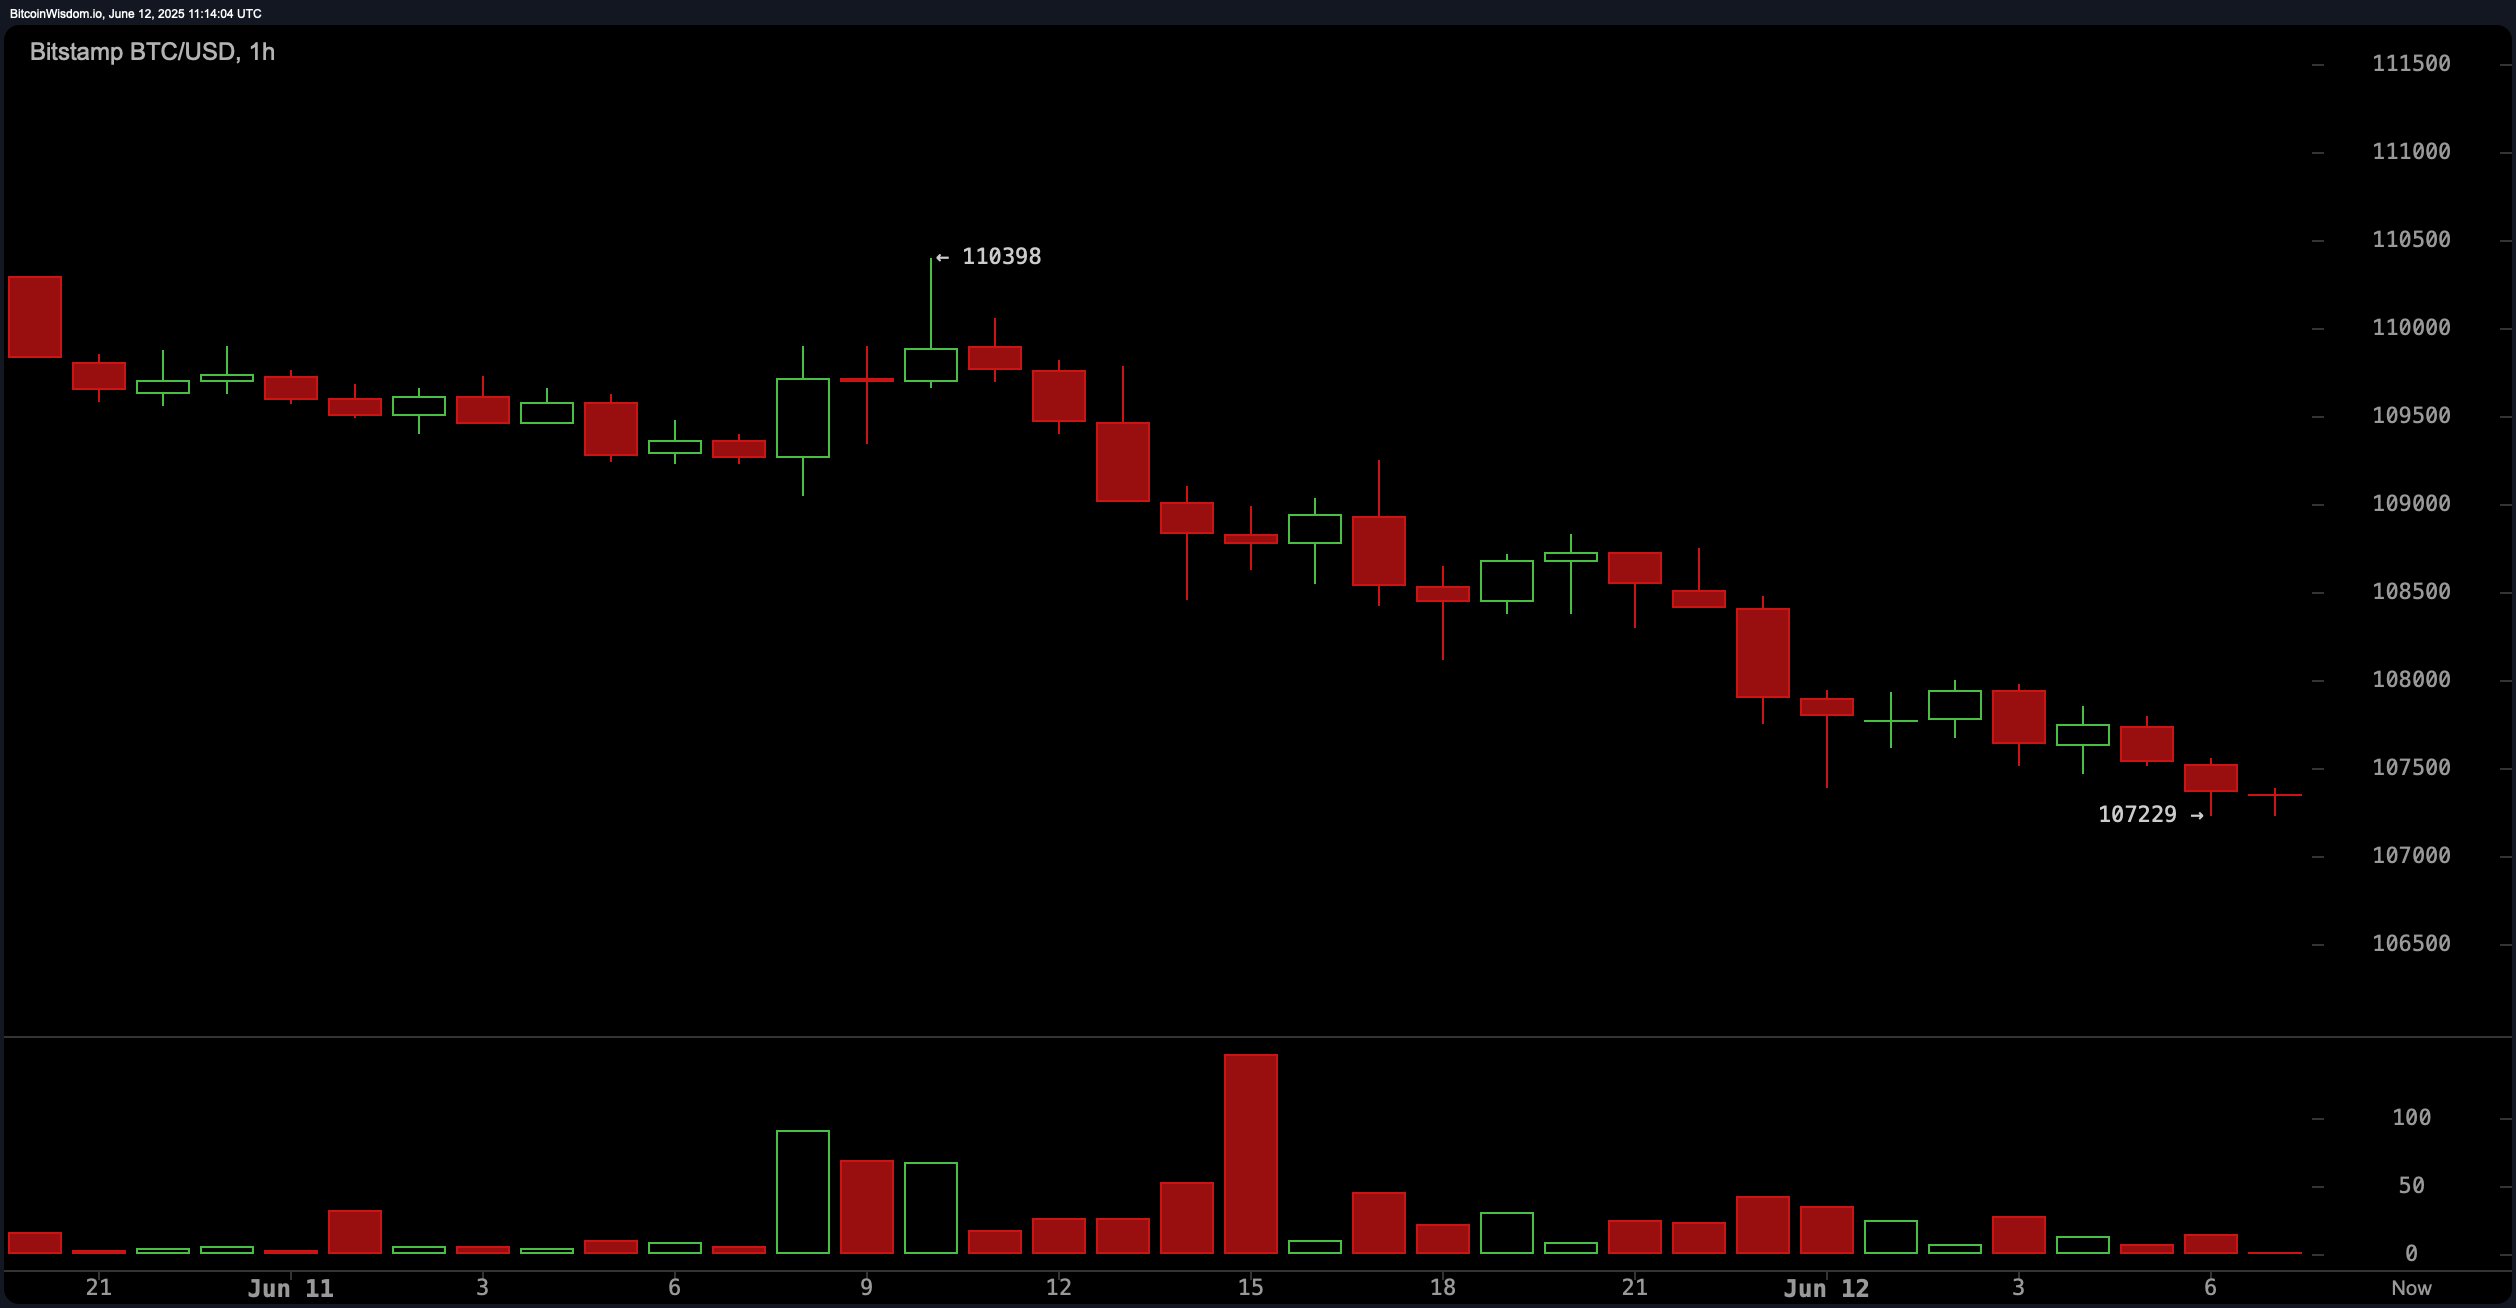
The 1-hour chart? Oh, it’s just another day in Bitcoin’s soap opera. A steady downward trend since June 11, with red candles lining up like little soldiers in a bearish parade. Support is valiantly clinging on at $107,229, but resistance is throwing a grand party at $108,000, and they’re not letting anyone in. The RSI is hanging out at 55, just chilling, which is basically market speak for “meh.” Price action? It’s all about selling right now, and volume spikes are basically shouting “We’re going down, folks!” The momentum oscillator is giving us a lovely 1,392, while the MACD is flashing a “caution, downward trend” sign at 1,343.
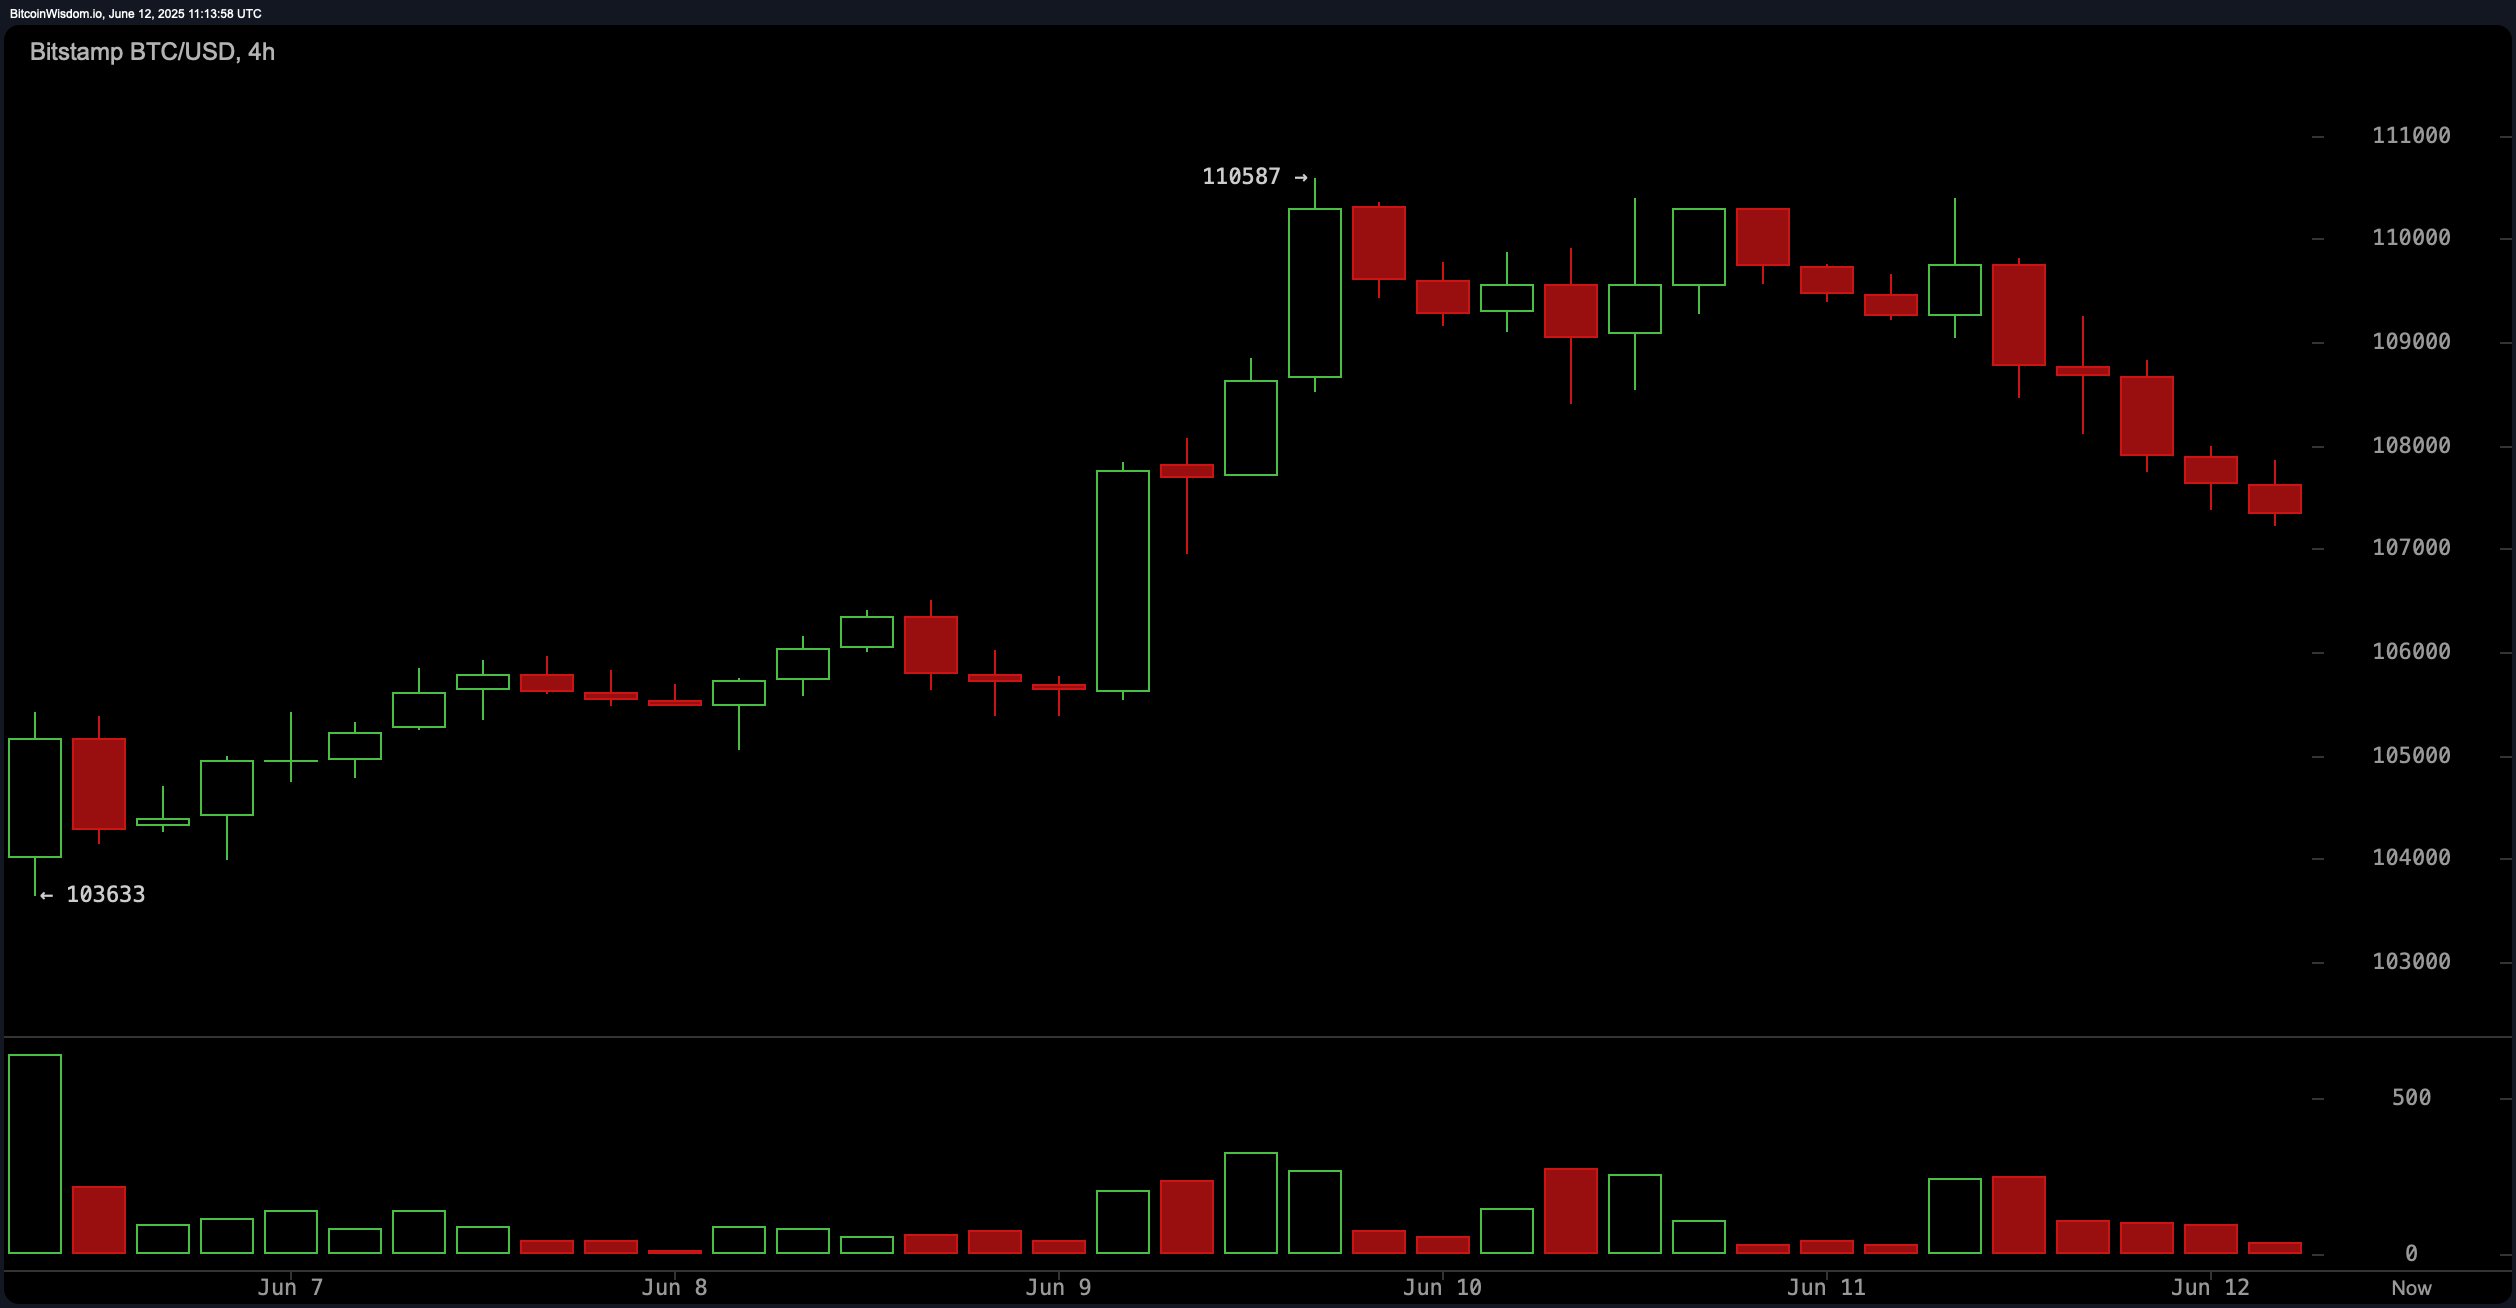
Now, let’s talk about the 4-hour chart. Bitcoin made a quick dash to $110,587, which is like the crypto equivalent of a rocket launch, but of course, it came crashing down soon after, forming a classic “blow-off top” (which, let’s face it, sounds more like a carnival game than a chart pattern). Lower highs, lower lows—yep, it’s correction time. Resistance is partying hard between $108,000 and $109,000, so if you’re looking to trade short-term, this is your battleground. The Stochastic oscillator is at 82, which is the nice way of saying, “Hey, everything’s a bit too expensive now.” And don’t even get me started on the bearish bias—it’s strong, like your coffee on a Monday morning.
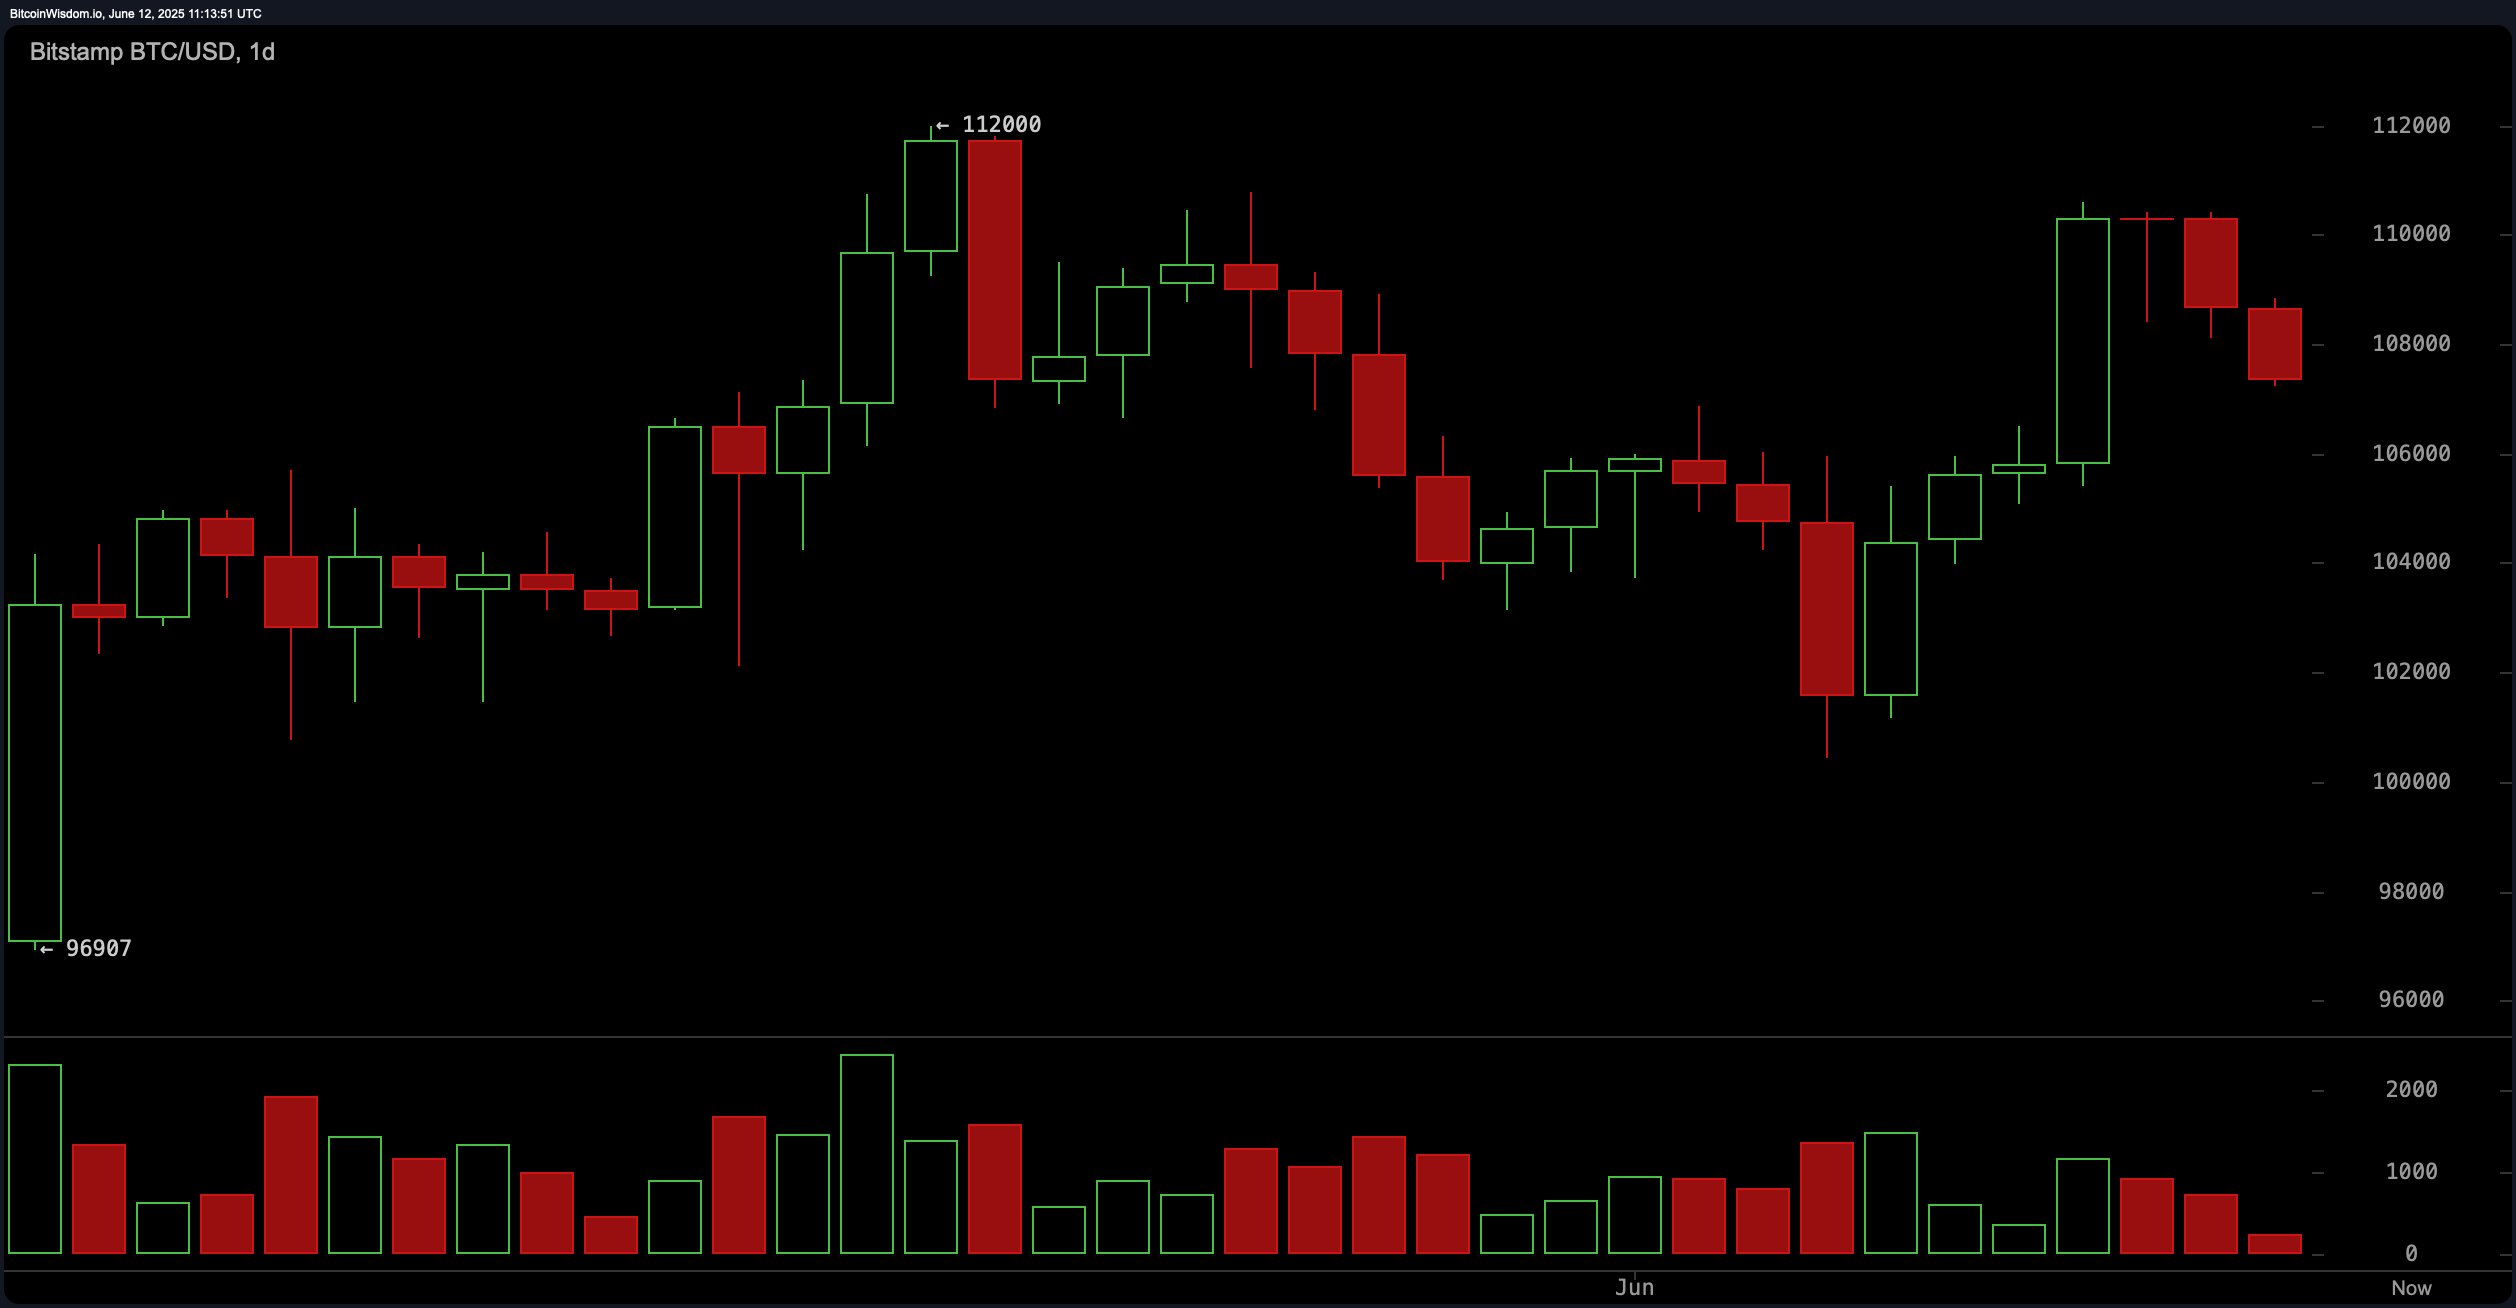
On the daily chart, the drama continues. After being turned away from the $112,000 resistance (I know, ouch), Bitcoin’s looking like it’s caught in a tug-of-war. Bears are clearly throwing their weight around, but bulls are giving it a good old college try. Support is holding at $102,000, but let’s just say the bulls are like a group of people trying to push a boulder up a hill. Moving averages are all in the “good vibes only” camp, pointing to bullish signals, but with neutral RSI and CCI readings, we’re still in that awkward “let’s wait and see” phase.
As for the oscillators? They’re like a group of people at a party who just can’t agree on whether the music is too loud or too quiet. The RSI at 55, and CCI at 41? Basically, nobody’s getting anything done. Meanwhile, the MACD and momentum indicators are waving red flags, saying “sell now!” and the Stochastic is in “too much of a good thing” territory. The ADX is at 17, confirming that the trend is about as weak as a cup of decaf coffee. The Awesome oscillator? Still neutral, because why not?
Now, moving averages are here to save the day—or at least they think they are. From the 10-period to the 200-period, they’re all giving us that sweet “buy” signal. Short-term support is hanging out at $107,224 and $106,412, while the long-term moving averages are calmly whispering, “Hey, everything’s still fine, just take a nap and wait for us to move back up.” The divergence between oscillators and moving averages? Classic market drama. Long-term strength with short-term correction, everyone!
Bull Verdict:
If Bitcoin manages to rally back to the $109,000–$110,000 zone and brings along some volume for the ride, it’s going to send all the bulls into full-on stampede mode. A breakout could send us charging back to $112,000 and who knows, maybe even new yearly highs. It’ll be like a party where everyone actually agrees on the playlist.
Bear Verdict:
On the other hand, if Bitcoin keeps getting rejected at $108,000 and breaks below the $107,000 support, we’re in for a real downer. The oscillators are flashing “sell” signals, and both the 1-hour and 4-hour charts are doing their best impression of a bear costume. If this happens, Bitcoin might visit the $102,000 support again, and if that level doesn’t hold, well, prepare for more drama.
Read More
2025-06-12 15:27