ETH’s $2.6K Nightmare: Will This Chart Be Its Last? 🐍💸

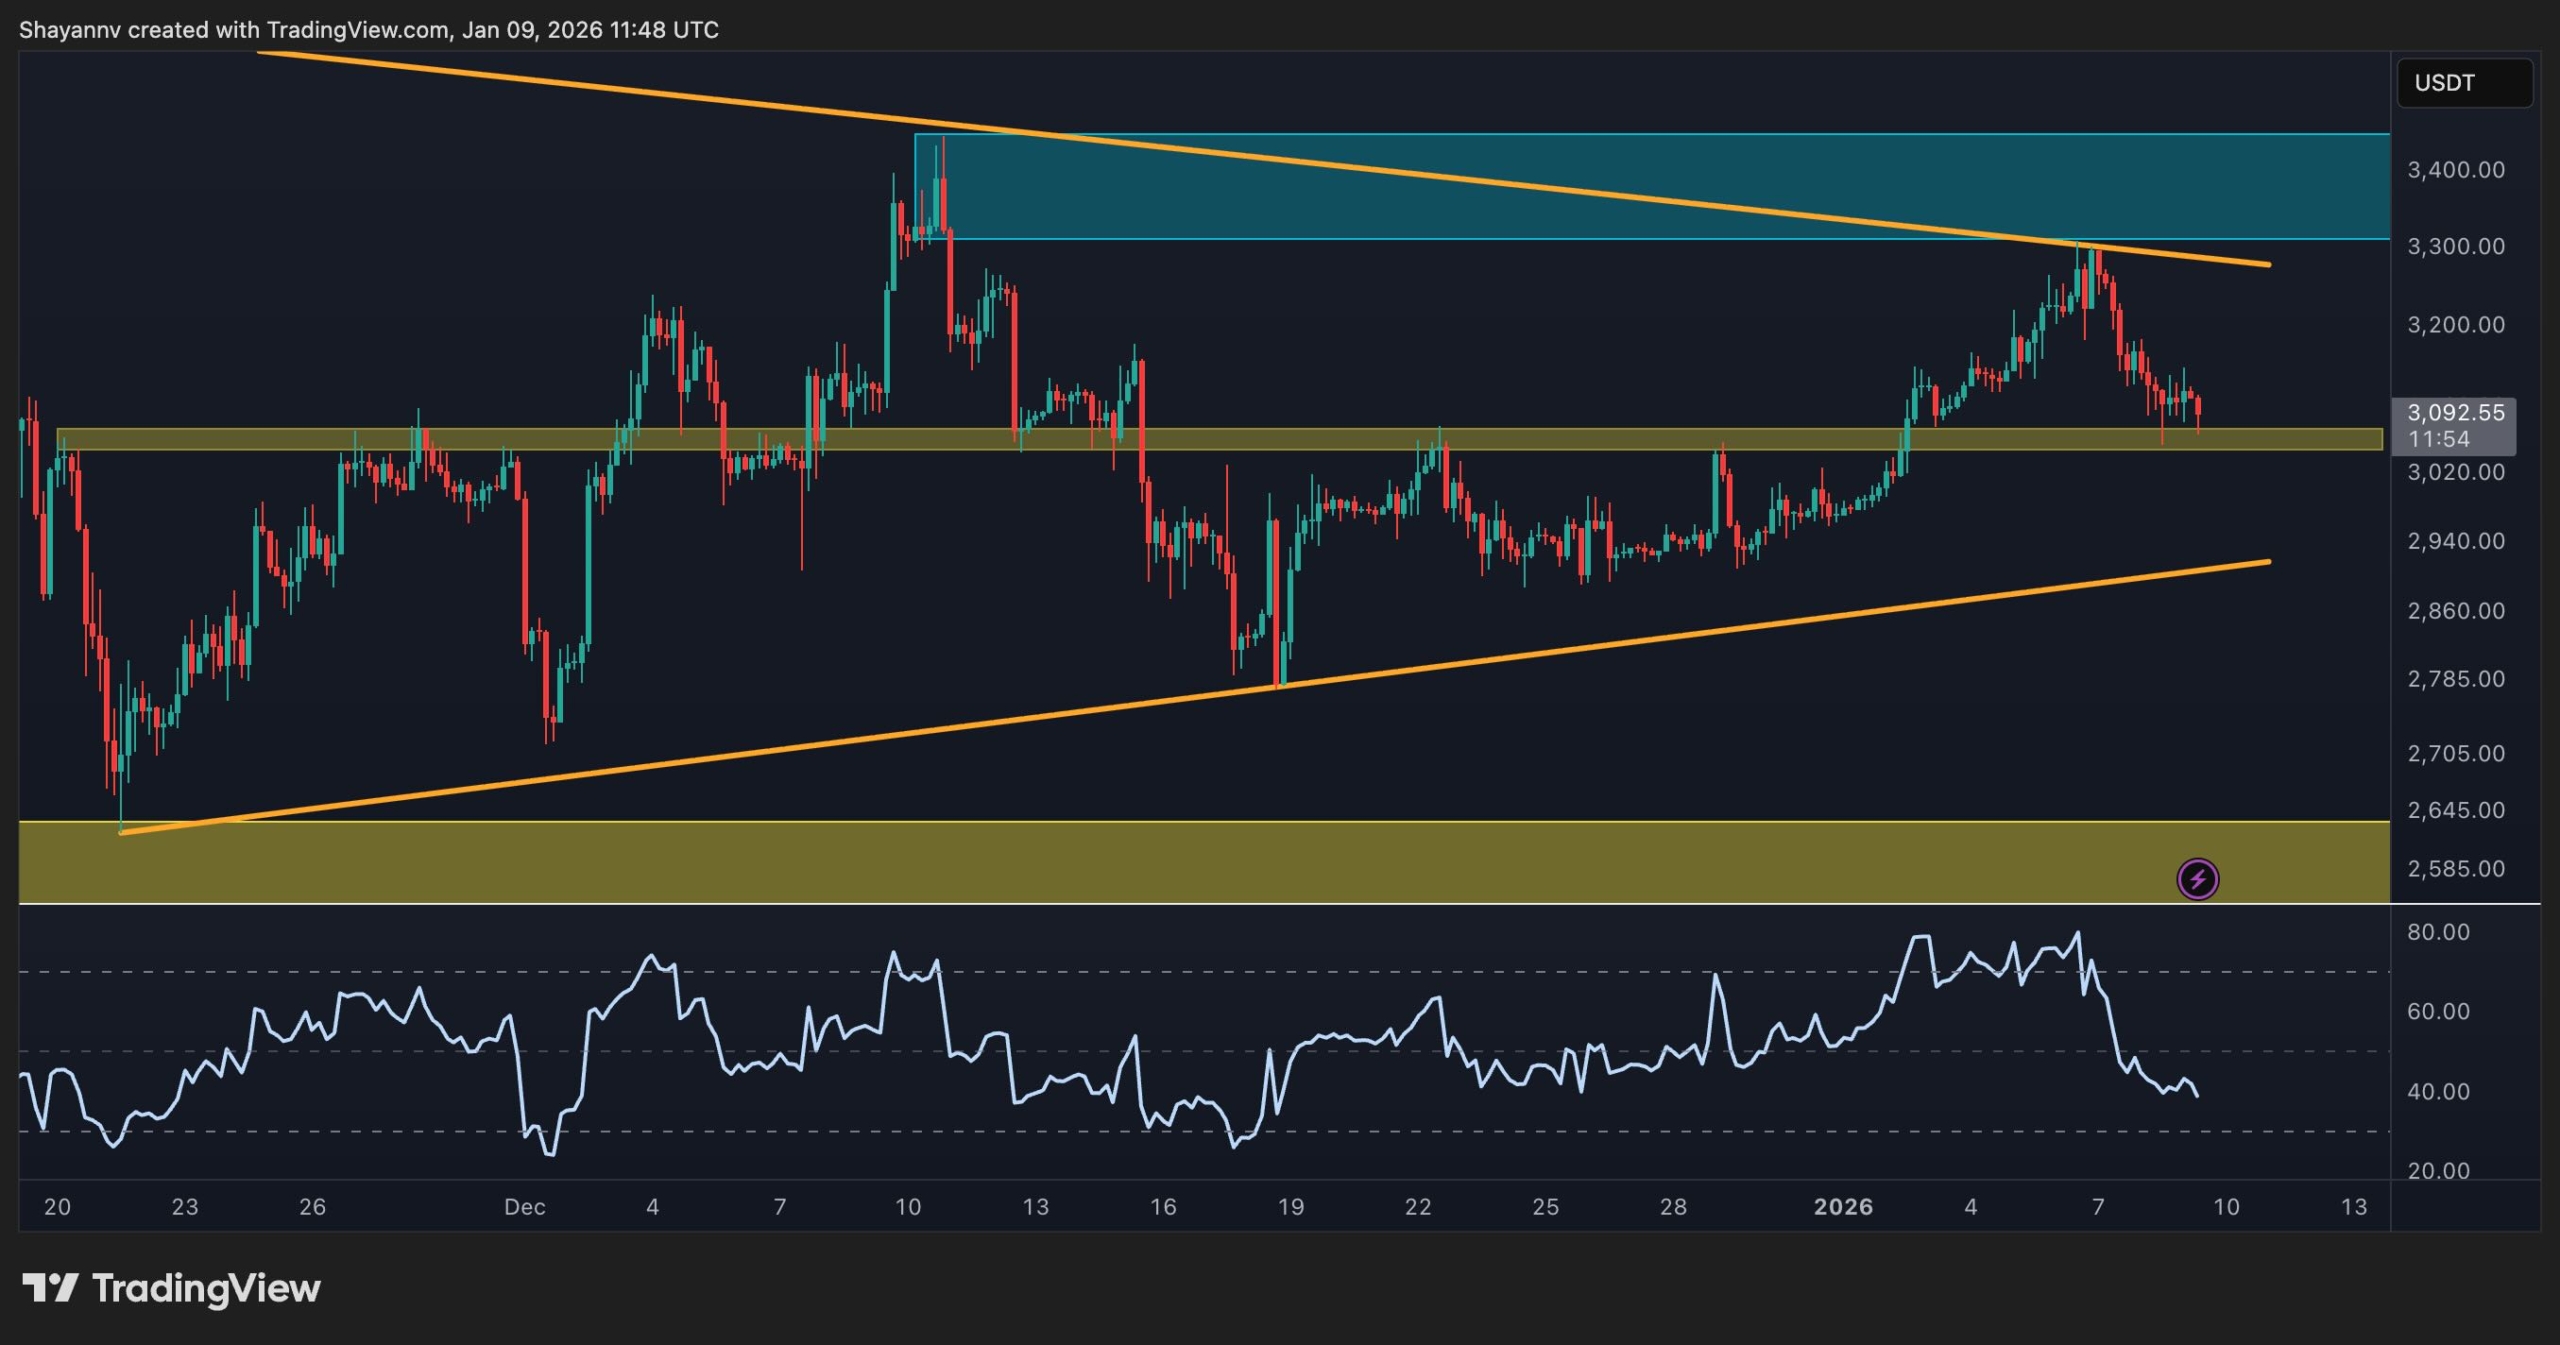
On the daily chart, ETH has clawed its way above the broad descending channel, a desperate climb up a hill of dust and doubt. After a fierce bounce from the green demand zone near $2,600 in mid-December, the price dared to reclaim the $3,000 mark, a beacon for the brave. But the rally faltered, just short of the $3,500 resistance band, a cruel mistress that has long held sway over this land. The RSI, once a roaring fire, now flickers low, a warning that the flames may soon die.


