Ethereum’s price has increased by 2.7% over the last week, but it’s down slightly, 1.8%, in the last day, currently trading around $1,960. This small change happens as money continues to flow into Ethereum ETFs for the second week in a row – a trend that has often been followed by price increases in the past.
The daily chart is showing a promising signal – a bullish divergence in the RSI – which suggests Ethereum’s price might be starting to recover.
ETF Flows Flash A Familiar Signal, And RSI Divergence Backs It Up
As an analyst, I’ve been tracking the Ethereum spot ETFs closely, and I’m seeing a positive trend emerge. After a long period of net outflows, we’ve now had two consecutive weeks of inflows. The outflows peaked around February 20th, with a net outflow of $123 million when Ethereum was trading at $1,970. But thankfully, the trend has reversed in the weeks since.
This is important because the last two times money started flowing into Ethereum ETFs after a period of outflows, certain things happened. Understanding those past patterns is key.
Looking at the data, we saw outflows of $500 million for the week of November 21st, with Ethereum trading around $2,730. However, the next week showed a significant turnaround, with inflows of $313 million. This positive shift coincided with a price surge for Ethereum, breaking above $3,050 – that’s an 11.6% increase. It’s a clear example of how market sentiment can quickly change.
The week of January 9th experienced $68 million in outflows, while Ethereum was trading around $3,070. The following week saw a positive swing of $479 million in inflows, and the price of Ethereum increased to $3,290 – a gain of 7.1%.
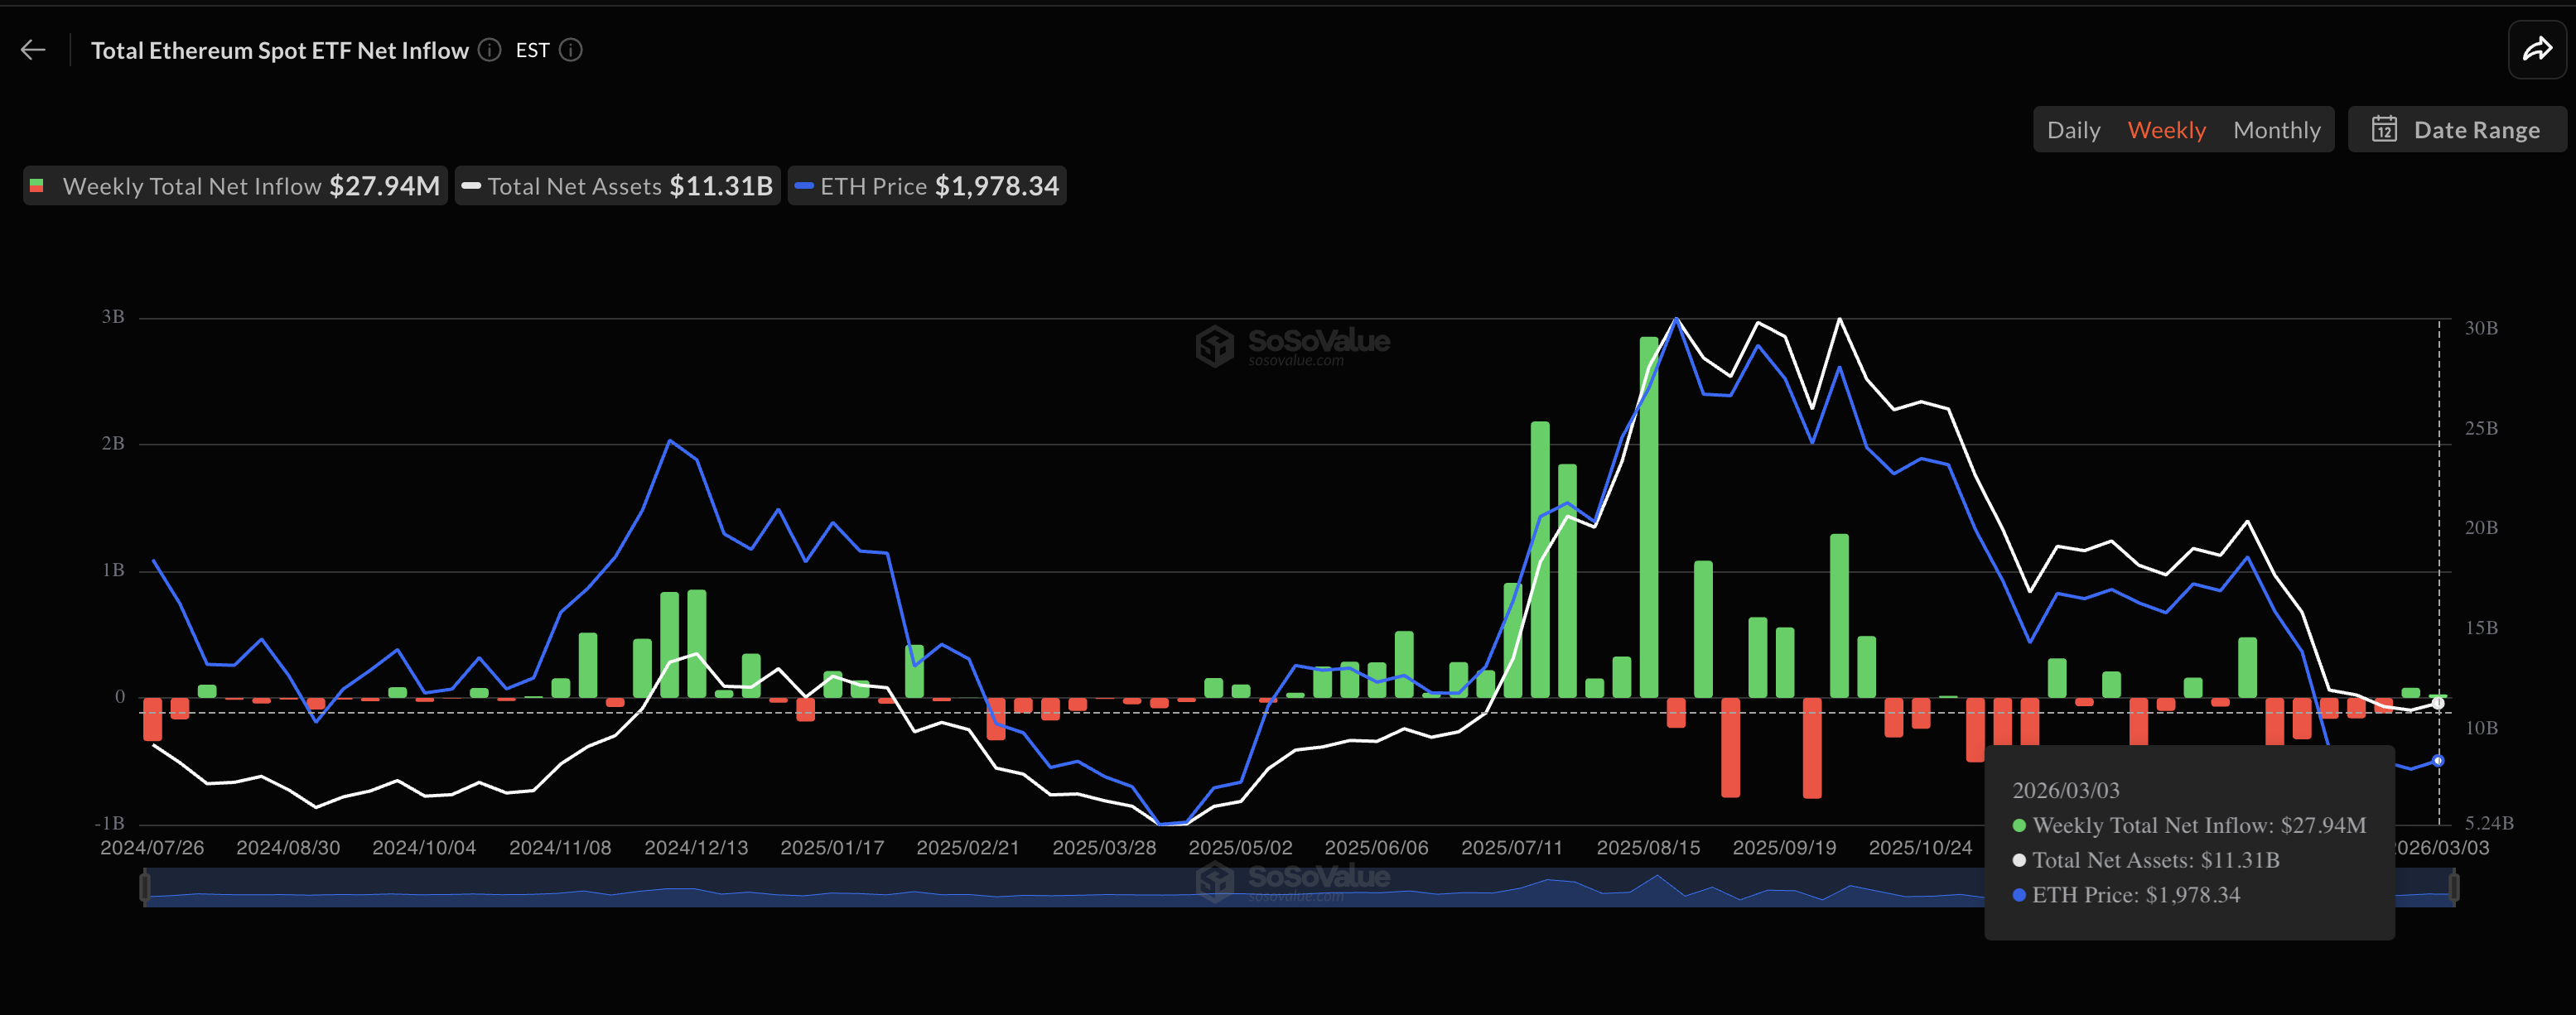
On average, the price has moved about 10% after each of these shifts. Since we’ve now seen two weeks of gains following the drop on February 20th, a similar upward trend might happen again.
The daily chart also shows a positive sign: a bullish divergence in the Relative Strength Index (RSI). From January 25th to March 3rd, the price of Ethereum has been decreasing, but the RSI, which measures momentum, has actually been increasing. This often suggests a price rebound, though given the current market, it might only be a temporary bounce rather than a full trend reversal.
The candlestick on March 3rd shows a potential low point forming with its lower wick, suggesting a short-term upward bounce is still possible. But, if the next candle closes below $1,920, that low point will be broken, and the likelihood of a rebound will decrease.
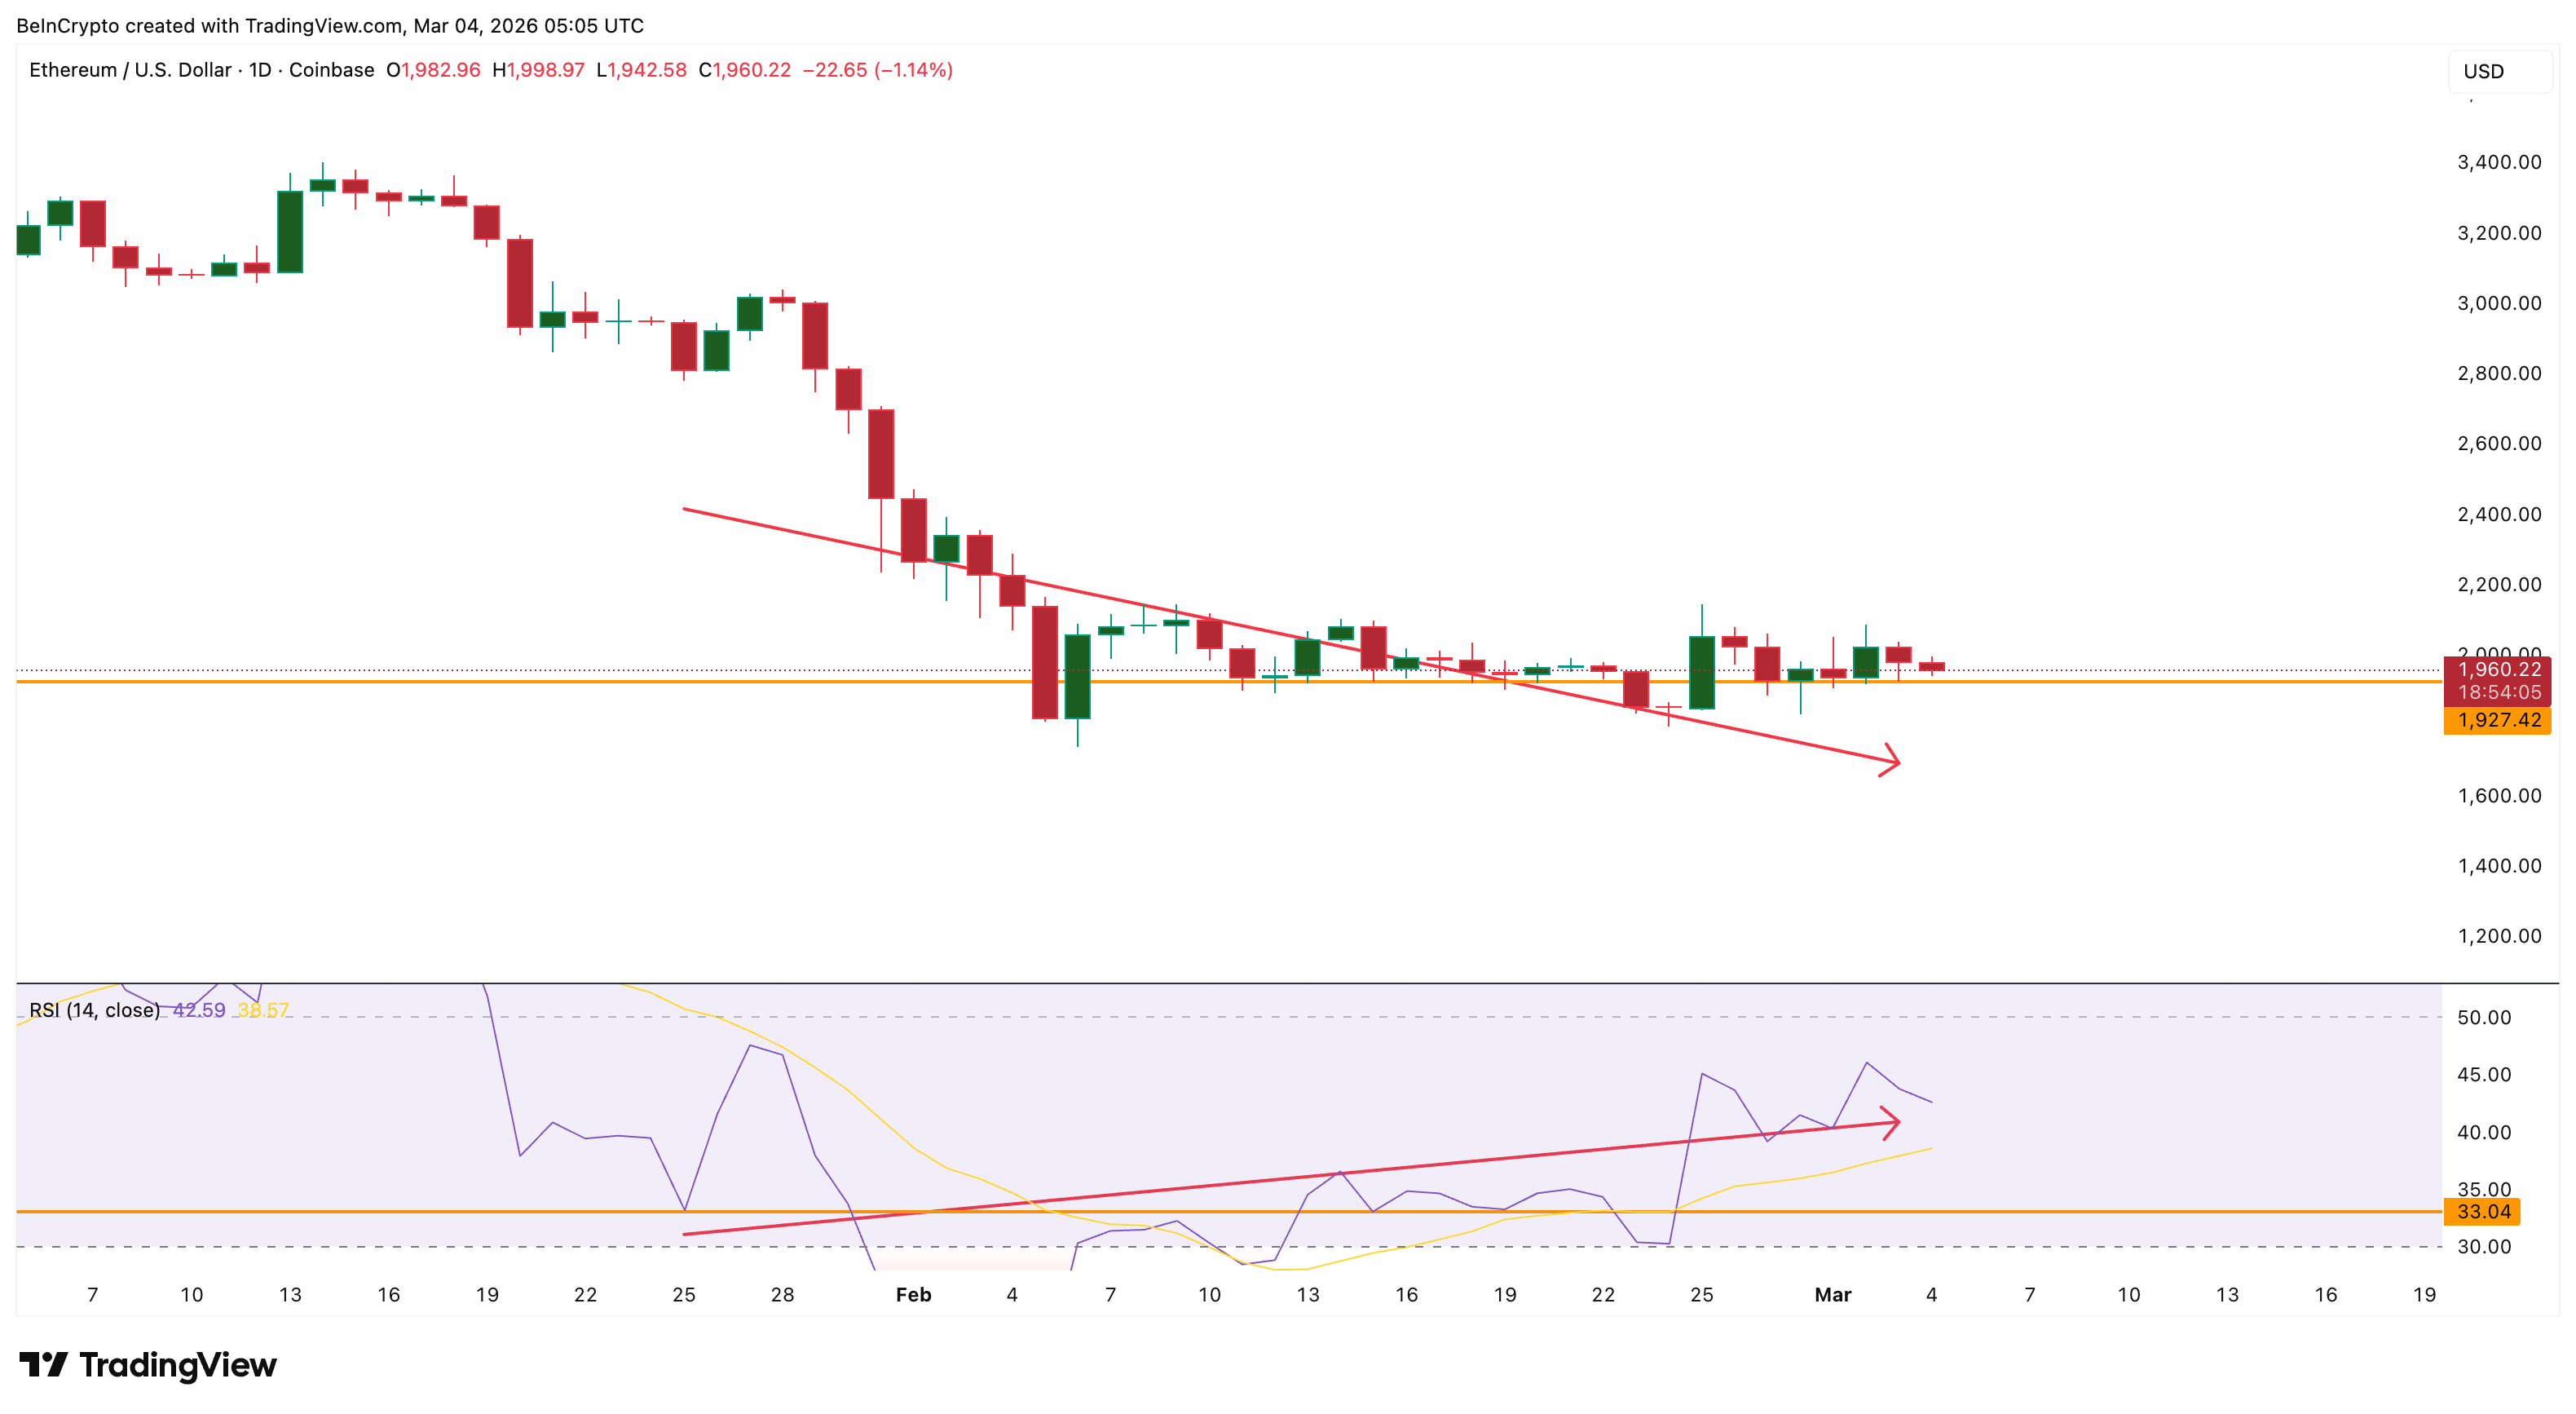
The overall downward trend is still in place as long as the price stays below the lowest point it reached on January 25th.
Supply Clusters Map the Key Resistance (s)
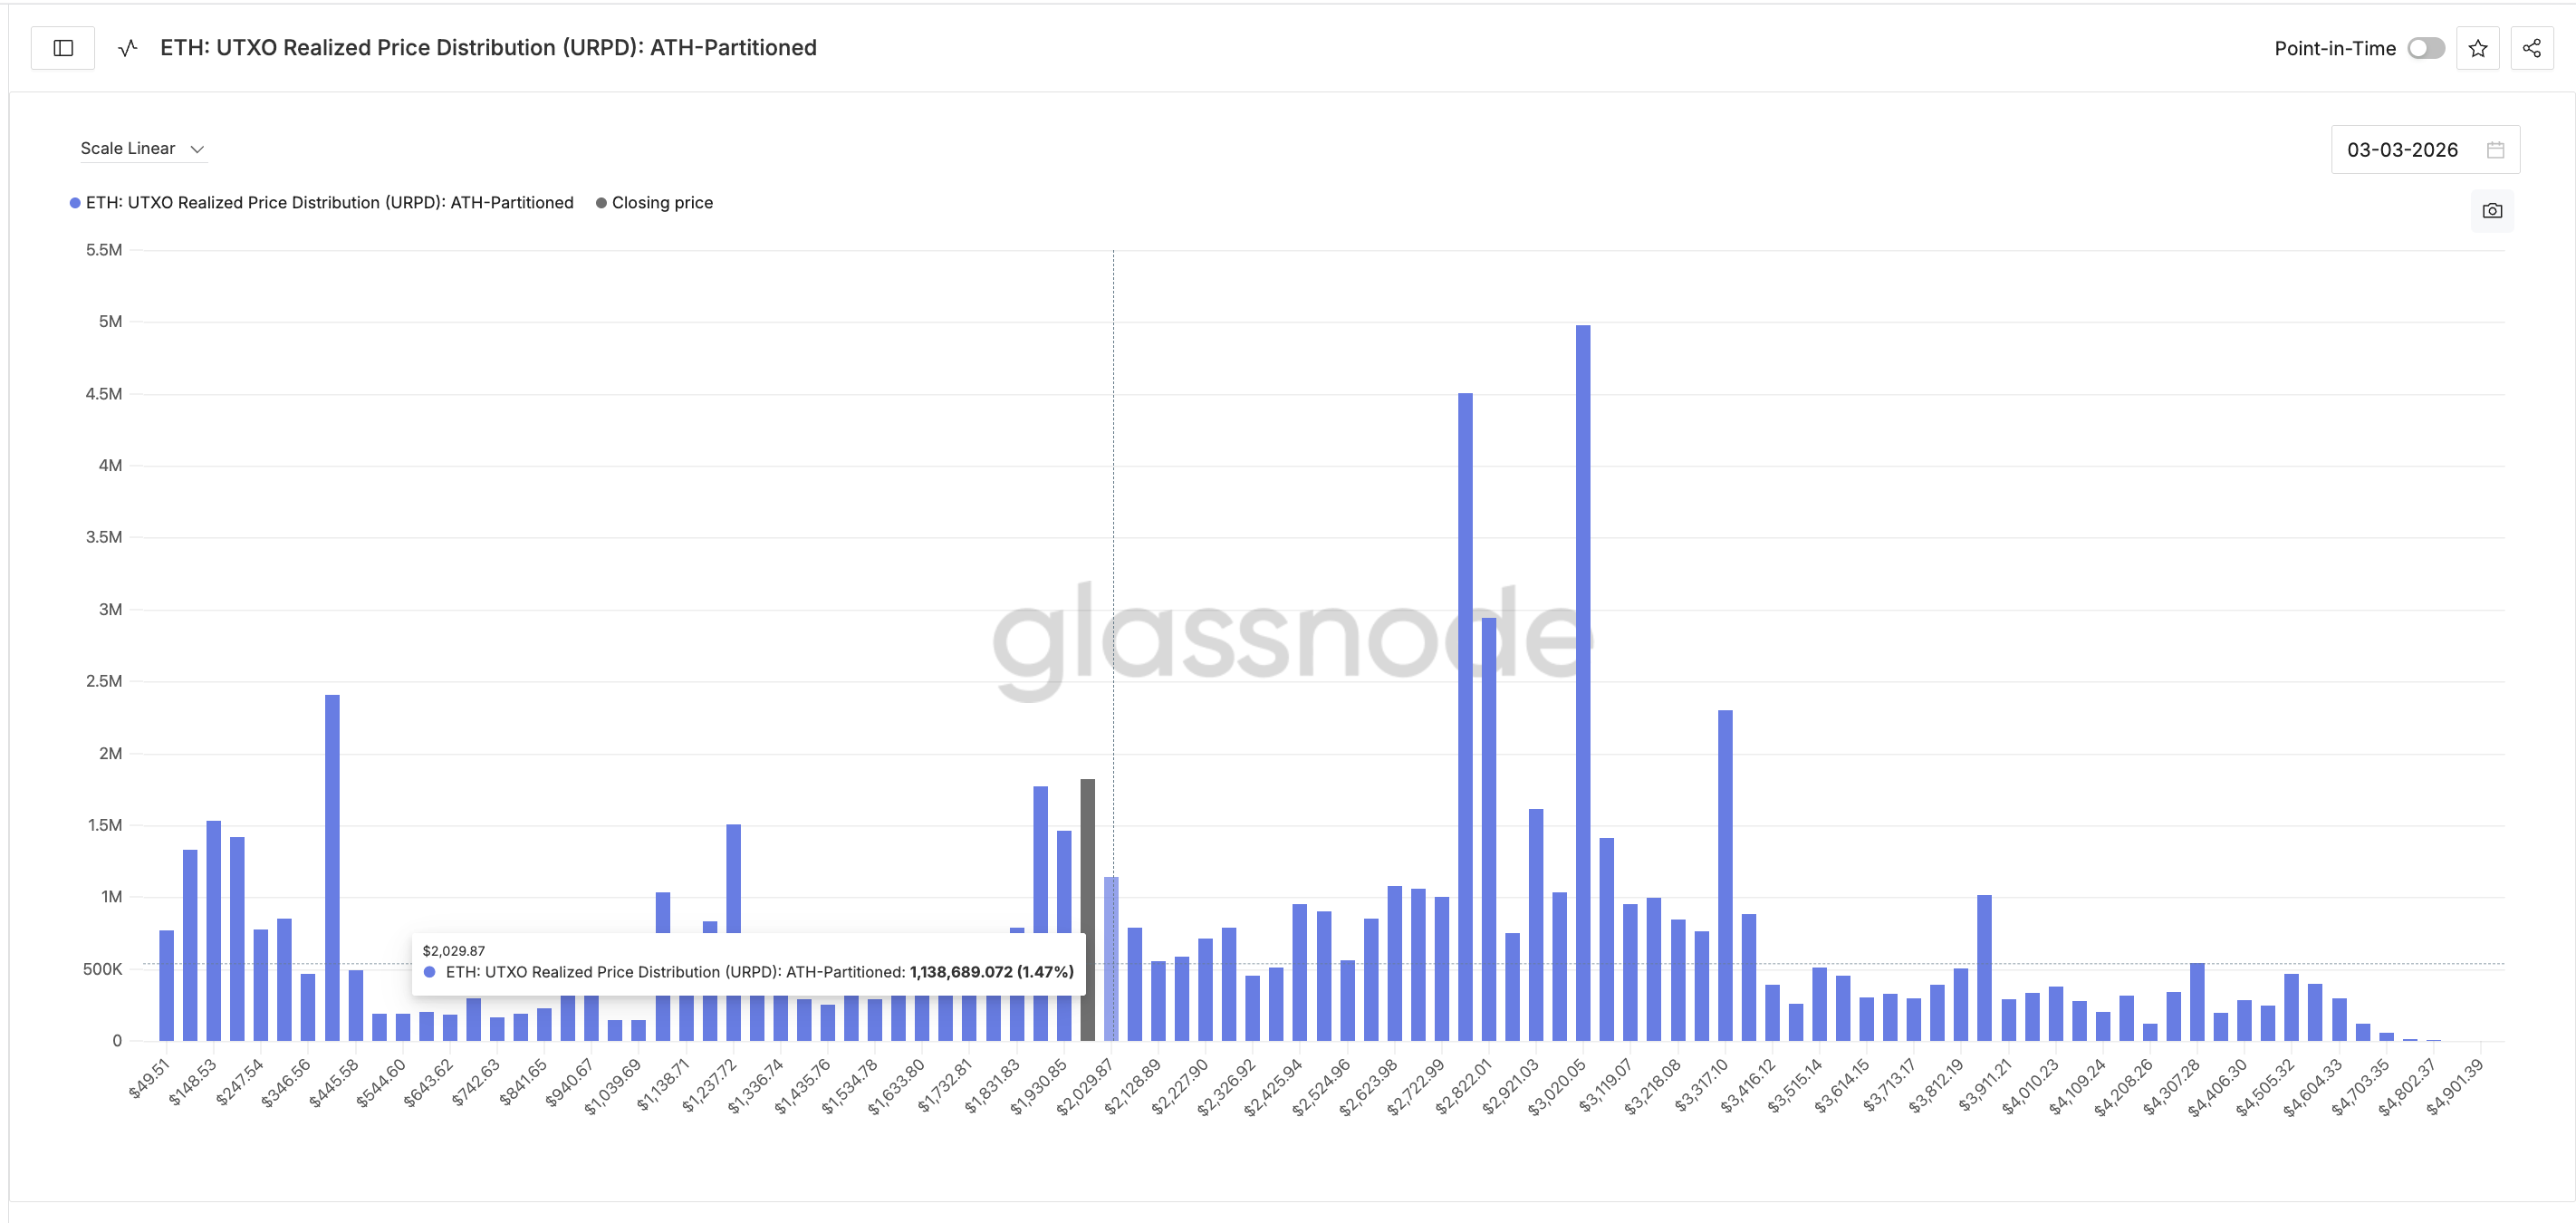
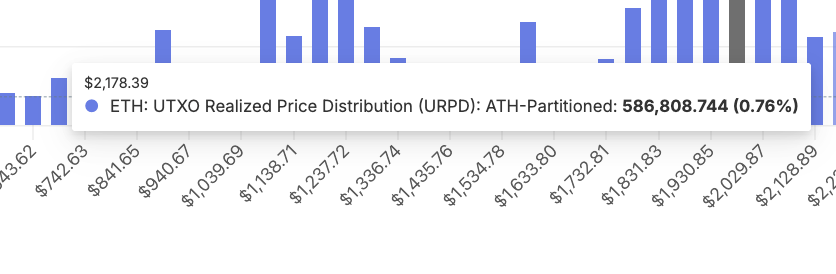
To predict potential price drops during a market rebound, Glassnode uses the UTXO Realized Price Distribution (URPD) to pinpoint the price levels where most Ethereum was last bought and sold. Although originally designed for transaction-based systems, Glassnode has adapted this metric to work with account-based networks like Ethereum.
[ETH URPD: Glassnode]
A notable group of ETH holders bought in around $2,020, representing about 1.47% of all ETH. Because so many people acquired ETH at this price, they might try to sell when the price recovers to break even, potentially creating significant selling pressure and hindering further price increases.
Beyond that, a significant concentration of Ethereum exists between $2,120 and $2,170. Roughly 0.72% of all ETH is held at the $2,120 price point, and 0.76% at $2,170, totaling 1.5% of the entire Ethereum supply.
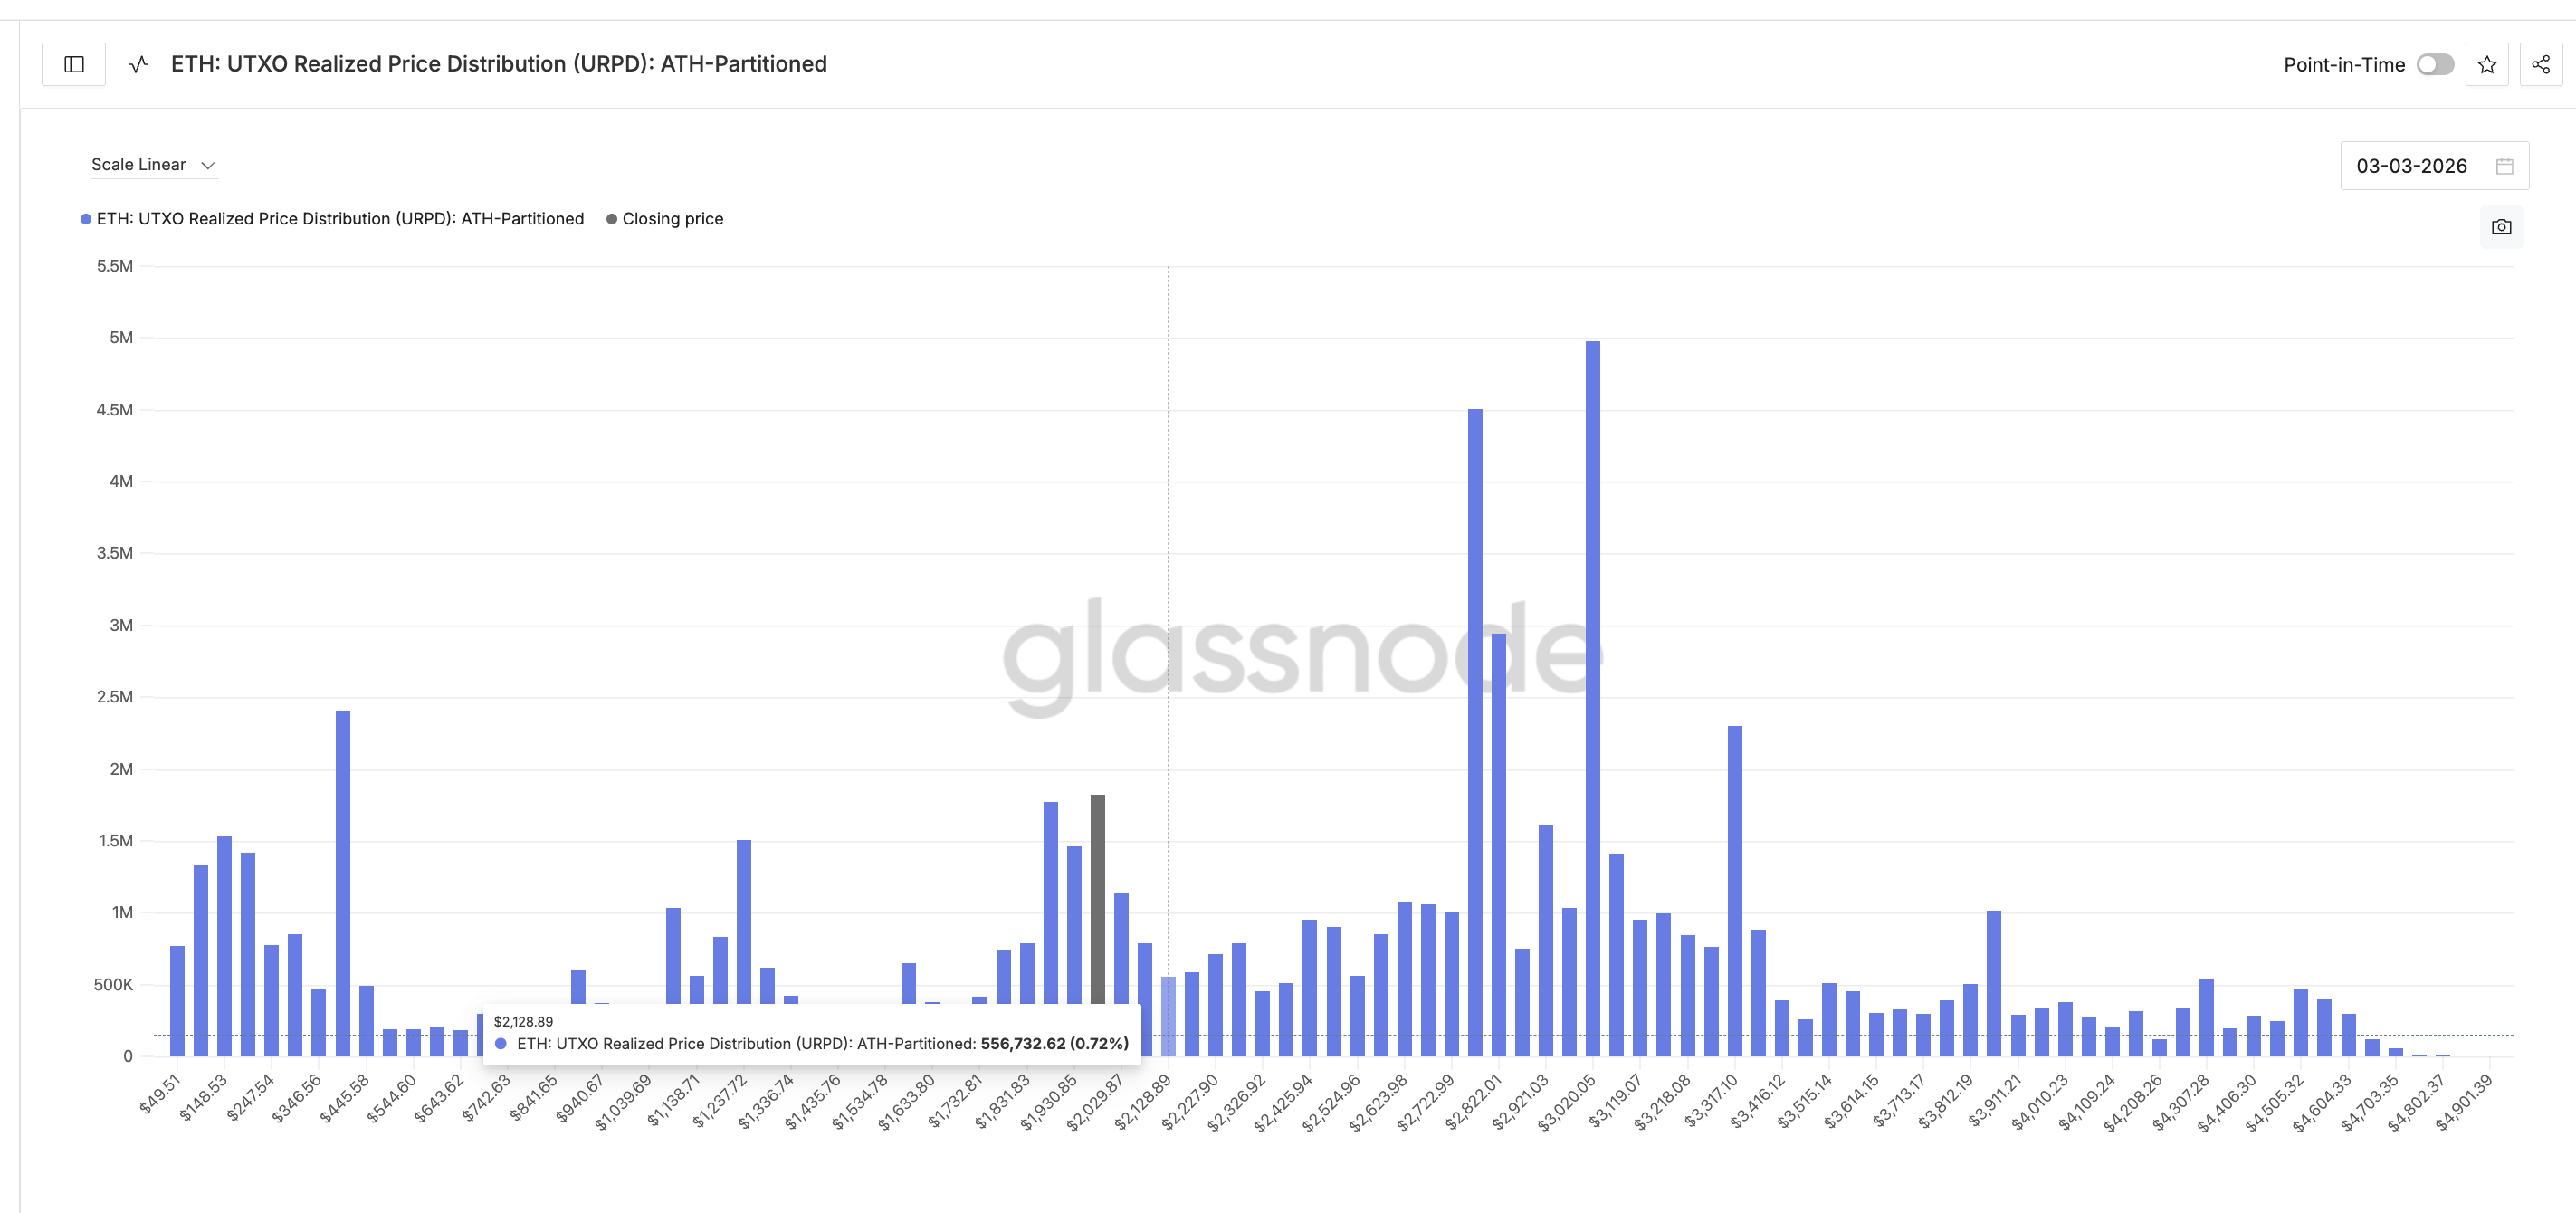
This creates a strong area of buying support around the current price, where the market’s confidence will be really challenged.
Interested in more crypto analysis? Subscribe to Editor Harsh Notariya’s Daily Crypto Newsletter here.
If Ethereum’s price consistently closes above key price levels without dropping back down, it suggests a positive shift in investor behavior. This would indicate that current holders are choosing to keep their Ethereum instead of selling, demonstrating increasing confidence in its future. This confidence could be strengthened by the recent positive flow of money into Ethereum ETFs, giving investors a reason to hold on rather than sell at their initial purchase price.
This is where the URPD clusters connect directly with the price chart.
Ethereum Price Levels Connect The ETF Clue With The Chart
The recent recovery in price can be mapped using Fibonacci levels, starting from the swing low on February 5th. This analysis suggests the price is still likely to move downwards overall, with any upward movement seen as a temporary bounce within a larger downtrend. This bearish outlook is supported by the fact that ETH is down nearly 13% for the month.
The levels now map almost directly onto the URPD clusters.
The price is initially facing resistance around $2,040, which also corresponds to a key level on Fibonacci charts (the 0.236 level). A significant supply cluster exists slightly lower, at $2,020. These two levels are very close together, creating a major challenge for the price. If the price closes above $2,040, it would suggest that the $2,020 supply level is holding strong, indicating increasing confidence in the price going higher.
If the price breaks through the current level, the next likely target is $2,140. This price point falls within a resistance zone between $2,120 and $2,170, where a significant amount of Ethereum (1.5% of the total supply) is held. Importantly, a rise to $2,140 from the recent low of $1,970 (following the February 20 ETF approval) would be an almost 10% increase. This gain is typical whenever money starts flowing *into* Ethereum ETFs after a period of outflows.
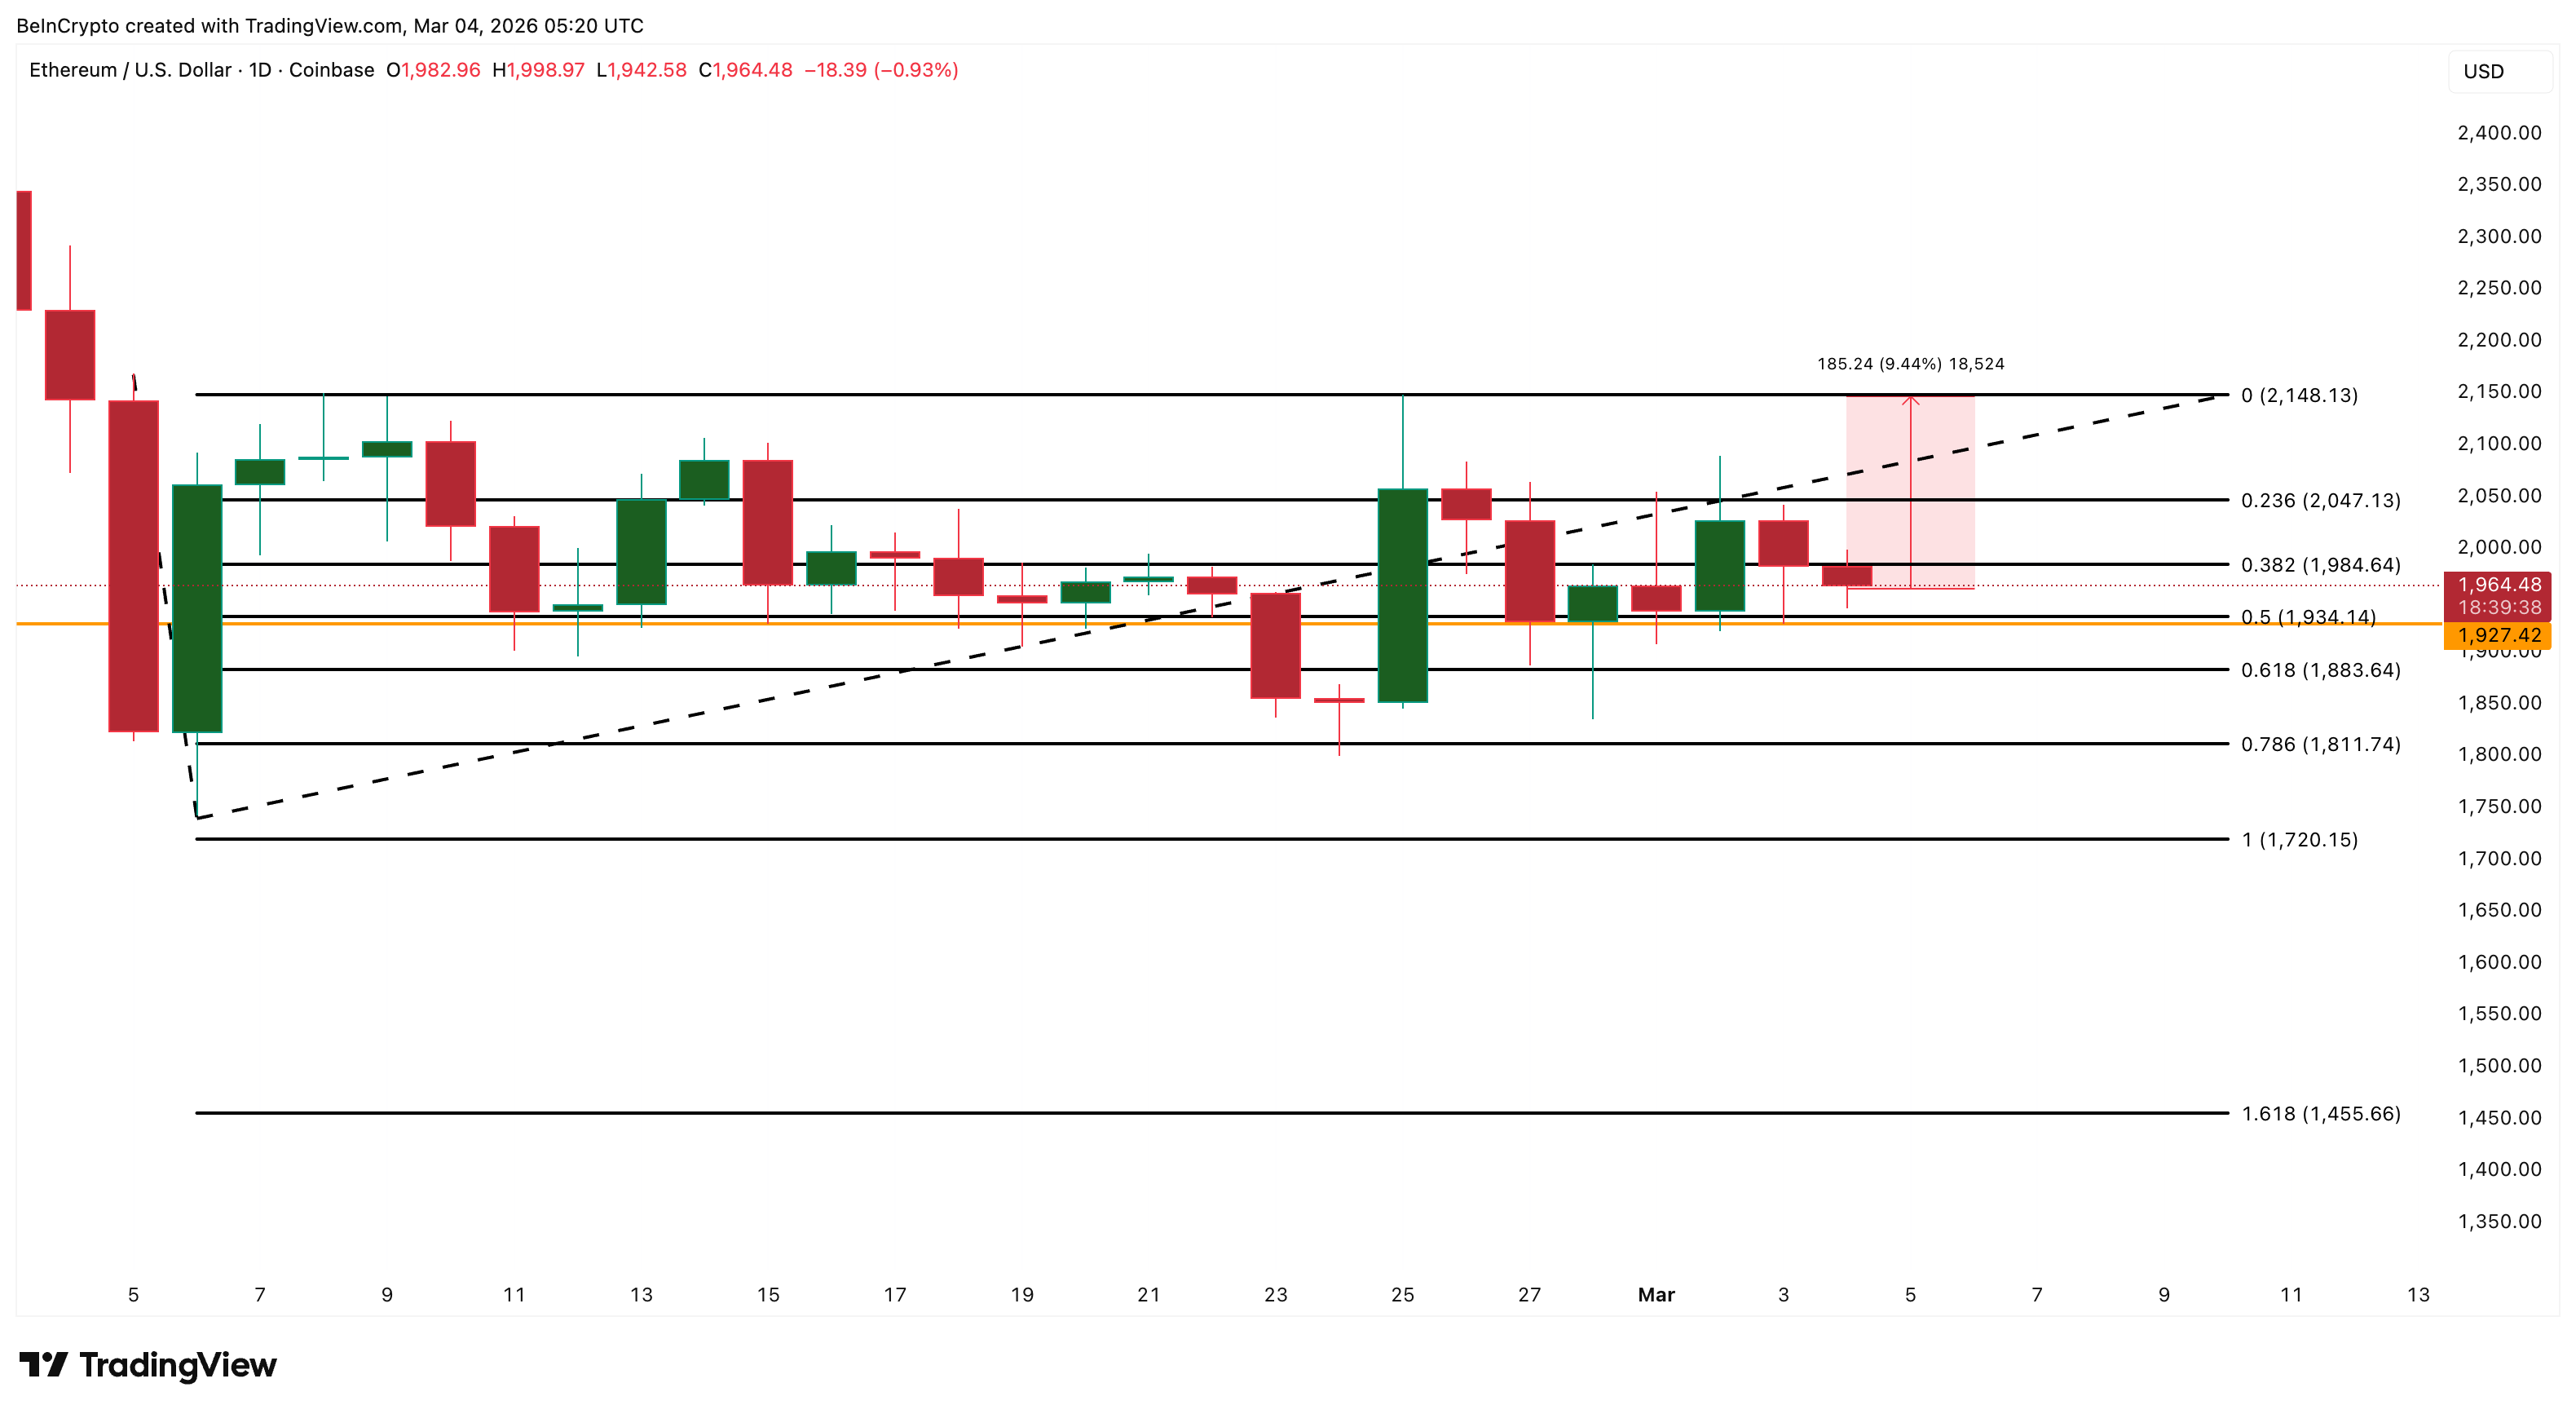
A combination of Fibonacci levels, a URPD cluster, and historical ETF behavior all point to $2,140 as a key price level where ETF activity might indicate the next move.
The nearest support level is $1,930. If the price falls below that, $1,920 represents a key low. Breaking below $1,920 would suggest the current bounce isn’t sustainable, although the overall trend would still appear positive. A further decline under $1,810 would negate this positive outlook and potentially lead to a drop to $1,720, with a longer-term target of $1,460.
Read More
- Gold Rate Forecast
- Dune 3 Gets the Huge Update Fans Have Been Waiting For
- Jack Osbourne Shares Heartbreaking Tribute to Late Dad Ozzy Osbourne
- 22 actors who were almost James Bond – and why they missed out on playing 007
- Every Creepy Clown in American Horror Story Ranked
- Hazbin Hotel Secretly Suggests Vox Helped Create One of the Most Infamous Cults in History
- Everything We Know About Gen V Season 3 (& Why It’ll Be a Very Different Show)
- Jason Statham’s Hit Creature Feature Is Heading to Streaming for Free
- As Dougal and friends turn 60, Radio Times explores the magic behind The Magic Roundabout
- Antiferromagnetic Oscillators: Unlocking Stable Spin Dynamics
2026-03-04 12:18