-
ETH’s price fell briefly, with the altcoin valued at $3470 on 9 April
Decline in price fueled an uptick in long liquidations
Ethereum’s [ETH] long liquidations closed the trading session on 9 April at a weekly high of $59 million, according to Coinglass data. This occurred despite the recent volatility in the altcoin’s price. In fact, according to CoinMarketCap, ETH was trading at just under $3550 at press time.

In simpler terms, liquidation of derivatives occurs when a trader is compelled to sell their position due to lacking funds to keep it open. This happens when the value of the underlying asset decreases significantly for those holding long positions, causing them to be pushed out of the market against their will.
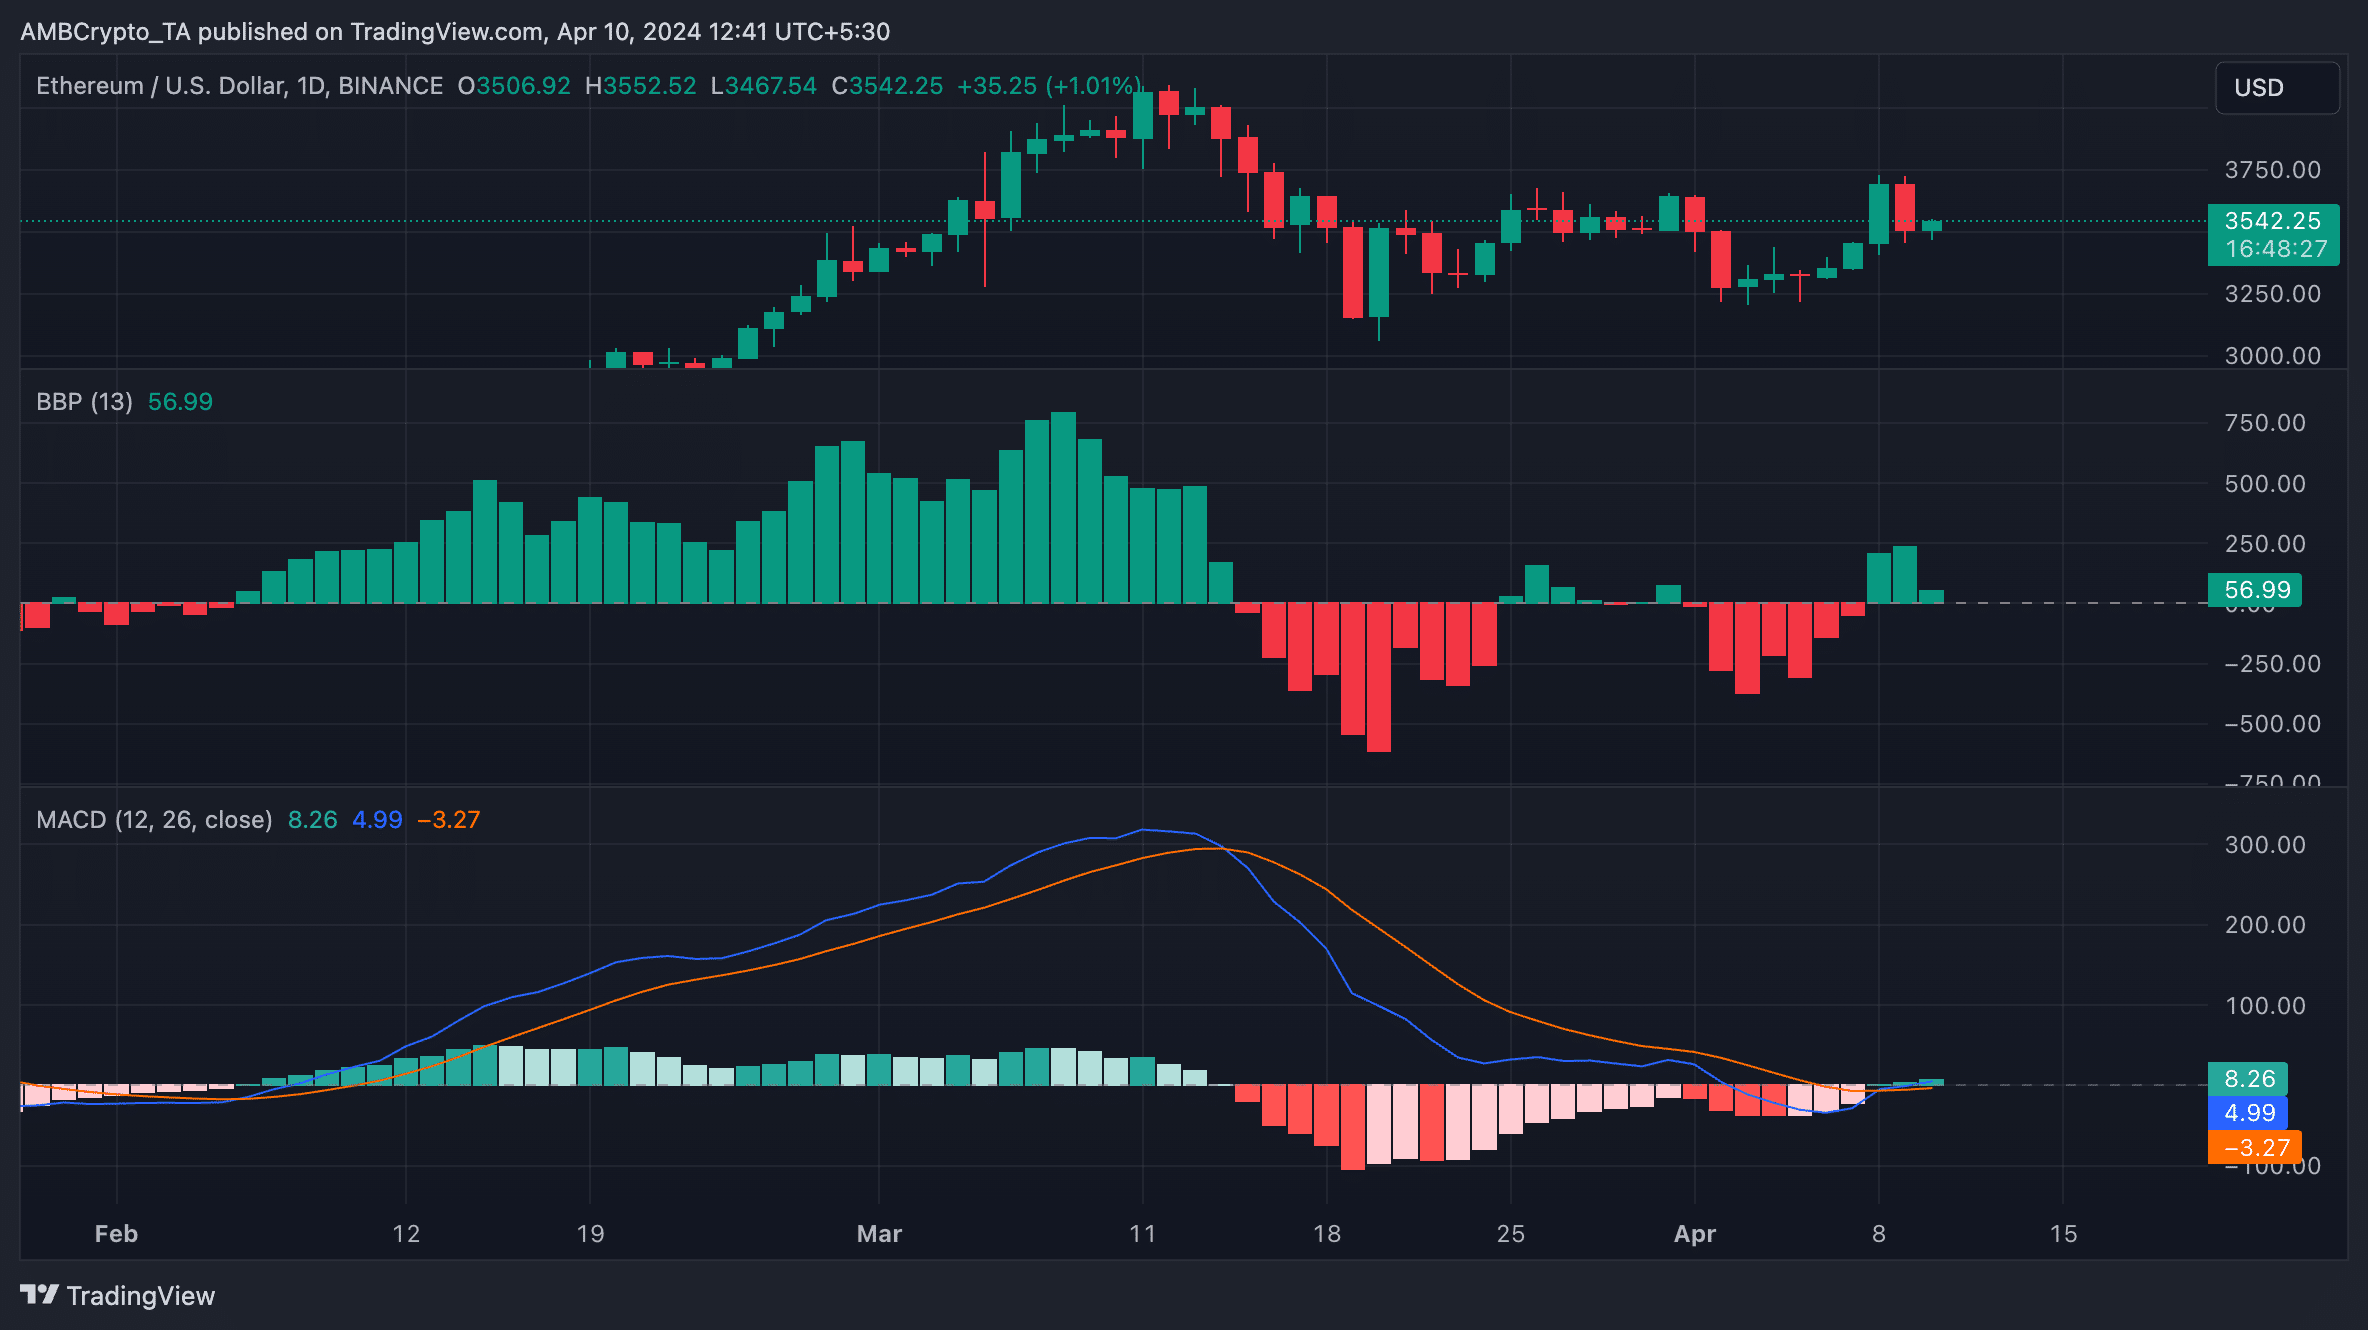
On April 9th, ETH experienced a significant increase in long positions being liquidated as its price dipped during intra-day trading. The cryptocurrency momentarily dropped below $3500, but managed to recover and end the day at $3505.
Following this event, individuals in the Futures market who had wagered on an Ethereum price increase suffered significant losses when the cryptocurrency’s value dropped to a record low of $3470. Conversely, short sellers recorded approximately $7 million in losses due to these price fluctuations.
Bulls’ attempt to displace the bears
Over the previous week, Ethereum’s price increase aligns with the broader upward trend in the cryptocurrency market. The global cryptocurrency market value has grown by approximately 4% within this timeframe.
On the 1-day chart, ETH‘s strong showing highlighted a resurgence of optimistic feelings among investors.
Read Ethereum (ETH) Price Prediction 2024-25
Since the Elder-Ray Index reading from the coin began on April 8th, all values have been positive. This indicator signifies the balance between market buyers and sellers. A positive indicator suggests that buying power is stronger than selling pressure in the market.
On April 8th, the MACD line of Ethereum (represented by the blue line) surpassed the Signal line (orange), and was situated above the zero mark as of now.

At this kind of intersection, investors take it as a bullish sign as it shows the altcoin’s short-term average is picking up speed. Compared to the long-term average, this indicates a shift in momentum. Essentially, traders see it as a signal to buy or sell short.
Read More
- Gold Rate Forecast
- PI PREDICTION. PI cryptocurrency
- Masters Toronto 2025: Everything You Need to Know
- Mission: Impossible 8 Reveals Shocking Truth But Leaves Fans with Unanswered Questions!
- SteelSeries reveals new Arctis Nova 3 Wireless headset series for Xbox, PlayStation, Nintendo Switch, and PC
- WCT PREDICTION. WCT cryptocurrency
- LPT PREDICTION. LPT cryptocurrency
- Eddie Murphy Reveals the Role That Defines His Hollywood Career
- Guide: 18 PS5, PS4 Games You Should Buy in PS Store’s Extended Play Sale
- Elden Ring Nightreign Recluse guide and abilities explained
2024-04-10 12:39