Key Takeaways
- Exchange reserves hit their lowest dataset reading as withdrawals accelerate.
- This is the third test of $1,600 support since 2023.
- TD Sequential 9-count printed directly inside the key support zone.
- Weekly volume hit its highest reading in the entire chart period.
Ethereum’s price dropped to a low of $1,505 this week before bouncing back to $1,631, a 4.5% increase from its daily low, putting it back above the $1,600 mark. The week started at $2,004 and briefly reached $2,018, but ultimately experienced a significant drop, resulting in an 18.58% loss for the week.
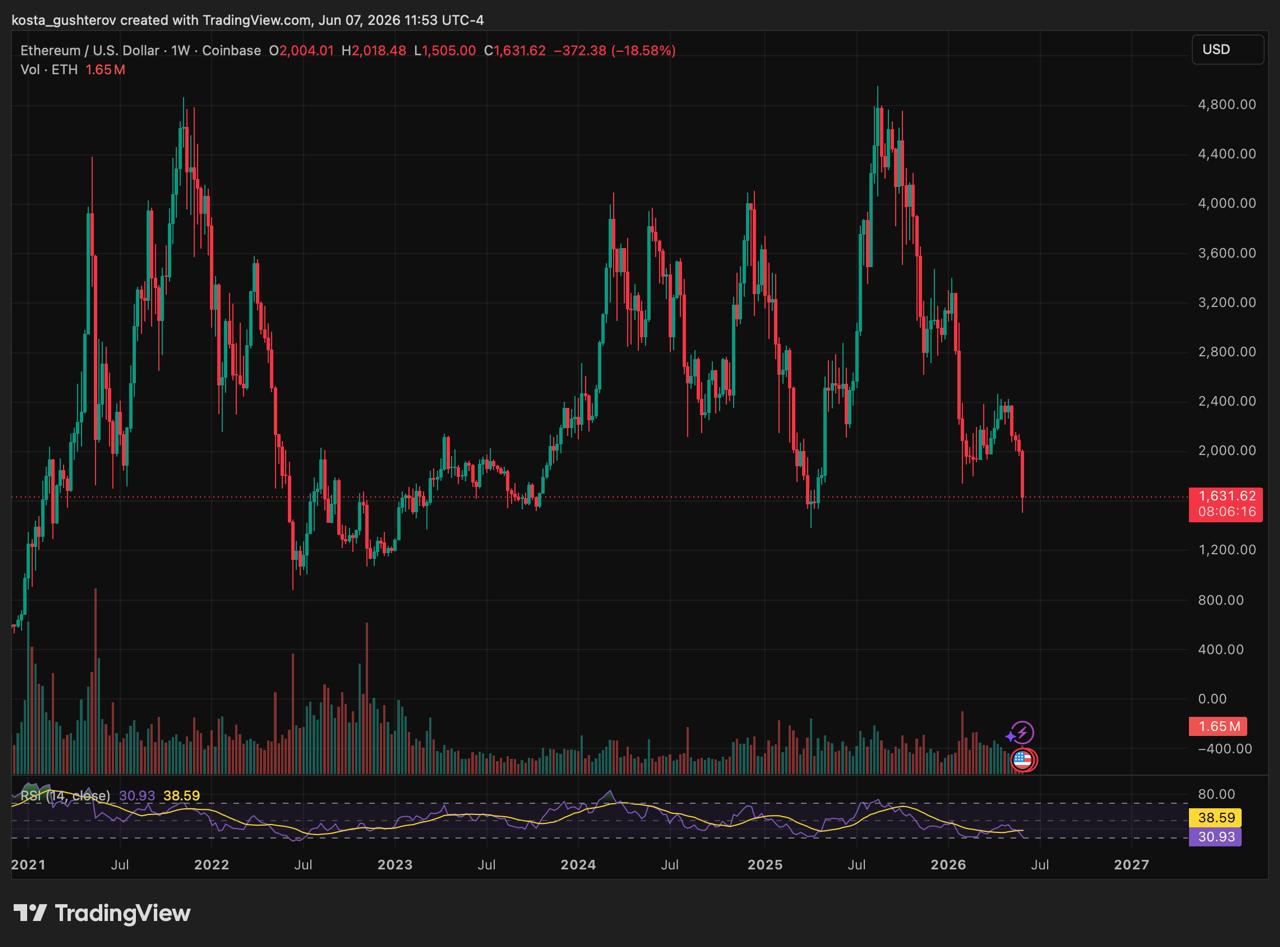
As I’ve been studying Ethereum’s price movements over the past few years, I’ve consistently observed that the $1,600 level is a critical price point. It acted as a floor during the mid-2023 dip before the price rose towards $4,800 in 2025, and again during the correction we saw in April 2025. We’re now testing this level as support for the third time since 2023, which reinforces its importance.
Understanding price memory explains why the $1,600 level is important for Ethereum. When a price hits a certain point and then changes direction, traders remember that level. When the price returns to that point, those traders – and others who missed out before – often see it as another opportunity to buy or sell. The more often a price level successfully causes a reversal, the more traders pay attention to it, making future tests of that level even more significant. Because the price of Ethereum has bounced off the $1,600 level twice before, a lot of traders are currently watching it closely.
The weekly Relative Strength Index (RSI) is currently at 30.93, with its signal line at 38.59, indicating it’s nearing oversold conditions similar to those seen at recent market lows. This week’s trading volume has also spiked to 1.65 million ETH – the highest single-week volume we’ve observed. This suggests strong selling pressure at a key support level is being met with some buying activity.
TD Sequential Buy Signal on the 3-Day Chart
Crypto analyst Ali Charts believes Ethereum is showing signs of a potential price increase. He points to the TD Sequential indicator on the 3-day chart, which recently signaled a ‘buy’ opportunity around the $1,612 level, as indicated by a completed 9-count pattern.
Rebound incoming!? 👀
The TD Sequential just flashed a buy signal on Ethereum $ETH.
— Ali Charts (@alicharts) June 7, 2026
The TD Sequential indicator helps identify when a price trend might be losing steam. A ‘9’ buy signal doesn’t predict *if* the price will go up, but rather that a recent downward trend has likely lasted long enough and could be weakening. When looking at a 3-day chart, each signal count represents three days of consistent price movement, making it a stronger indicator than if calculated over shorter periods.
This signal is important because it appeared right at a key support level of $1,600, which has proven reliable in the past two market cycles. When a weakening trend happens at a historically important price point, it’s a stronger indicator than either the trend or the price level alone.
Exchange Reserves: Selling Pressure Subsiding
According to data from CryptoQuant, the amount of Ethereum held in reserves by centralized exchanges has dropped to a record low of 14.6 million ETH. This continues a decline that began around mid-2025, when reserves were approximately 21 million ETH.
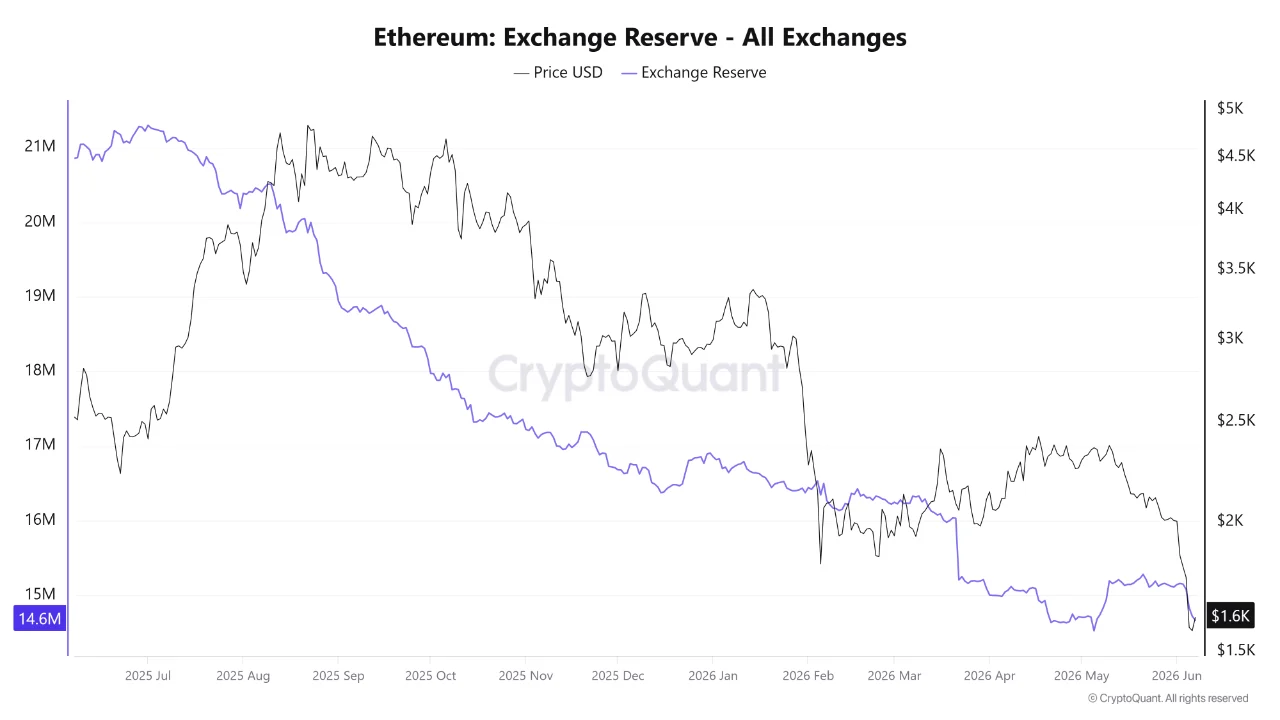
Reserves briefly increased when individual investors transferred cryptocurrency to exchanges, likely to adjust their investments. However, this trend didn’t last, and reserves have since started falling again. This continued decrease suggests that people are taking their cryptocurrency off exchanges and storing it in their own personal wallets, rather than preparing to sell it at the current price.
Here’s what this means in practice: because there’s less Ethereum currently available on exchanges, even a small increase in buying can cause a bigger price jump than usual. If more people start buying at these levels, the price could rise quickly – potentially more dramatically than past trends would indicate, due to the limited supply on exchanges.
What Needs to Hold
Ethereum is currently trading around $1,631, a price level that has proven to be a strong base twice in the past. Several indicators suggest the price is likely to stabilize here instead of continuing to fall. These indicators include a bullish signal from the TD Sequential indicator on the 3-day chart, historically low amounts of Ethereum held on exchanges, and a weekly Relative Strength Index (RSI) that is nearing oversold conditions – all converging at this same price point.
The current weekly trading period hasn’t finished yet. If the price closes above $1,600, it will maintain the existing support level and confirm the recent low of $1,505 as a temporary dip. However, if the price falls below $1,600, it will break a key support level that has fueled the last two price increases, potentially leading to further declines towards the $1,400-$1,500 range. Until the week closes on Sunday, any signals we’re seeing in the data are still just possibilities, not confirmed results.
This article is for informational purposes only and shouldn’t be considered financial, investment, or trading advice. Coindoo.com doesn’t support or suggest any particular investment or cryptocurrency. Before making any investment choices, be sure to do your own research and talk to a qualified financial advisor.
Read More
- USD HKD PREDICTION
- SUI PREDICTION. SUI cryptocurrency
- USD CHF PREDICTION
- EUR CNY PREDICTION
- USD TRY PREDICTION
- UNI PREDICTION. UNI cryptocurrency
- The Witness true story: How was Rachel Nickell’s killer eventually caught?
- 7 Classic Free Animated Shows Hidden Deep on Streaming
- Inside Lena the Plug and Adam22’s Love Story Amid Their Divorce
- Gold Rate Forecast
2026-06-07 19:58