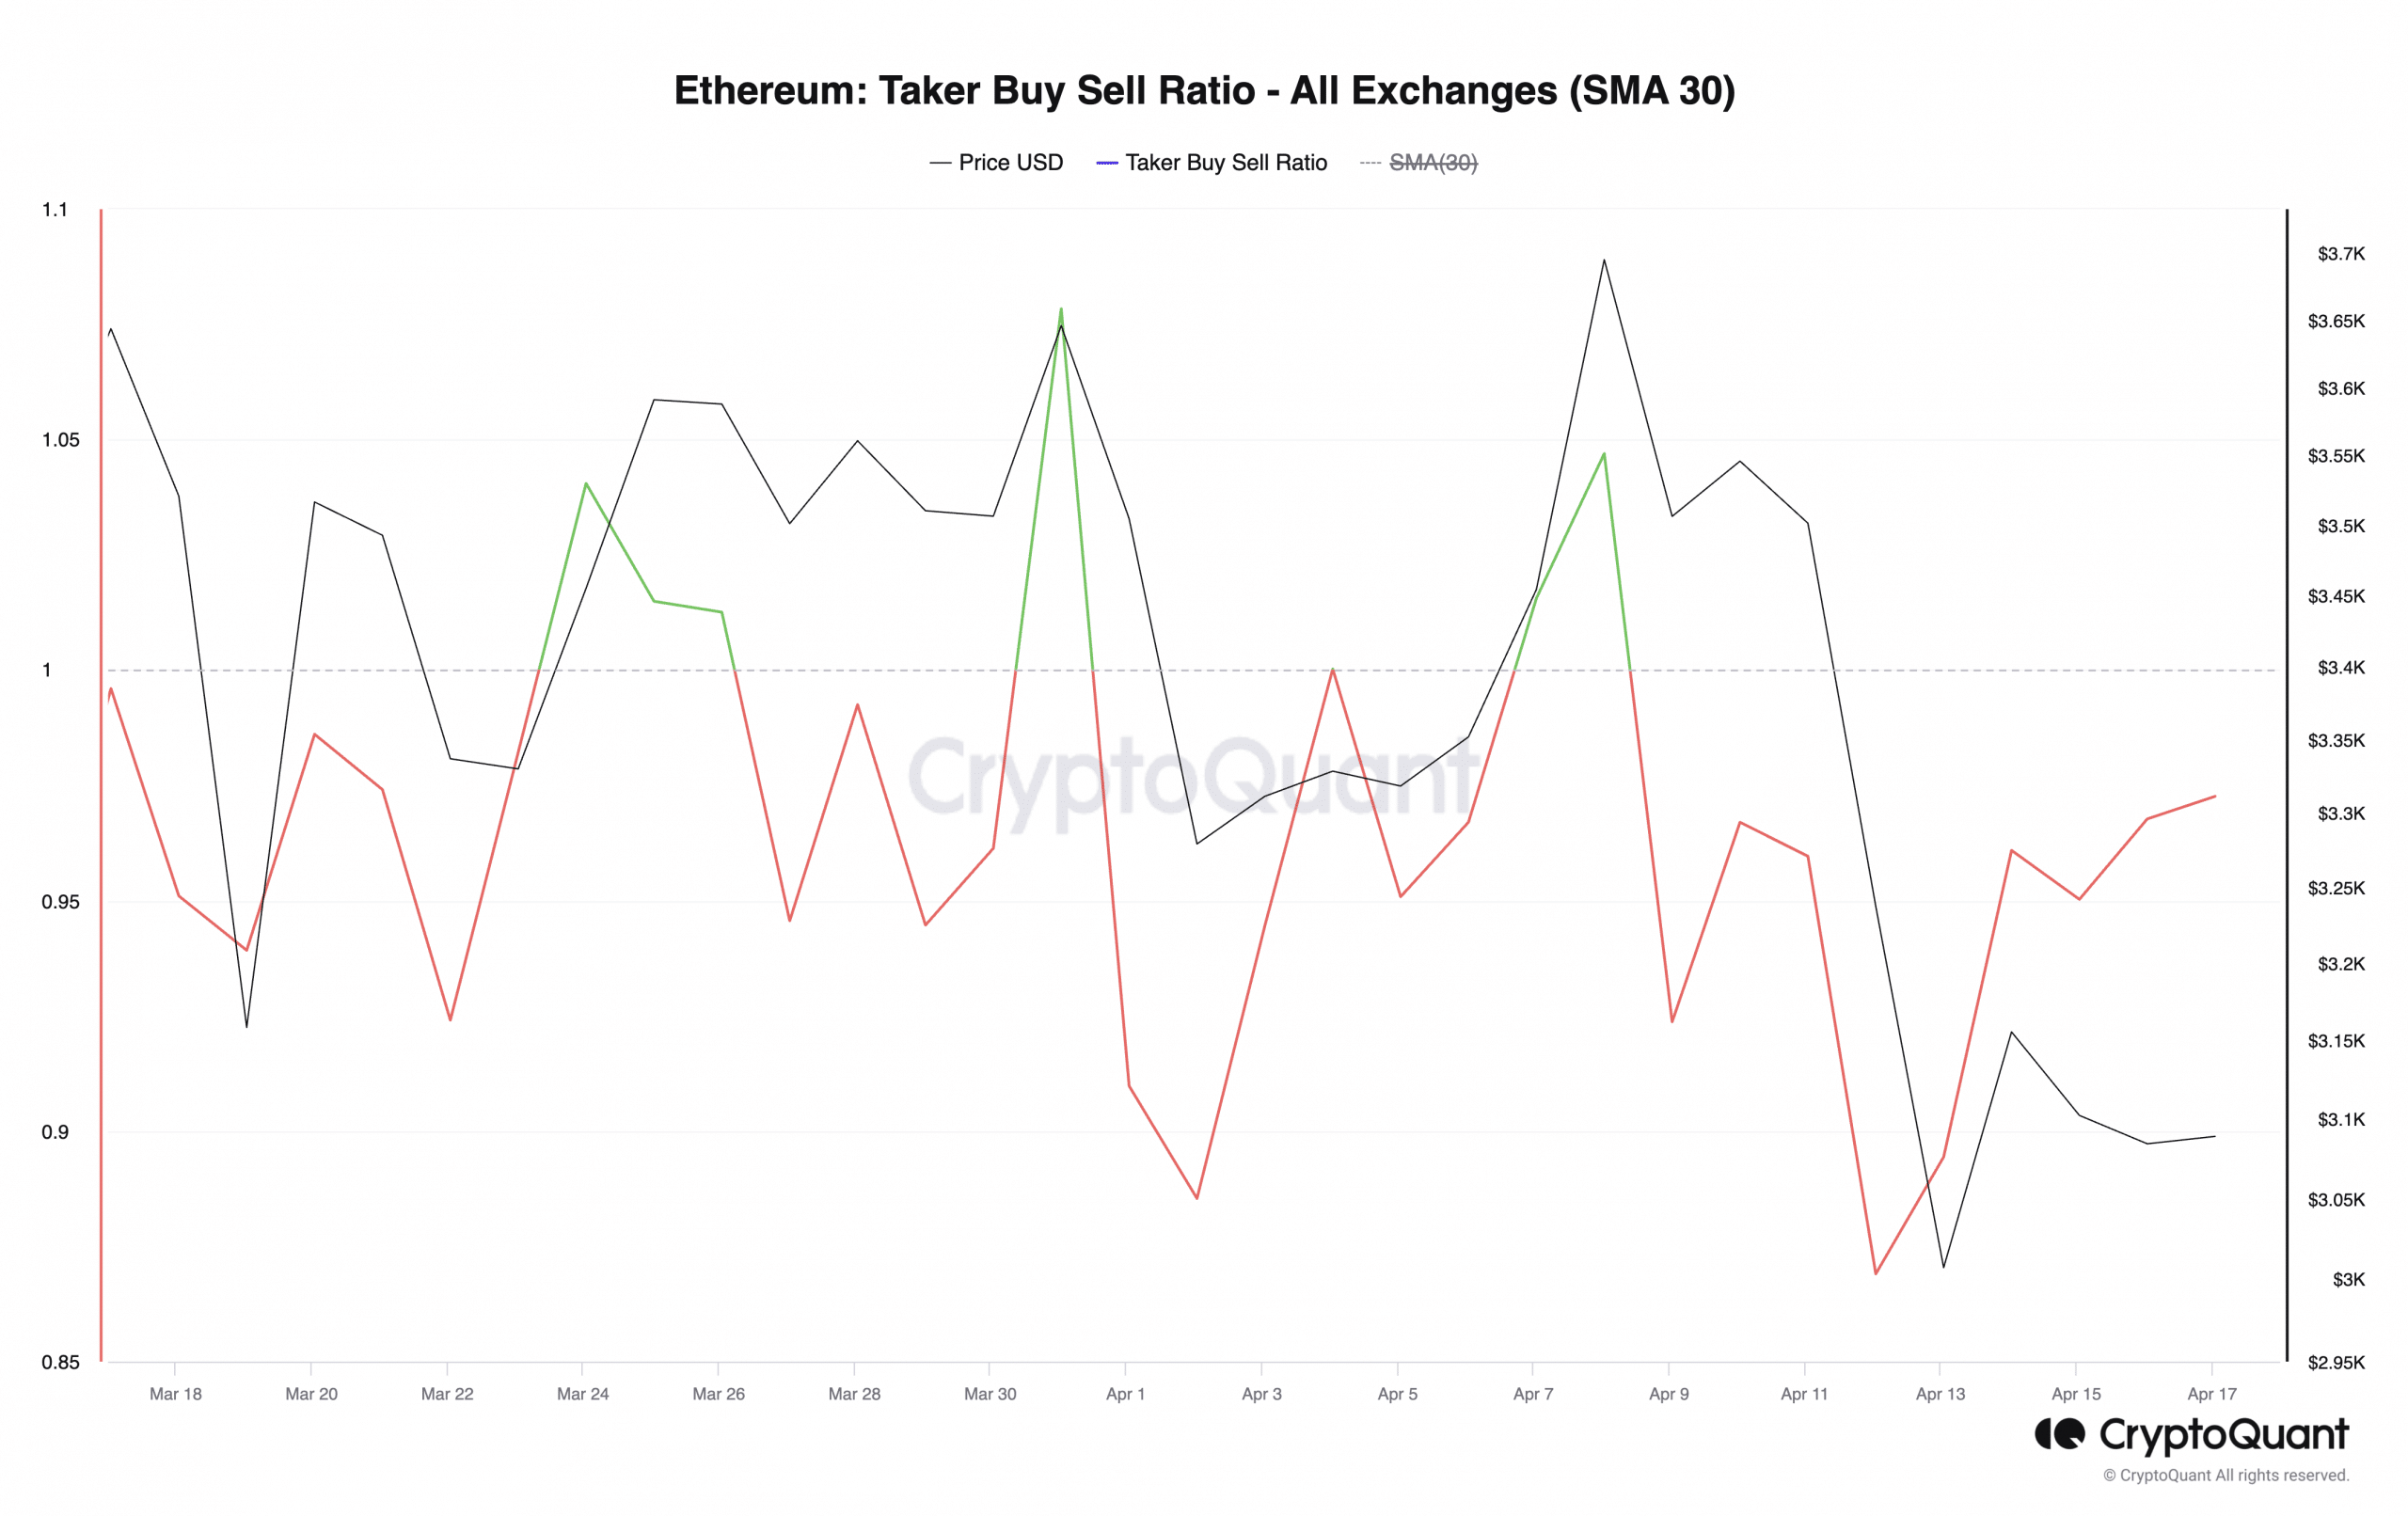
- Ethereum’s Taker Buy Sell Ratio attempts to breach the center line in an uptrend.
- However, bearish sentiments continue to grow.
According to CryptoQuant’s data, the Taker Buy Sell Ratio of Ethereum’s ETH is about to surpass its middle point, implying an increase in buying enthusiasm among traders despite current market instability.
The Taker Buy-Sell Ratio is a measurement indicating how much buy activity compared to sell activity there is in the futures market for a particular asset.
In simpler terms, when the figure is over 1, there are more purchases than sales; conversely, if it’s under 1, there are more sellers than buyers.
At press time, ETH’s Taker Buy Sell Ratio was 0.96, per CryptoQuant’s data.
The bears remain in control
Although the Taker Buy Sell Ratio for Ethereum has increased, analysis of its current and future market prices indicates that pessimistic attitudes towards the coin are still quite strong.
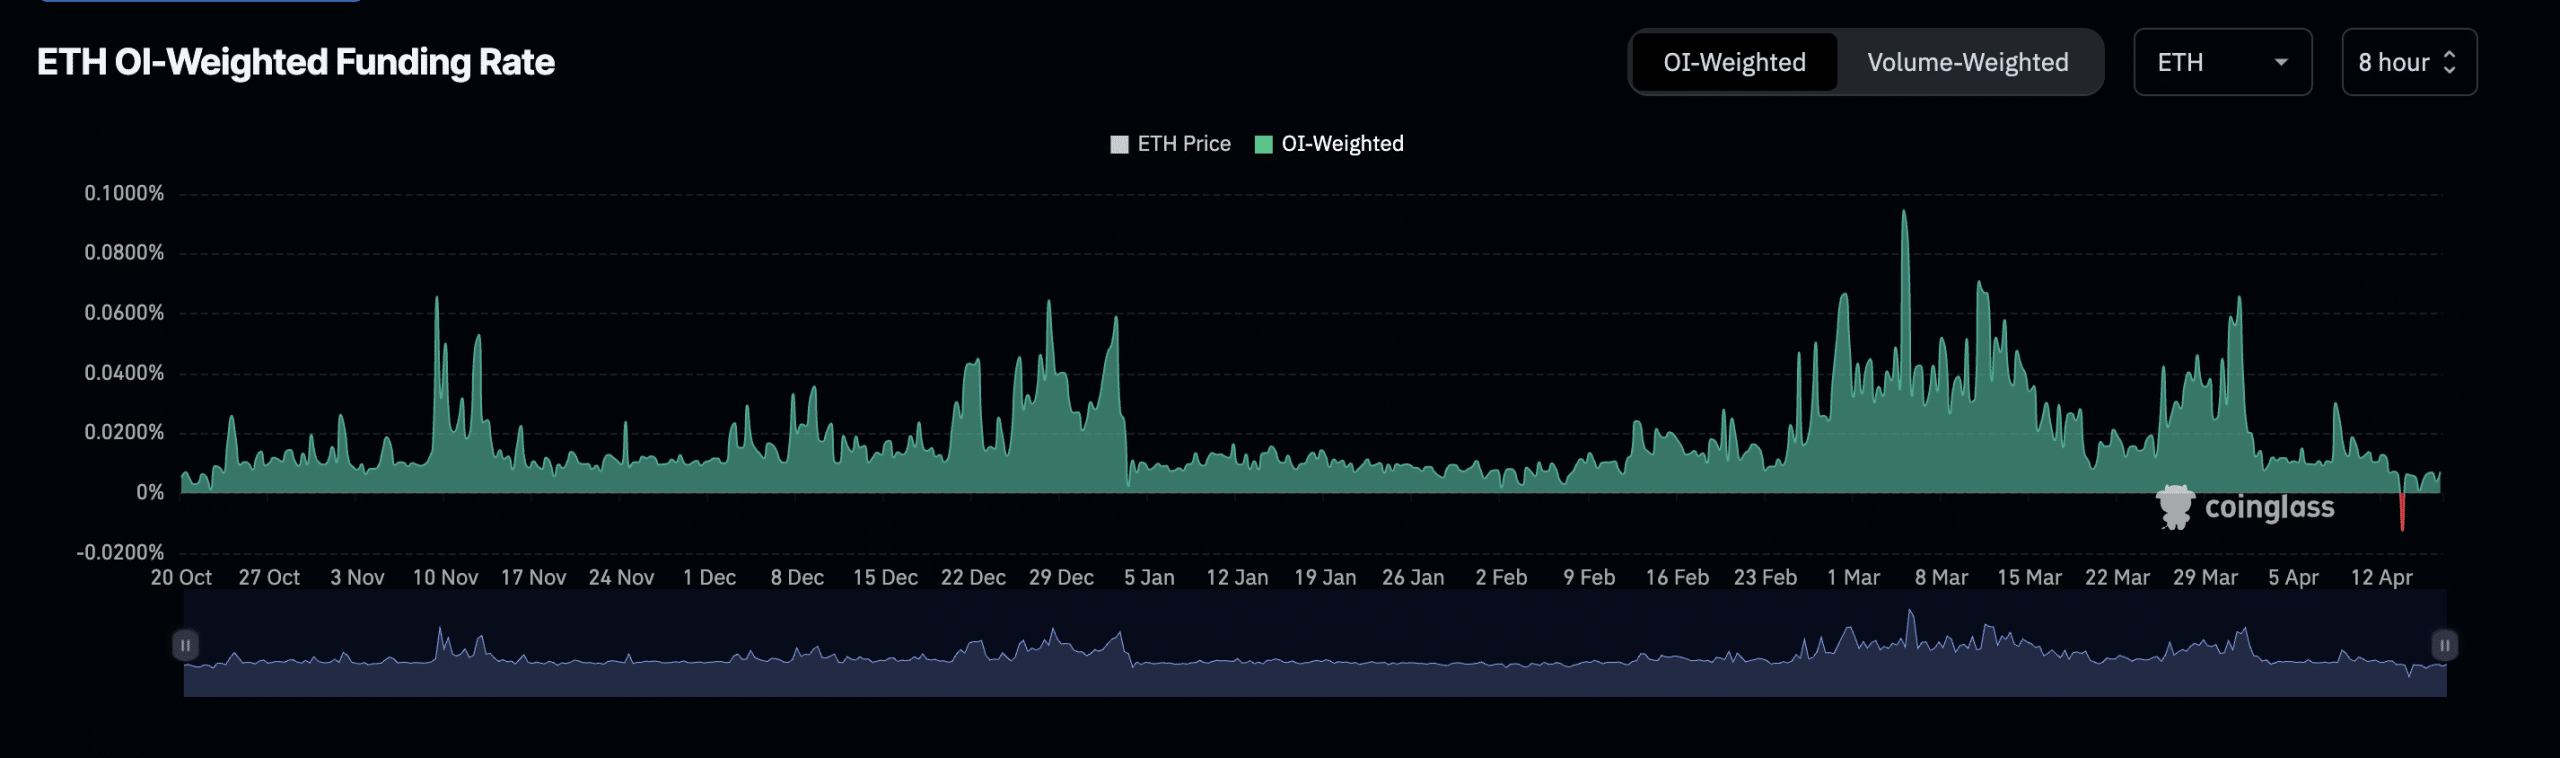
The open interest for ETH futures contracts on Coinglass has dropped to its lowest point since February 28th. This figure reached a high of $15 billion on April 9th, but has since decreased.
At $11 billion as of this writing, ETH’s Open Interest has plummeted 27% in the last seven days.
An asset’s Open Interest measures the value of its Futures contracts that are yet to be closed.
When it trends downward like this, it implies that traders are liquidating their holdings and leaving the market without making any new transactions.
Last week, the cost to hold long positions in Ethereum temporarily became less attractive than short positions for some traders on April 14th. This occurred due to a large influx of market participants entering into trades that betted against Ethereum’s price.
For the initial time since the bull market surge started in October 2023, ETH experienced a negative Funding Rate.
Based on the technical analysis of the daily chart in the spot market, signs point towards a potential drop below $3000 if pessimistic attitudes persist.
At the current moment, ETH‘s Awesome Oscillator, which signifies market momentum, is showing red histogram bars with a downturn trend that started on the 13th of April.
When the Awesome Oscillator of an asset displays red bars that point downwards, it is generally seen as a bearish indicator, implying increased demand to sell.
In a similar fashion, the ETH Parabolic Stop and Reverse (SAR) chart depicted the indicator’s dots hovering above the Ethereum price.
Read Ethereum’s [ETH] Price Prediction 2024-25
The Parabolic SAR indicator is used to identify potential trend direction and reversals.
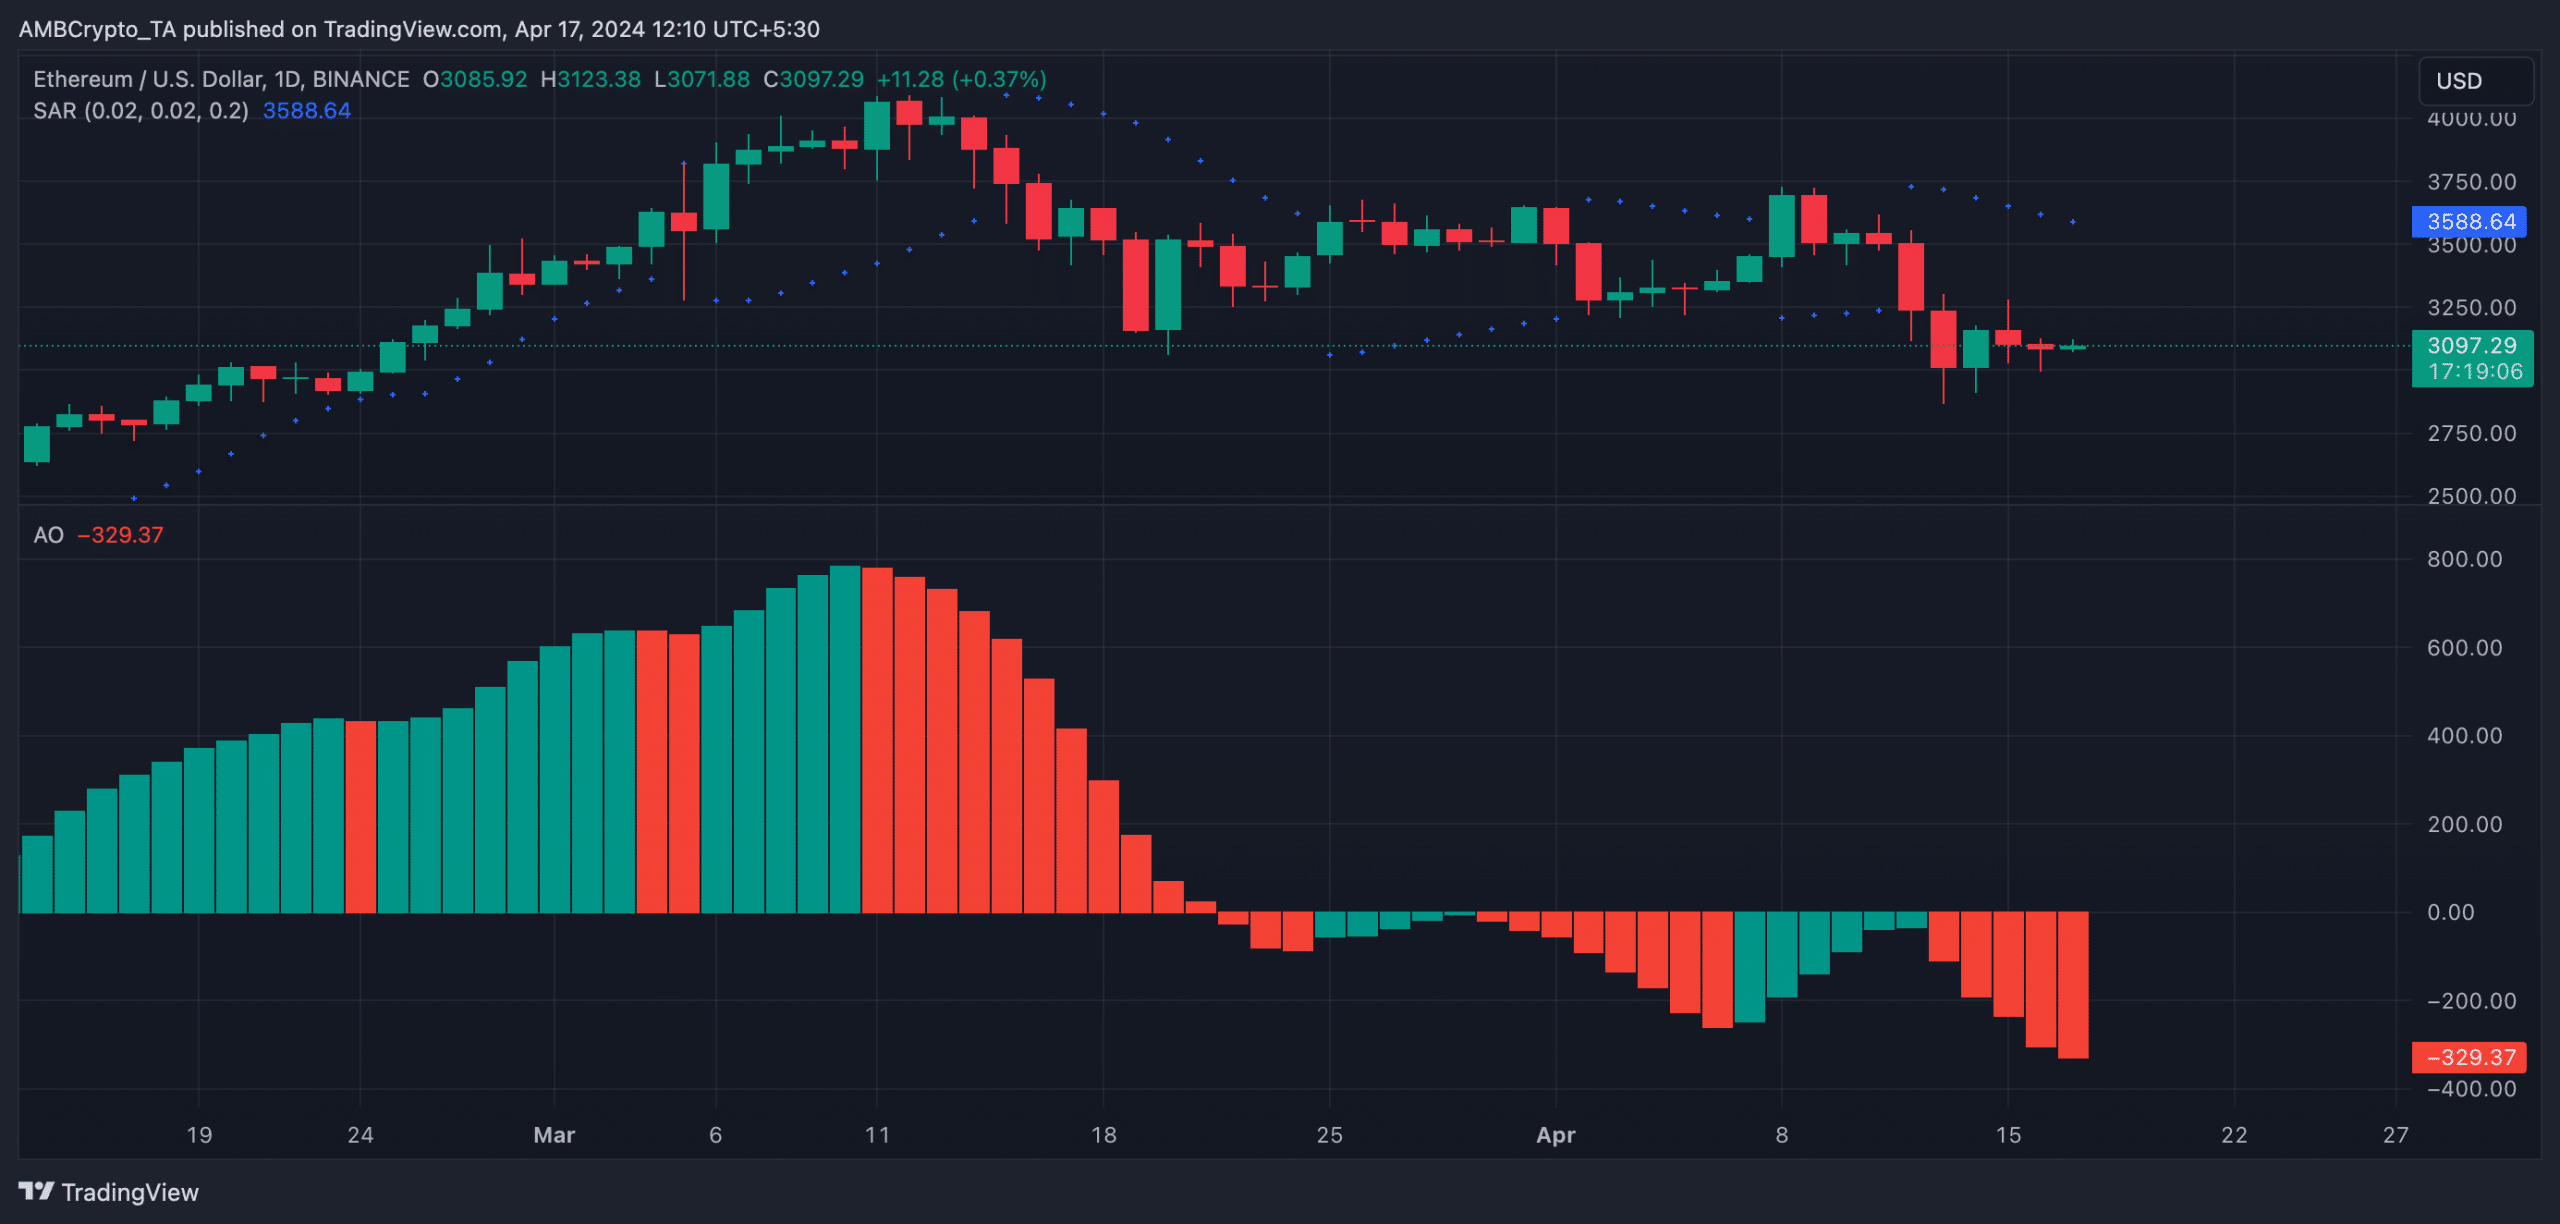
The market trend is considered bearish when its dotted lines are placed above an asset’s price.
Read More
- WCT PREDICTION. WCT cryptocurrency
- The Bachelor’s Ben Higgins and Jessica Clarke Welcome Baby Girl with Heartfelt Instagram Post
- AMD’s RDNA 4 GPUs Reinvigorate the Mid-Range Market
- Guide: 18 PS5, PS4 Games You Should Buy in PS Store’s Extended Play Sale
- Chrishell Stause’s Dig at Ex-Husband Justin Hartley Sparks Backlash
- Royal Baby Alert: Princess Beatrice Welcomes Second Child!
- PI PREDICTION. PI cryptocurrency
- Studio Ghibli Creates Live-Action Anime Adaptation For Theme Park’s Anniversary: Watch
- SOL PREDICTION. SOL cryptocurrency
- Viola Davis Is an Action Hero President in the ‘G20’ Trailer
2024-04-17 16:07