- Ethereum transaction fee fell to a four-month low on the charts
- This could be a sign of a decline in user activity on the network
Based on Santiment’s recent report, Ethereum’s [ETH] transaction fees have dropped to their minimal point since January.
At present, the average transaction fee on the Proof-of-stake (PoS) network amounted to $2.34, according to Santiment’s latest data. This figure represents a significant decrease of approximately 84% compared to its highest YTD level of $15, which was reached on 5 March.
Ethereum’s transaction fee is currently only $2.07, significantly lower than the $15.21 paid on March 4th due to high market demand. Historically, the crypto market experiences fluctuations between periods of excitement and optimism (“To the Moon”) and fear and skepticism (“Crypto winter”).
— Santiment (@santimentfeed) April 18, 2024
Decline in network activity
The decrease in Ethereum’s network fees can be explained by the drop in usage on its blockchain during the past month, as indicated by Artemis’ data. Ethereum has experienced a decrease in daily demand and activity over the last 30 days.
Since March 19th, the number of distinct Ethereum addresses participating in transactions has declined by approximately 7%. As a result, there have been fewer unique on-chain interactions with the network. Notably, Ethereum processed around 1.2 million transactions on April 17th, marking a 14% decrease in daily transaction volume over the past month.
The decrease in user engagement on Ethereum affected the productivity of its NFT and DeFi industries as well.
Over the past month, the volume of NFT sales on Ethereum’s PoS network has dropped noticeably. As reported by CryptoSlam, a total of $288 million worth of NFTs were sold during this period, representing a substantial decrease of 57% compared to previous months.
The total value locked in Ethereum’s DeFi sector, an important measure of network activity, has decreased. According to DefiLlama’s data, the TVL was currently at $49 billion, representing a 14% drop from its highest point this year of $57 billion.
Because Ethereum’s network usage has decreased, the Ethereum supply is now growing faster than before. This results in more ETH coins being generated and released into circulation, putting additional pressure on the price of Ethereum to go down.
Based on information from Ultrasound.money, Ethereum’s total supply has increased by approximately 2,667 Ether in just the last week.
ETH local top reached?
According to Santiment’s post, the decrease in Ethereum’s network fees could indicate that the cryptocurrency’s price is approaching its lowest point and a price rally might follow. To ascertain if a price bottom has been reached, it’s essential to examine Ethereum’s Age Consumed metric. This indicator monitors the movement of coins that have not been used for some time.
When the number of old, seldom-traded coins increases, it signifies that a significant number of these coins are now being exchanged between buyers and sellers. This is an indication of a noticeable change in the habits of long-term coin holders.
Is your portfolio green? Check the Ethereum Profit Calculator
An opposite trend in Ethereum’s Age Consumed indicator might mean that old coins are staying put in wallets and not being sold or exchanged.
A metric is an effective indicator of market peaks and valleys since long-term investors seldom transfer their inactive cryptocurrencies. Consequently, such occurrences significantly impact market situations.
Based on Santiment’s findings, the Age Consumed for Ethereum (ETH) spiked noticeably on April 18, implying that a potential market bottom could have occurred around that time.
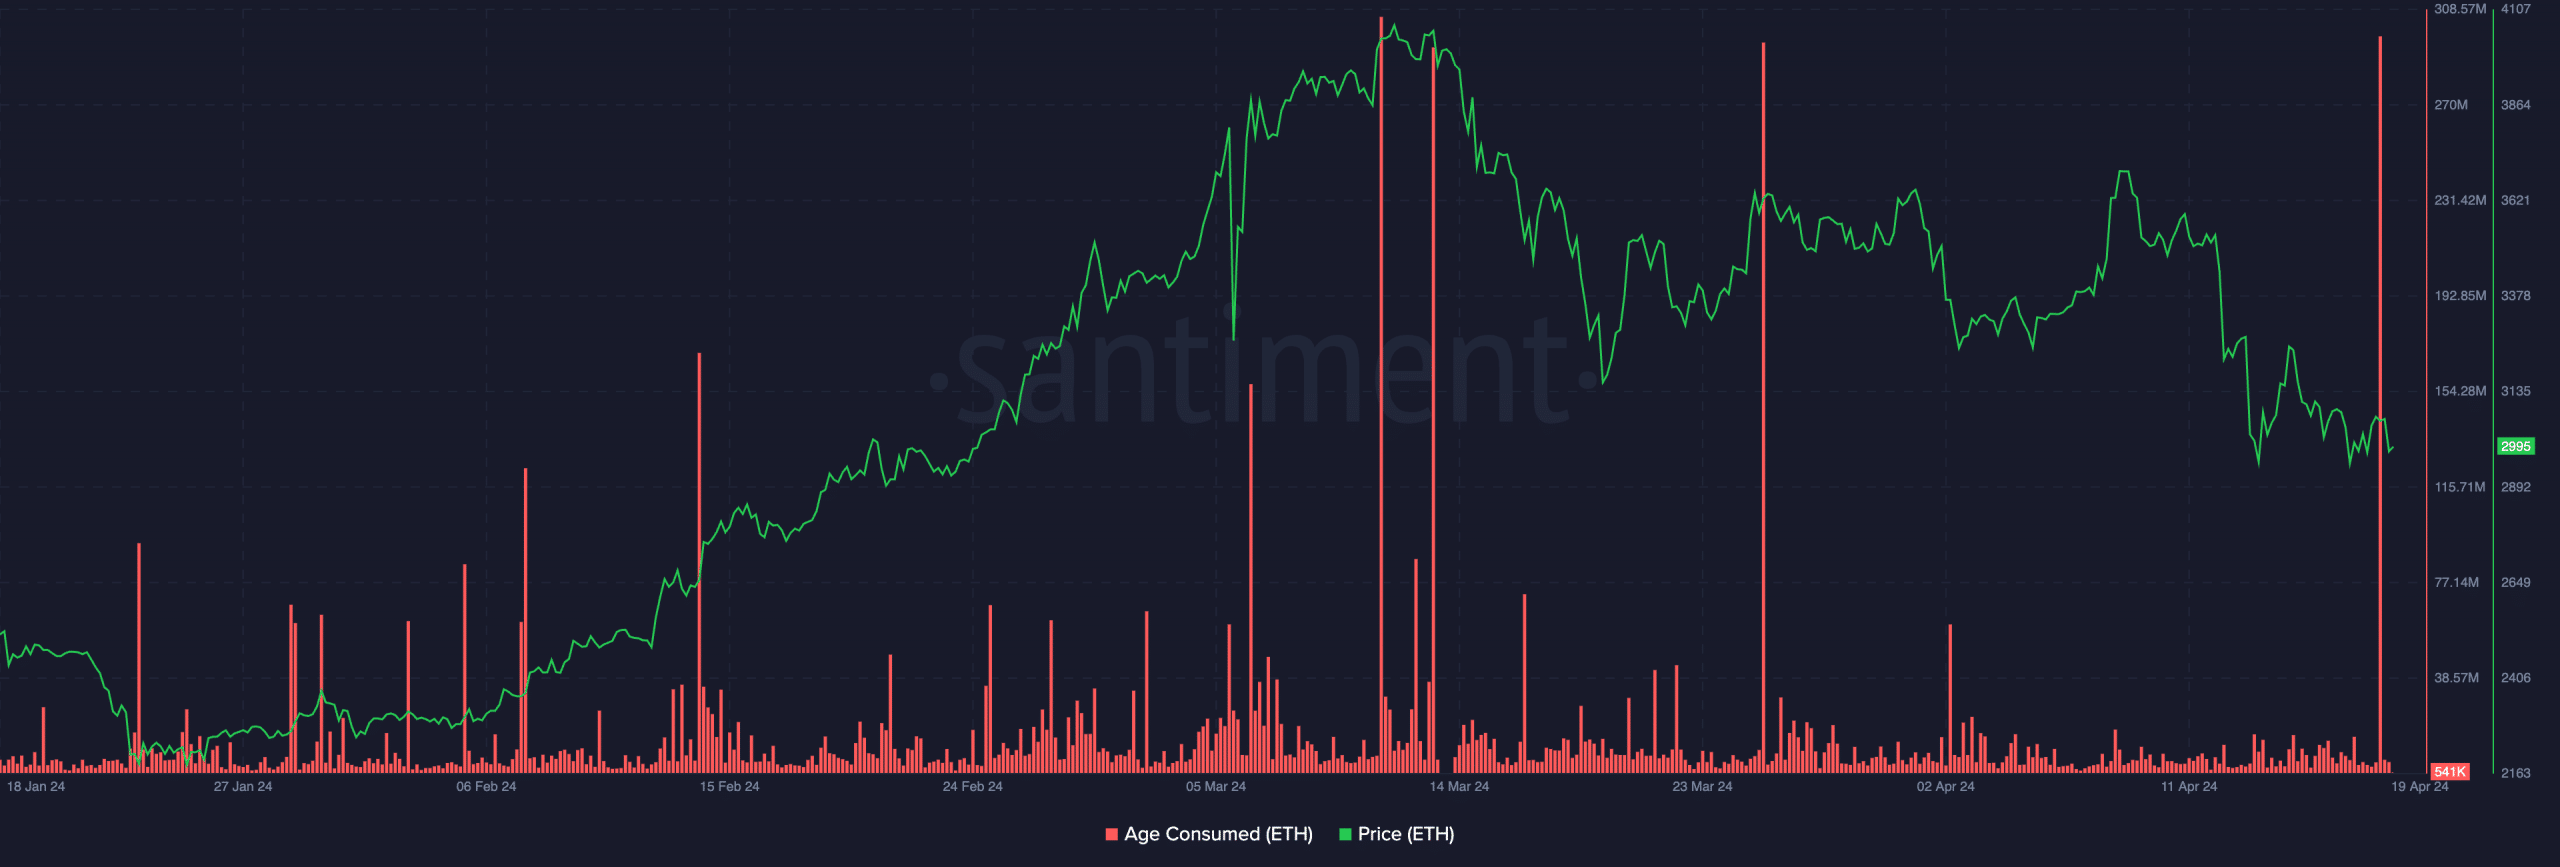
In simpler terms, examining the coin’s previous instances of high “Age Consumed” levels, I noticed that such occurrences often led to price drops – possibly indicating price peaks. The same situation might apply to the most popular altcoin in the market.
Additionally, the current market feeling towards Bitcoin is strongly negative as the halving event approaches within the next day. The price chart indicators also hint that this potential event may have already influenced the cryptocurrency’s value.
Read More
- LDO PREDICTION. LDO cryptocurrency
- JASMY PREDICTION. JASMY cryptocurrency
- Can Ethereum ETFs outperform Bitcoin ETFs – Yes or No?
- Chainlink to $20, when? Why analysts are positive about LINK’s future
- Citi analysts upgrade Coinbase stock to ‘BUY’ after +30% rally projection
- Why iShares’ Bitcoin Trust stock surged 13% in 5 days, and what’s ahead
- Spot Solana ETF approvals – Closer than you think?
- Orca crypto price prediction: Buying opportunity ahead, or bull trap?
- Top 10 Stocks and Crypto Robinhood Alternatives & Competitors
- ‘China’s going to have it’ – Donald Trump crypto stance, finally explained
2024-04-19 16:08