Well, well, well, look who’s back from the edge of a downtrend-Optimism (OP), trying to pull itself together after what felt like weeks of constant disappointment. The price action is finally stabilizing (hallelujah!), and those pesky volatility indicators are calming down, too. It’s like the market’s doing yoga, but everyone’s waiting for the first sign of real breakthrough. Cue the dramatic music. 🧘♀️
Open Interest Data: Traders Are Just ‘Chillin’ for Now
Fresh off the press, new derivatives data shows that traders are in full-on “cautious mode” right now. Open Interest (OI) across OP markets has been stuck between $54.3 million and $54.5 million like it’s a hamster wheel no one wants to leave. Looks like traders are waiting for the inevitable market breakout before committing to any long or short positions. Nothing says “I’m cautiously optimistic” quite like a stagnating OI. Just don’t expect any fireworks unless someone gets bold enough to make a move.
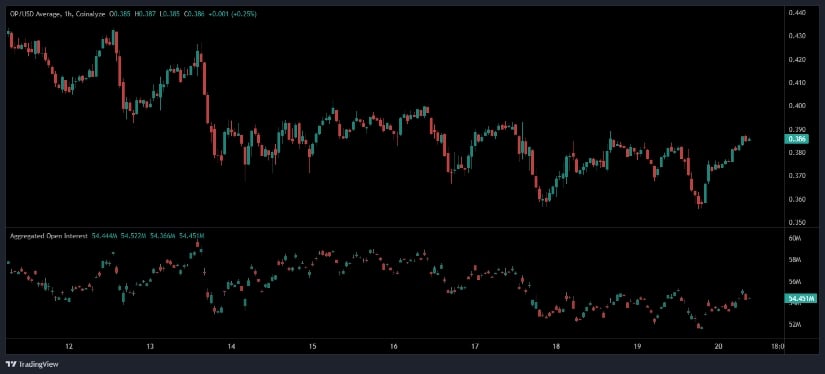
On the charts, OP is playing it safe with some small rebounds around the $0.36-$0.38 zone. But, spoiler alert: it’s not setting the world on fire. Sellers aren’t totally running the show anymore, but buyers are still on the sidelines, probably waiting for their moment. Historically speaking, when OI gets tight and price action gets stagnant, a big move is usually lurking around the corner. But hey, we’re not holding our breath just yet. 😴
OP Holds Steady Around $0.37, But Not Much Excitement
According to BraveNewCoin, OP is sitting pretty at $0.37, which is a lovely 1.52% dip from the last 24 hours. It’s like a gentle decline-a “no big deal” kind of drop. Market cap? $710.72 million. Daily trading volume? $92.56 million. Not terrible, but not exactly setting any records either. Think of it as the middle child of the crypto market: not the best, but definitely not the worst.
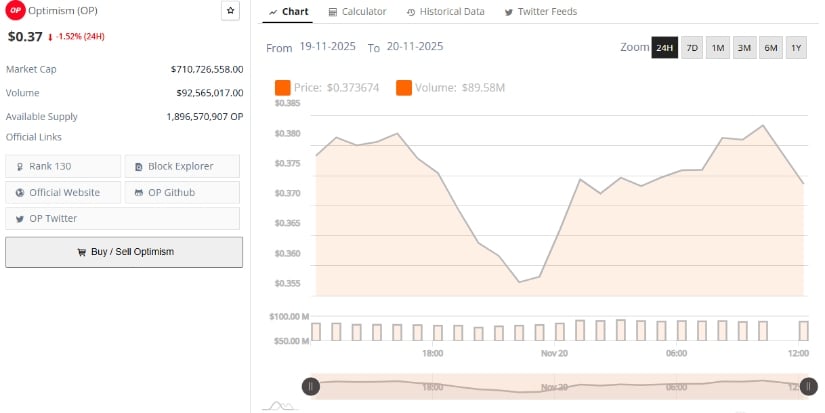
Recent price movements? Oh, you know, just fluctuating within a tight range. OP’s having a hard time breaking free from its downtrend, and it seems like the buyers are holding the line while the sellers are, well, also holding the line. It’s a “who will blink first?” situation. In case you were wondering, this whole thing is pretty much in line with what’s going on across the broader Layer-2 token market, where things have been cooling down all November. Yawn. 🥱
Technical Indicators: The Bearish Vibe is Real, But Could Be Turning?
Let’s turn to the charts, shall we? TradingView’s daily chart shows OP is hanging out just below the Bollinger basis line at $0.392. And, oops, the lower Bollinger Band is down at $0.339, just waiting to be tested. The bands are tightening, which means, yep, you guessed it, reduced volatility. The market’s getting ready to make a move-eventually. Maybe. Fingers crossed. 🤞
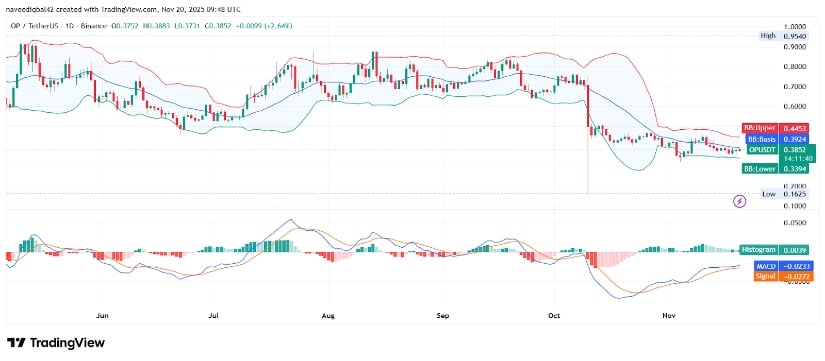
However, OP can’t seem to break above that pesky middle Bollinger Band. It’s like the price is a high schooler trying to make it to the front of the class but always getting stuck behind the crowd. Come on, OP, just push through! The MACD indicator is still showing a faintly bearish trend, with the MACD line hanging out below the signal line. It’s not exactly the “end of the world” bearish, but it’s not looking like a party either. Improvement? Sure. But a full-on bullish breakout? Not yet.
Read More
- The Super Mario Galaxy Movie: 50 Easter Eggs, References & Major Cameos Explained
- All 13 Smash Bros. Characters in the Super Mario Galaxy Movie
- 10 Best Free Games on Steam in 2026, Ranked
- WTH?! Twitter Drops Fake Daredevil: Born Again Season 2 Spoilers as Character Return Confirmed
- Welcome to Demon School! Iruma-kun season 4 release schedule: When are new episodes on Crunchyroll?
- Dune 3 Gets the Huge Update Fans Have Been Waiting For
- Highly Anticipated Strategy RPG Finally Sets Release Date (And It’s Soon)
- Sydney Sweeney’s The Housemaid 2 Sets Streaming Release Date
- Why is Tech Jacket gender-swapped in Invincible season 4 and who voices her?
- Forza Horizon 6 ‘Prologue’ gameplay
2025-11-20 19:29