- PEPE hits $2.6 billion trading volume as technical signals indicate potential bullish breakout opportunities.
- 73.6% of PEPE holders are in profit, with key resistance at $0.000022 and strong support at $0.000013.
As a seasoned analyst with years of experience navigating volatile markets, I find myself intrigued by the recent developments surrounding PEPE. With $2.6 billion in trading volume and a TD Sequential buy signal suggesting potential bullish breakout opportunities, it’s hard not to feel optimistic about this meme coin.
Over the last fortnight, the cryptocurrency market has shown a blend of rising and falling trends, with a significant shift from optimistic bullishness to cautious bearishness. Some assets in this mix, such as meme coins like Pepe [PEPE], have witnessed a drop in trading activity due to renewed focus on Bitcoin [BTC].
Regardless, the technical data indicates that PEPE might be primed for a comeback, given the surge in its trading volume up to $2.6 billion.
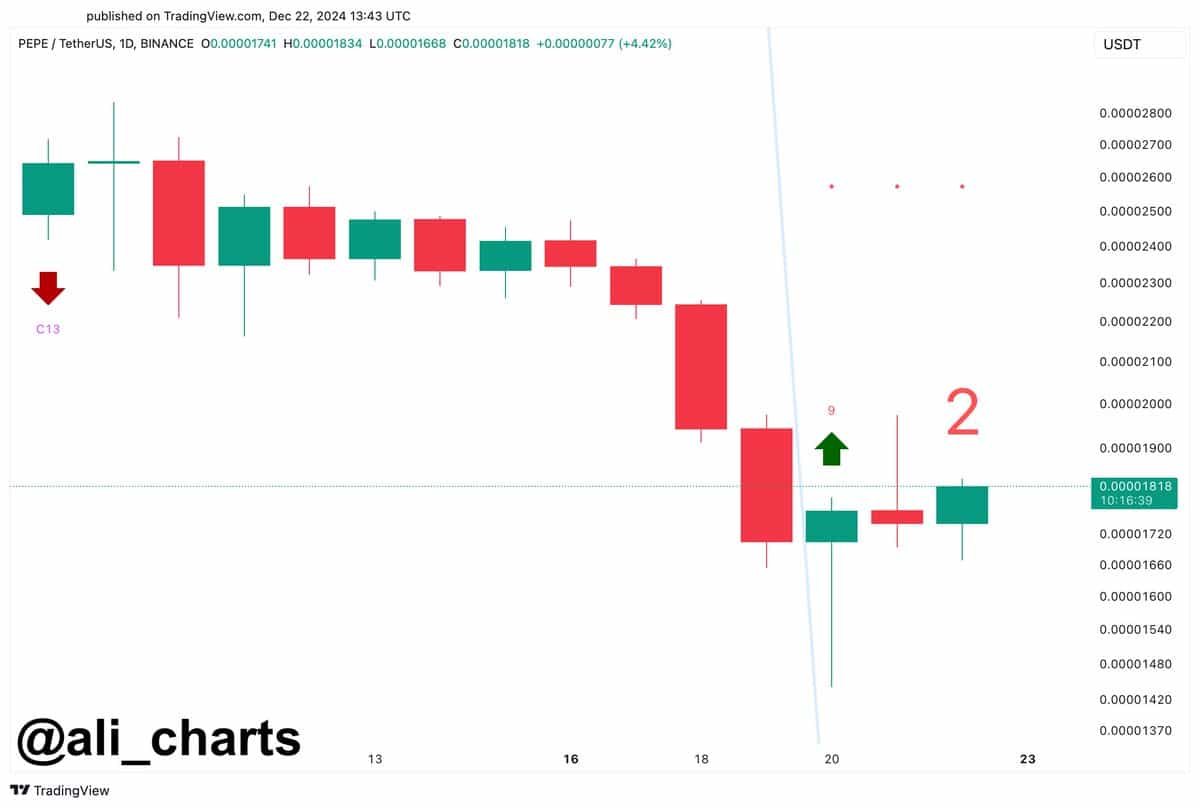
TD sequential buy signal indicates potential rebound
According to technical analysis tools, there could be a change in direction for PEPE, as the TD Sequential indicator shows a buying opportunity on the daily chart. This is usually understood as a precursor to a shift in the current trend.
Historically, these signals have frequently predicted price increases, making them a key area of attention for traders hoping for a market recovery.

At the moment of reporting, PEPE was exchanging hands for approximately 0.00001791 USD, marking a 2% rise in its value over the past 24 hours. However, over the last week, it has dropped by 25.97%.
Over the last week, the price of this cryptocurrency has seen fluctuations ranging from $0.00001455 to $0.0000242. Traders are keeping a close eye on the potential resistance at approximately $0.00002201, as it coincides with significant levels indicated by Bollinger Bands for possible breakthroughs that could sustain an upward trend.
Whale activity slows after November spike
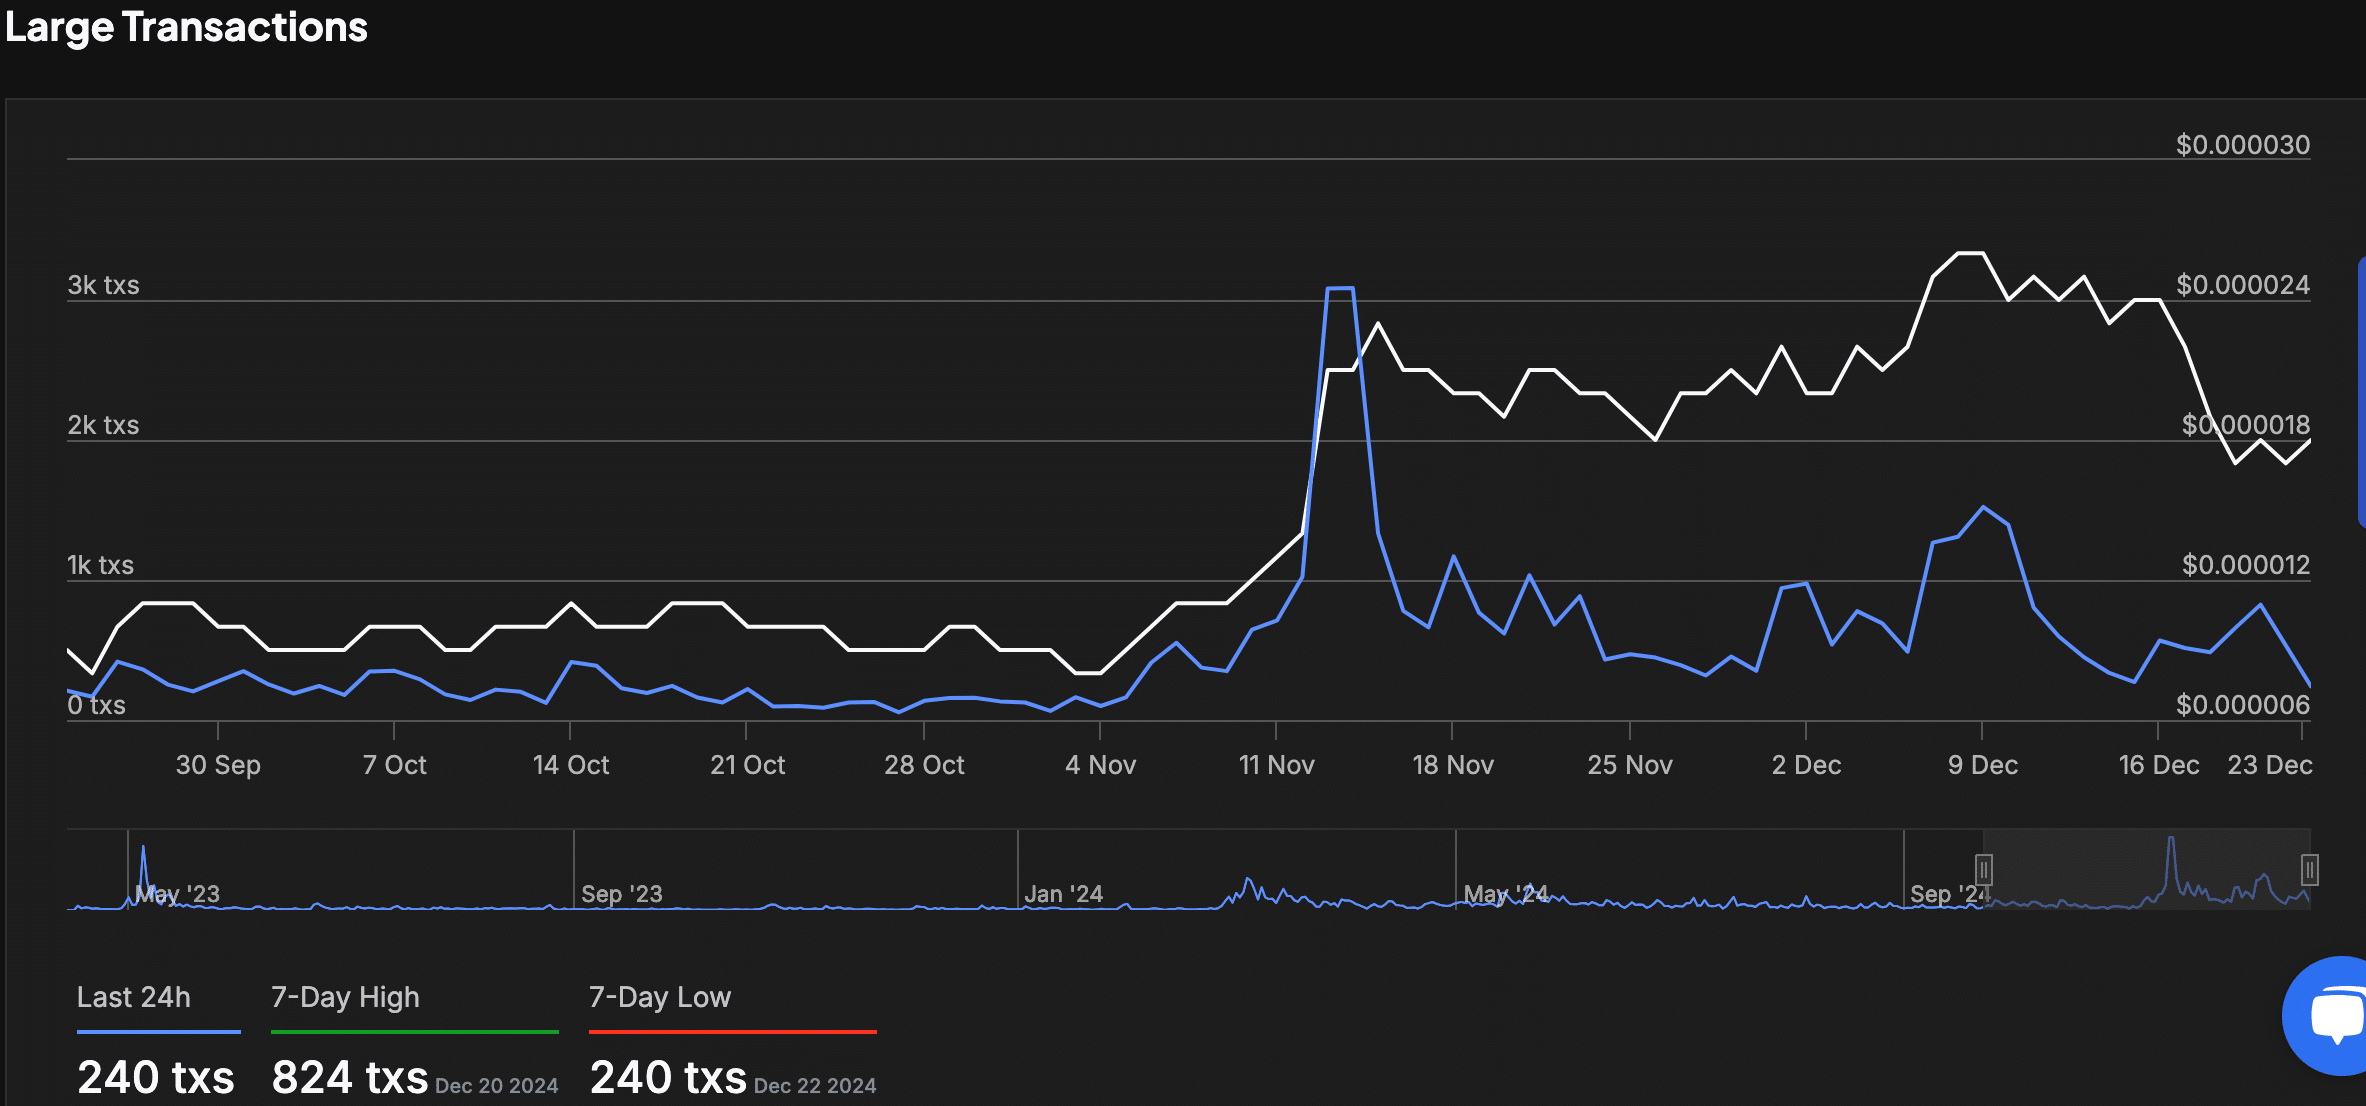
According to data from IntoTheBlock, there’s been a significant drop in large transactions involving the cryptocurrency PEPE. Notably, around mid-November, there was an uptick in these larger transactions as the price peaked at $0.000024, suggesting possible involvement of whales or institutions.
Over the past day, there’s been a significant decrease in transactions, with just 240 large ones being logged – the least we’ve seen in the last seven days.

As the level of activity decreases, it seems to match the stability of the price hovering near $0.00001791, implying that there could be an increase in buying (accumulation) or a drop in trading enthusiasm.
Keeping an eye on extensive transactional data might yield valuable information about possible upcoming spikes or continued declines.
On-chain metrics suggest critical price zones
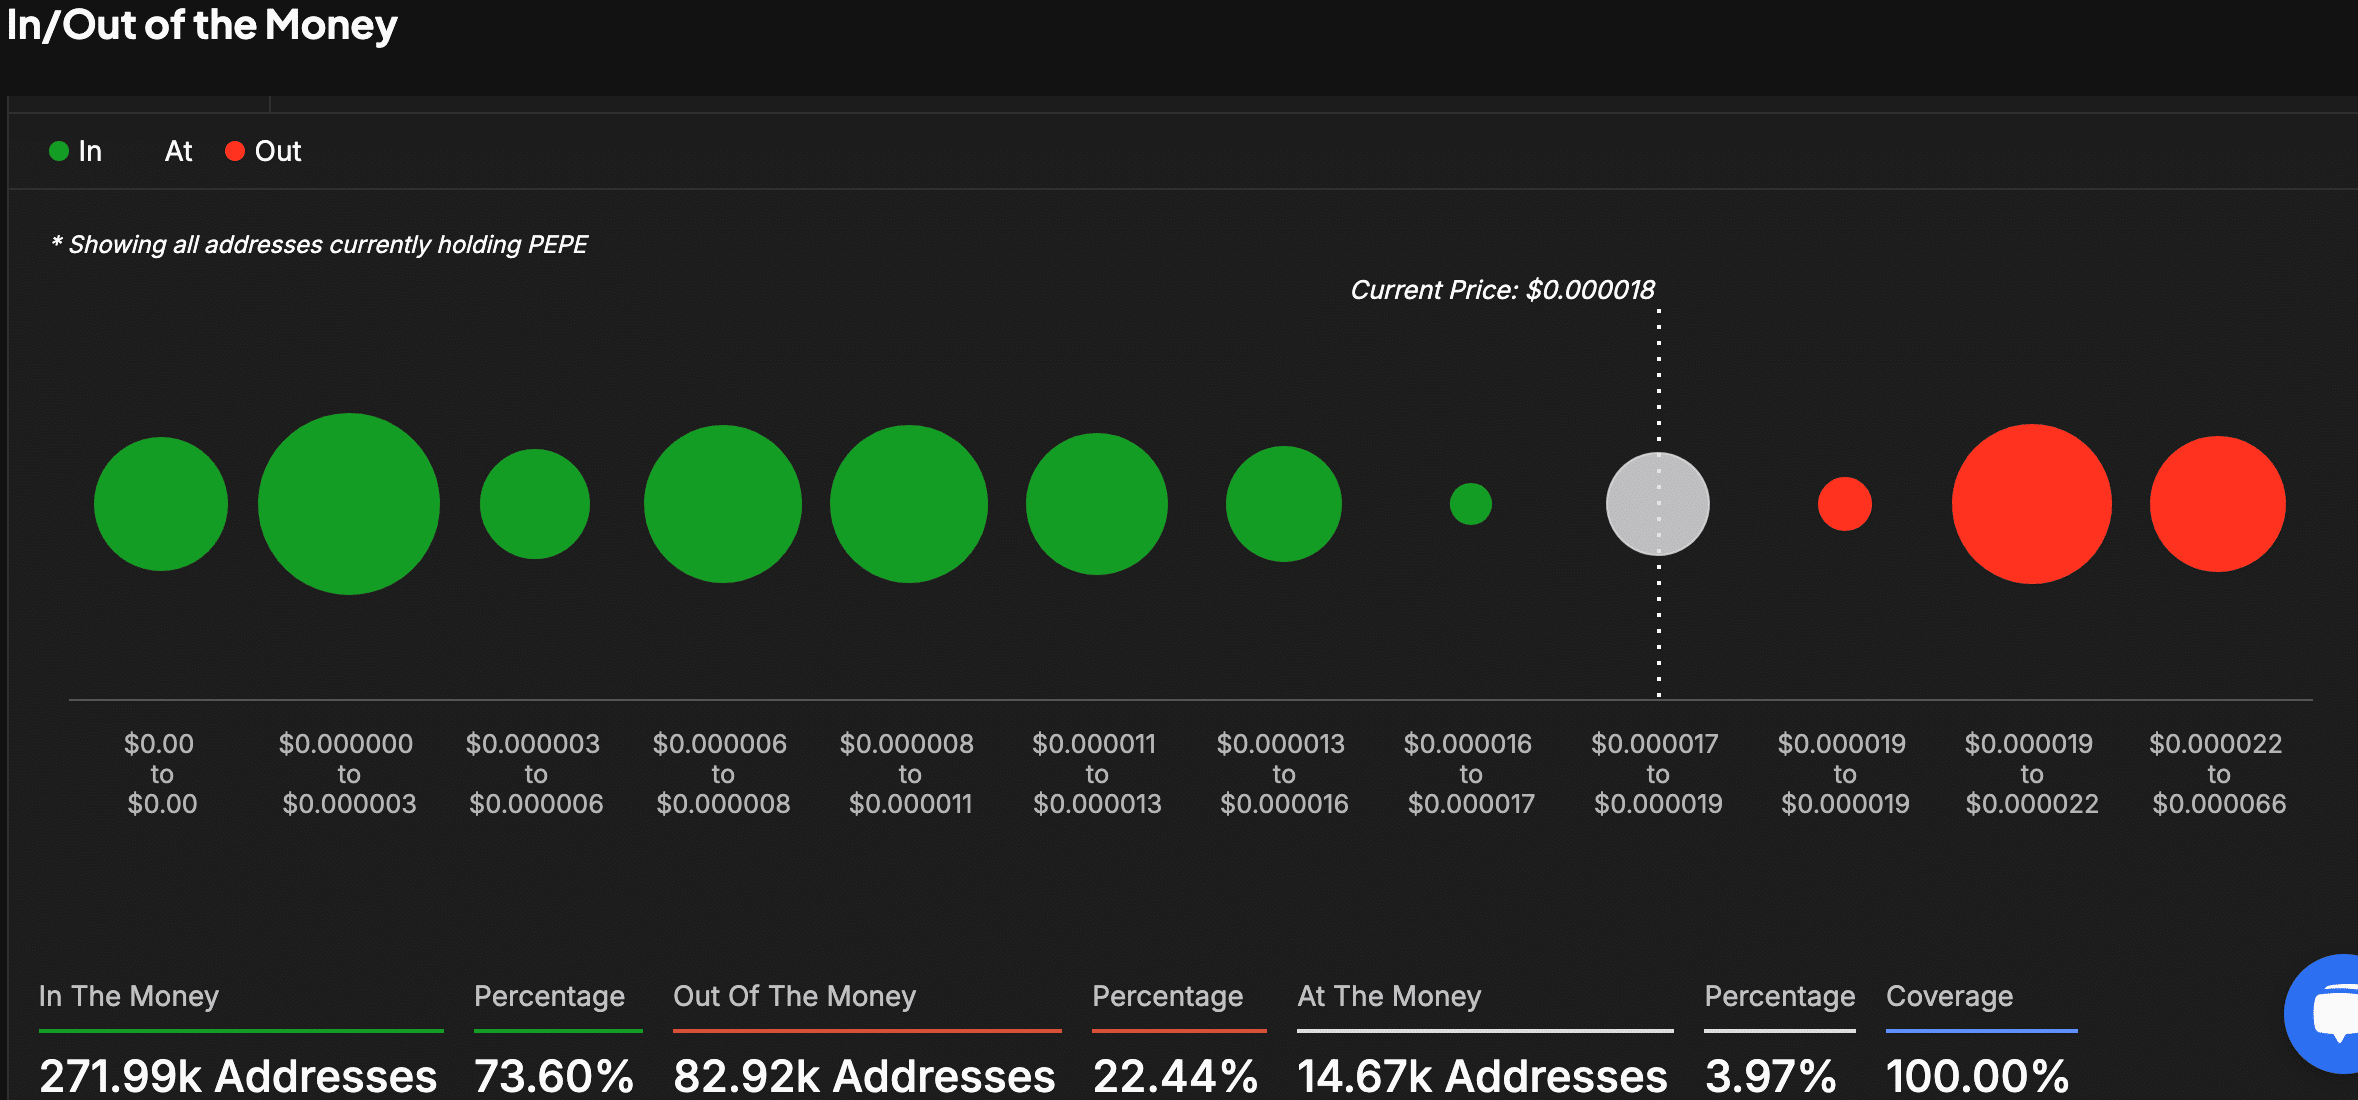
As an analyst, I’ve been delving into on-chain data regarding the PEPE cryptocurrency, and here are my findings: Approximately 73.60% of PEPE wallets are currently in a profitable position. Notably, a significant level of support has been established between $0.000011 and $0.000013, where the majority of holders have amassed their tokens, indicating a strong accumulation point.
On the other hand, it’s estimated that about 22.44% of these wallets are currently unprofitable. A potential selling point could emerge between $0.000019 and $0.000022, as these investors might choose to sell to recover their losses.

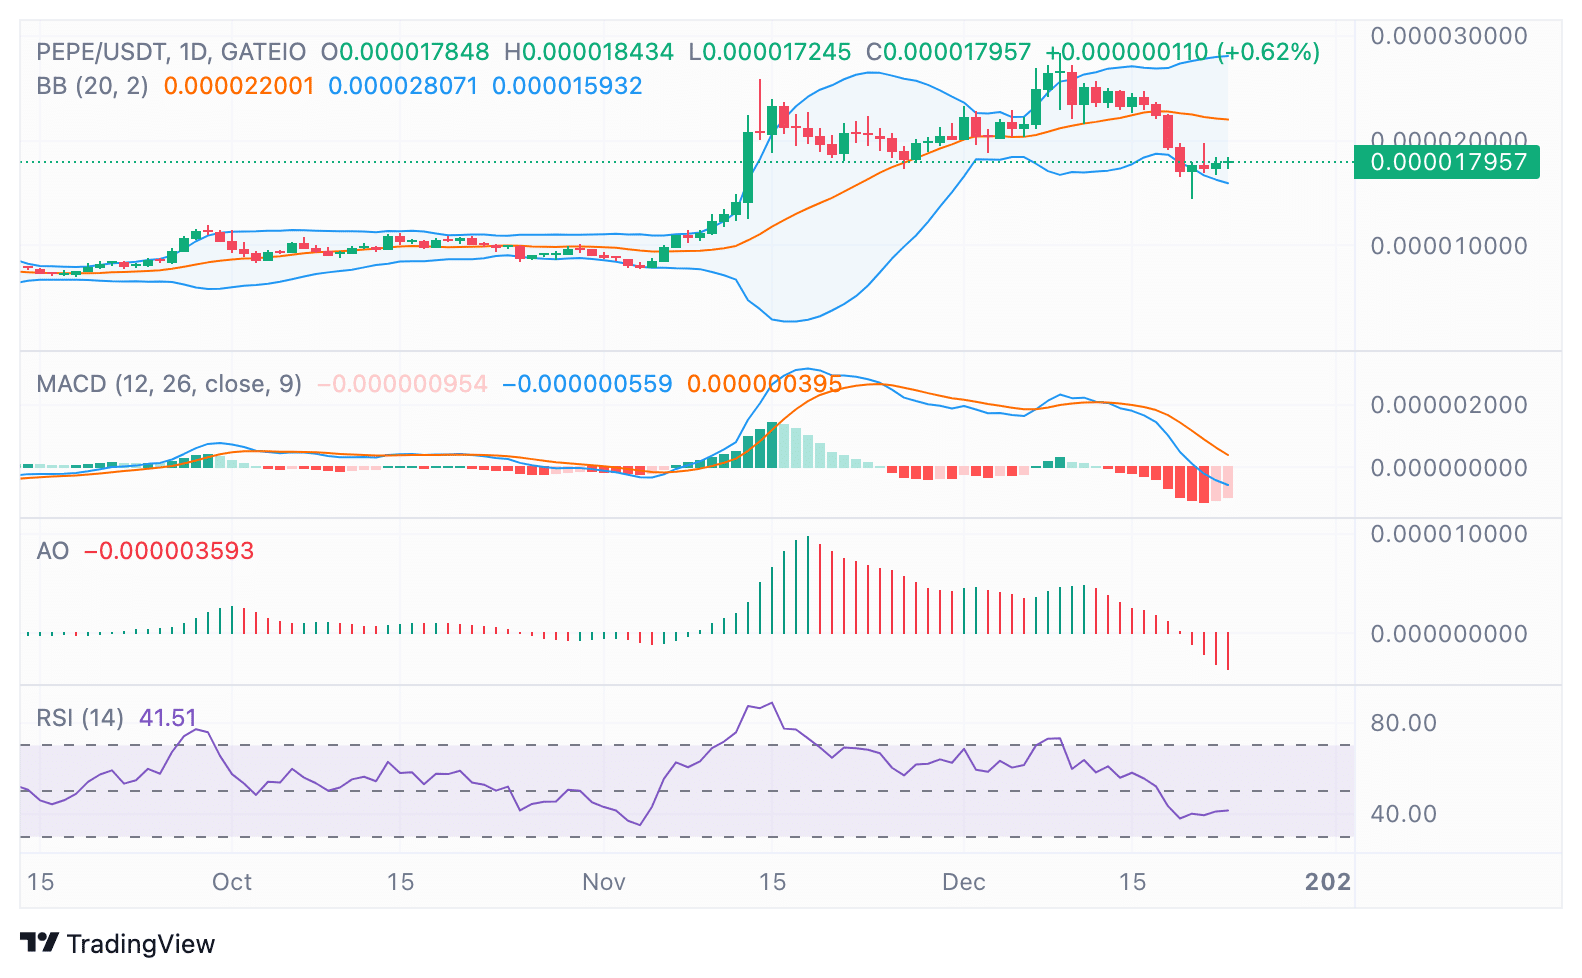
The Bollinger Bands emphasize crucial points of reference. Specifically, the lower band at 0.00001593 functions as a potential support area, while the upper band at 0.00002201 denotes possible resistance.
If we surpass the top boundary, it might trigger an increase in positive movement, whereas falling beneath the bottom boundary could potentially result in more adjustments or decreases in price.
Indicators show weakening bearish momentum
Based on the analysis of momentum indicators, it appears that the downward trend might be losing strength. The MACD (Moving Average Convergence Divergence) histogram is narrowing, which could signal an upcoming bullish cross.
Read Pepe’s [PEPE] Price Prediction 2024–2025
At present, the Relative Strength Index (RSI) stands at 41.51, dipping slightly below the 50 mark which represents neither an overbought nor oversold state. If the RSI rises above 50, it might indicate a resurgence of buying activity.

With the market finding its footing, the convergence of a TD Sequential buy signal, relevant on-chain statistics, and technical pointers hints that the PEPE token could potentially make its next strategic shift.
Read More
2024-12-23 19:04