Amidst the bustling chaos of the crypto world, Solana (SOL) has just witnessed a rare and almost mystical event: a crossover between a key network metric and its price, a phenomenon not seen since the dawn of its first bull run in 2020. Yet, this time, the price lags behind, even as the network exudes a renewed vigor, like a knight in shining armor without a horse. 🐎
Could this be the harbinger of the next great ascent, or merely a cruel jest of the market gods?
Transaction Count Hits 5-Year High, But SOL Price Isn’t Following Yet
Solana’s transaction count has surged past 70 million, a number that would make even the most stoic of analysts raise an eyebrow. Yet, this is not the most intriguing part. According to the chart, the last time the transaction count line crossed above the price line, a multi-year rally ensued, catapulting SOL to new heights. This July 2025, however, the price remains stubbornly sluggish, hovering around $151, as if the market is holding its breath, waiting for the other shoe to drop. 🦵
![]()
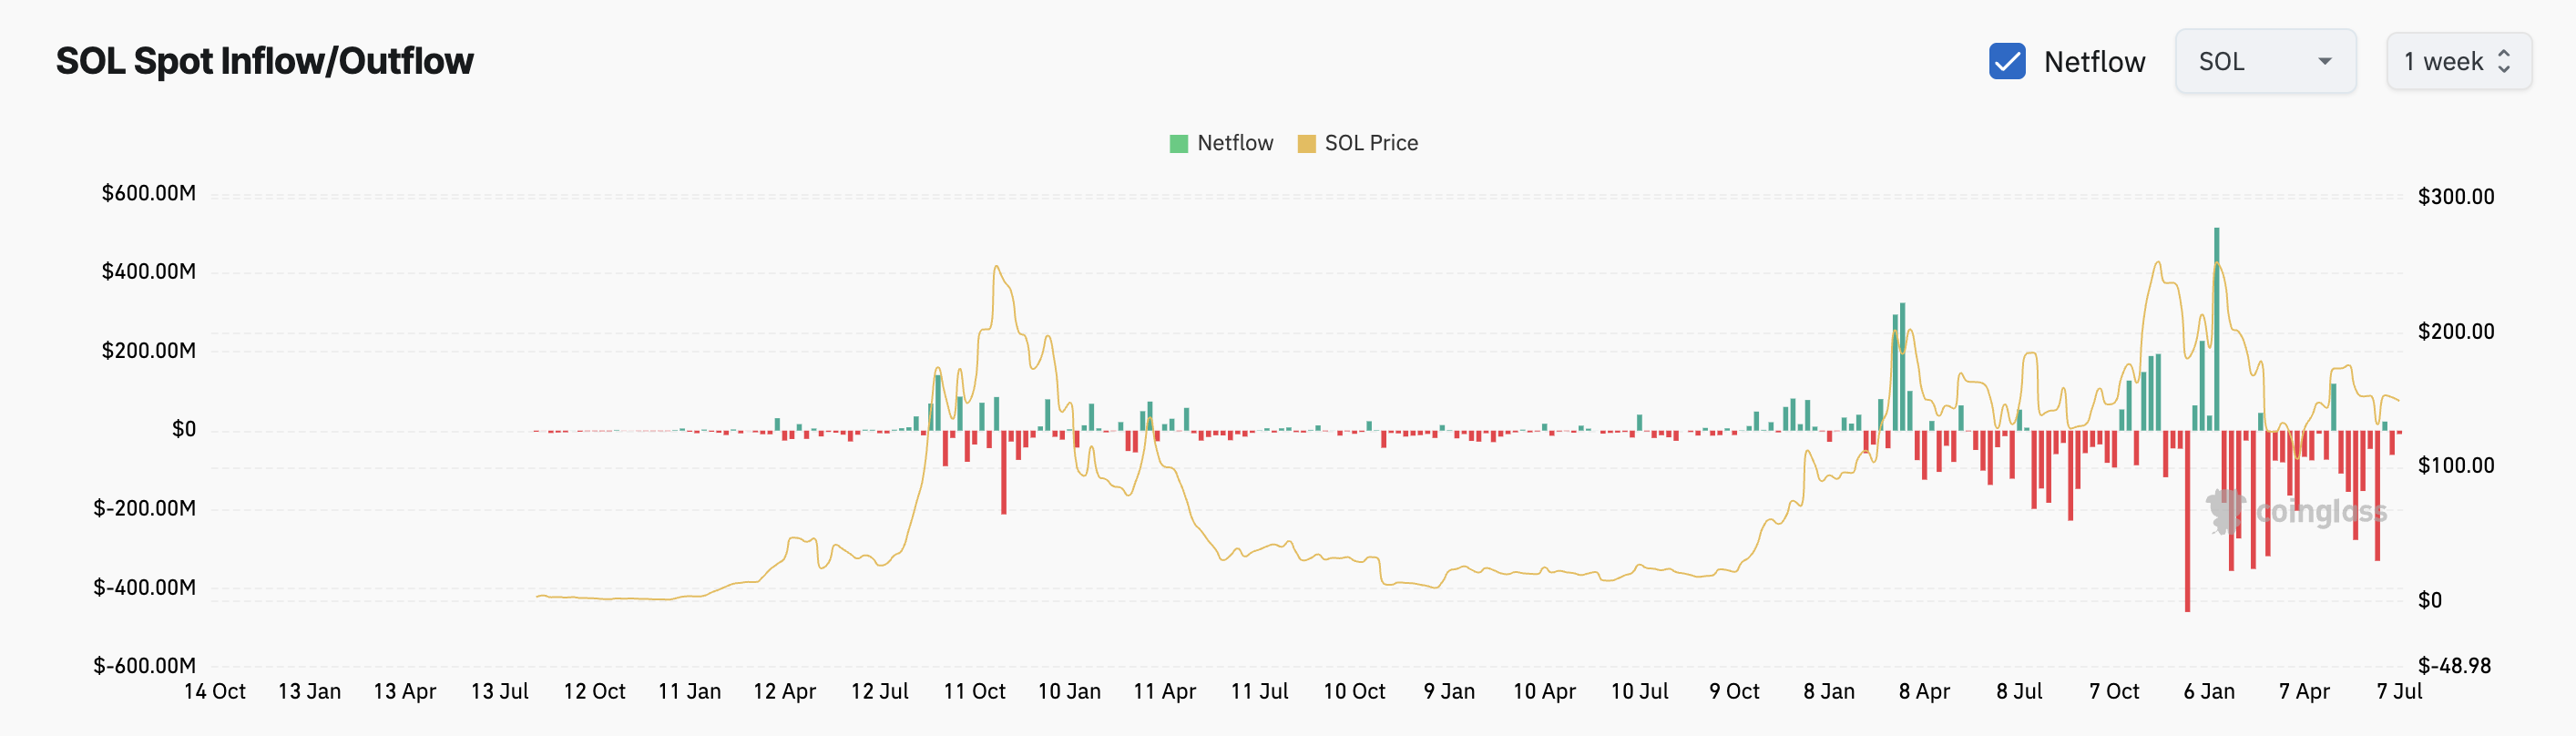
Netflows Tilt Bearish, Despite Exchange Exits
Data from Coinglass reveals that Solana has seen steady outflows through early July, a sign that might point to accumulation, or so the optimists would have us believe. But the outflows have slowed down in recent days, and there’s no spike in inflows to speak of. In short, no one’s dumping SOL, but no one’s rushing to buy either. It’s as if the market is in a state of suspended animation, waiting for a sign, any sign, to break the spell. 🧙♂️
This delicate balance may explain why the SOL price hasn’t broken out yet. Traders seem to be waiting for a stronger signal before taking a side, like a gambler hesitating before placing a bet on a rigged game. 🎲
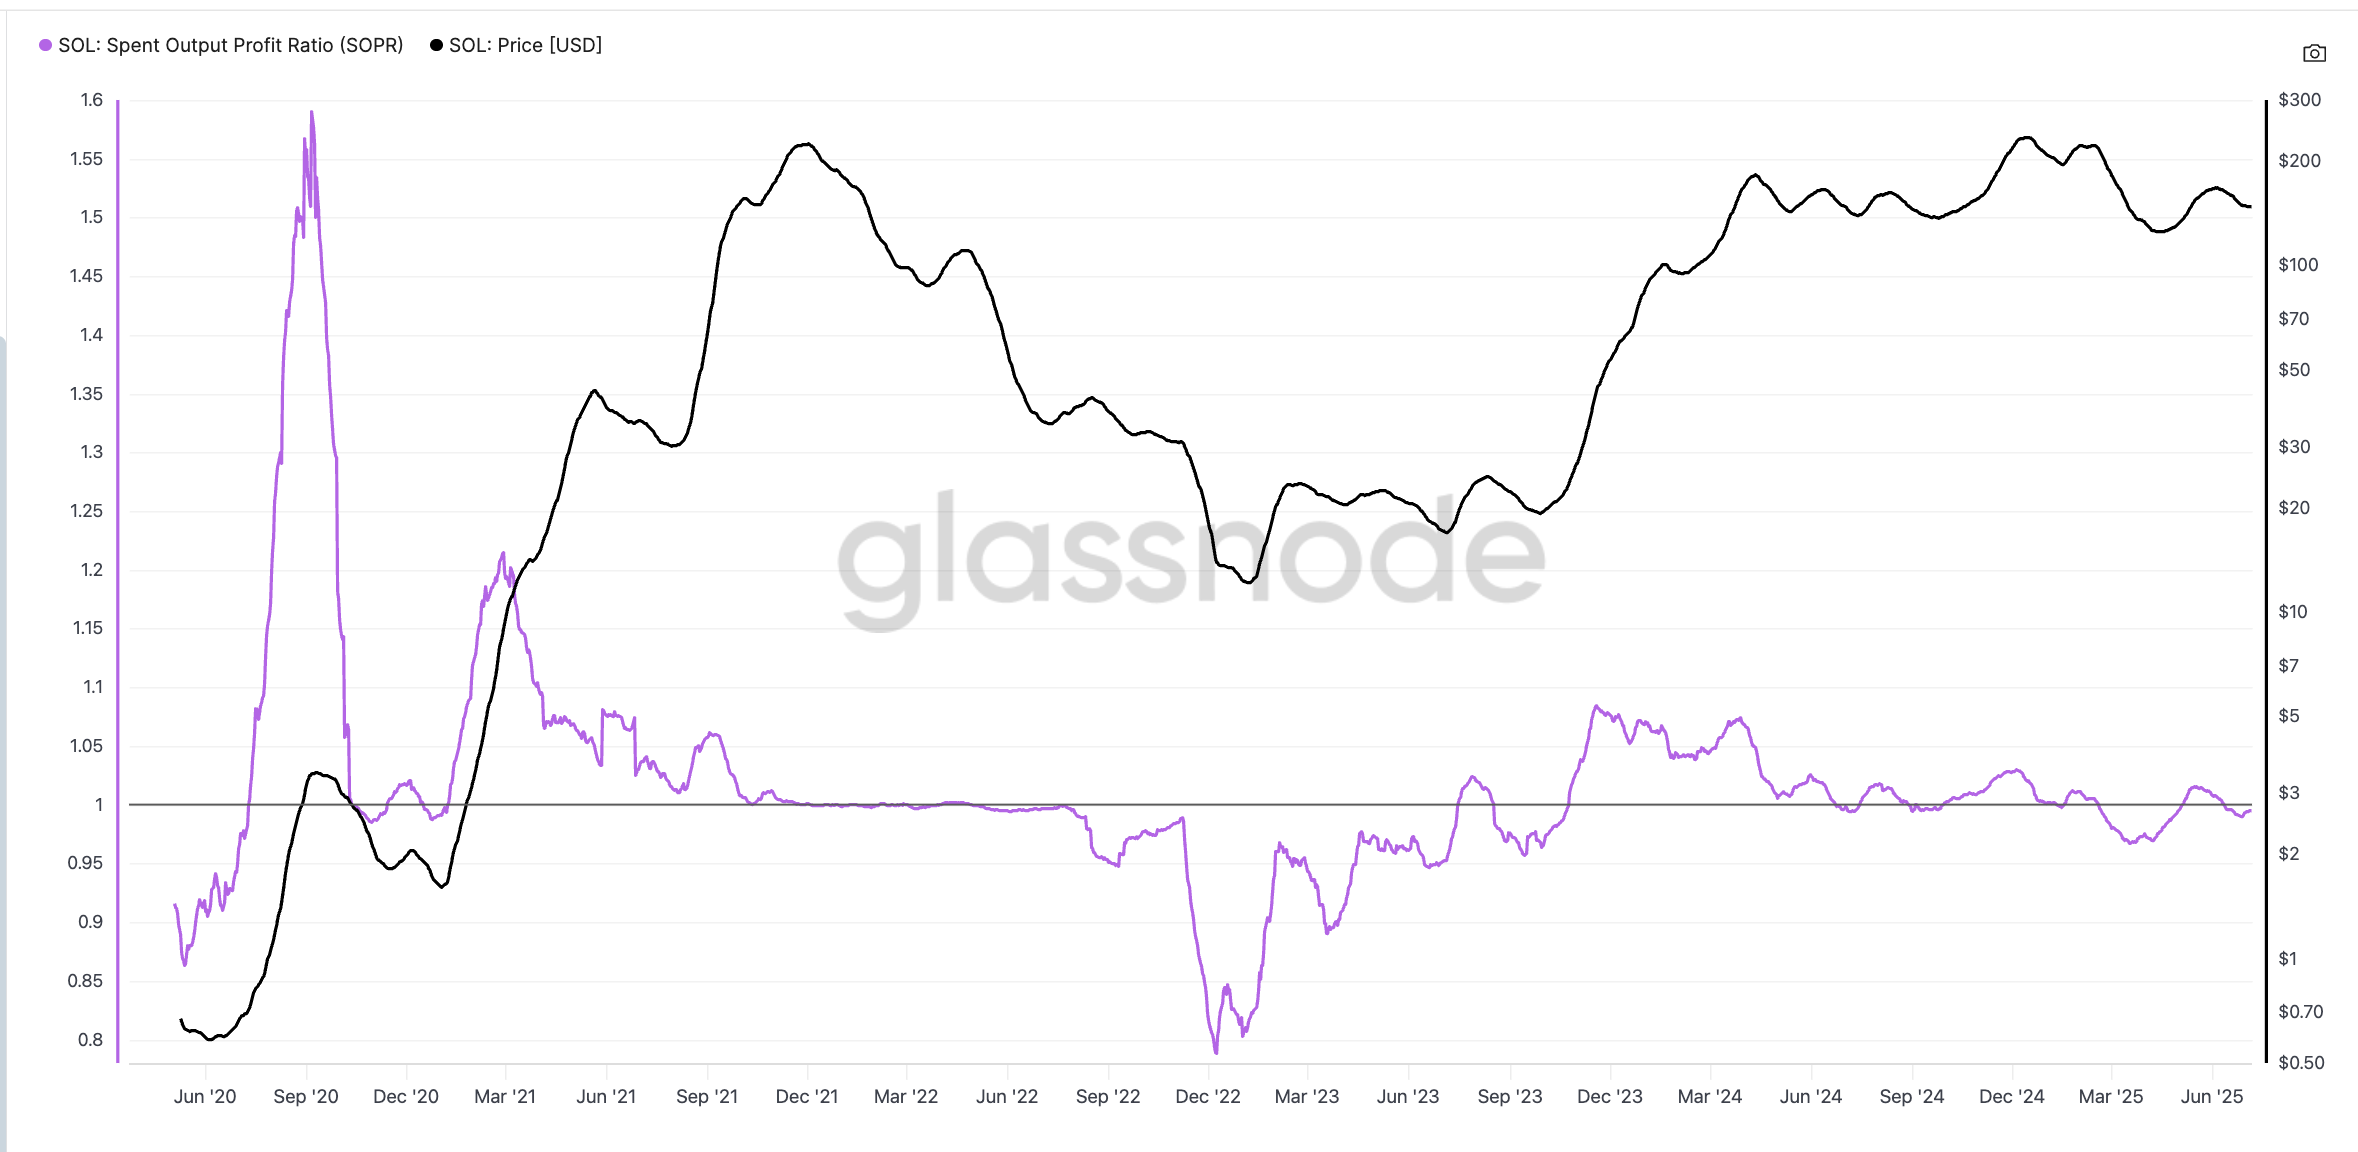
SOPR Flips Below 1; Sign of Panic?
Solana’s Spent Output Profit Ratio (SOPR), a metric that tracks whether coins are being sold at a profit or loss, has hovered just below 1.0 since late June. This typically means holders are selling at a loss or break-even, a common sight during market bottoms. When SOPR drops below 1, it signals capitulation; traders are exiting positions at a loss, like rats abandoning a sinking ship. 🐀
But when SOPR starts to rise again toward 1, it suggests that most panic sellers are gone, and only long-term or break-even holders remain. In this case, SOPR rising from 0.95 back toward 1.0 indicates that forced selling may be cooling off. Combined with the slowing exchange outflows, it suggests Solana is stabilizing, or rather, the bottom for this cycle might be forming, like a phoenix rising from the ashes. 🐦
SOL Price Structure: Falling Wedge Still in Play, But Momentum Lags
The Solana price has been trapped inside a broad falling wedge since early January 2025, a pattern that has held firm despite multiple tests of the upper trendline. That line now sits just under $155, and the price has been hovering close without clearing it, like a prisoner pacing the walls of his cell, unable to break free. 🏗️
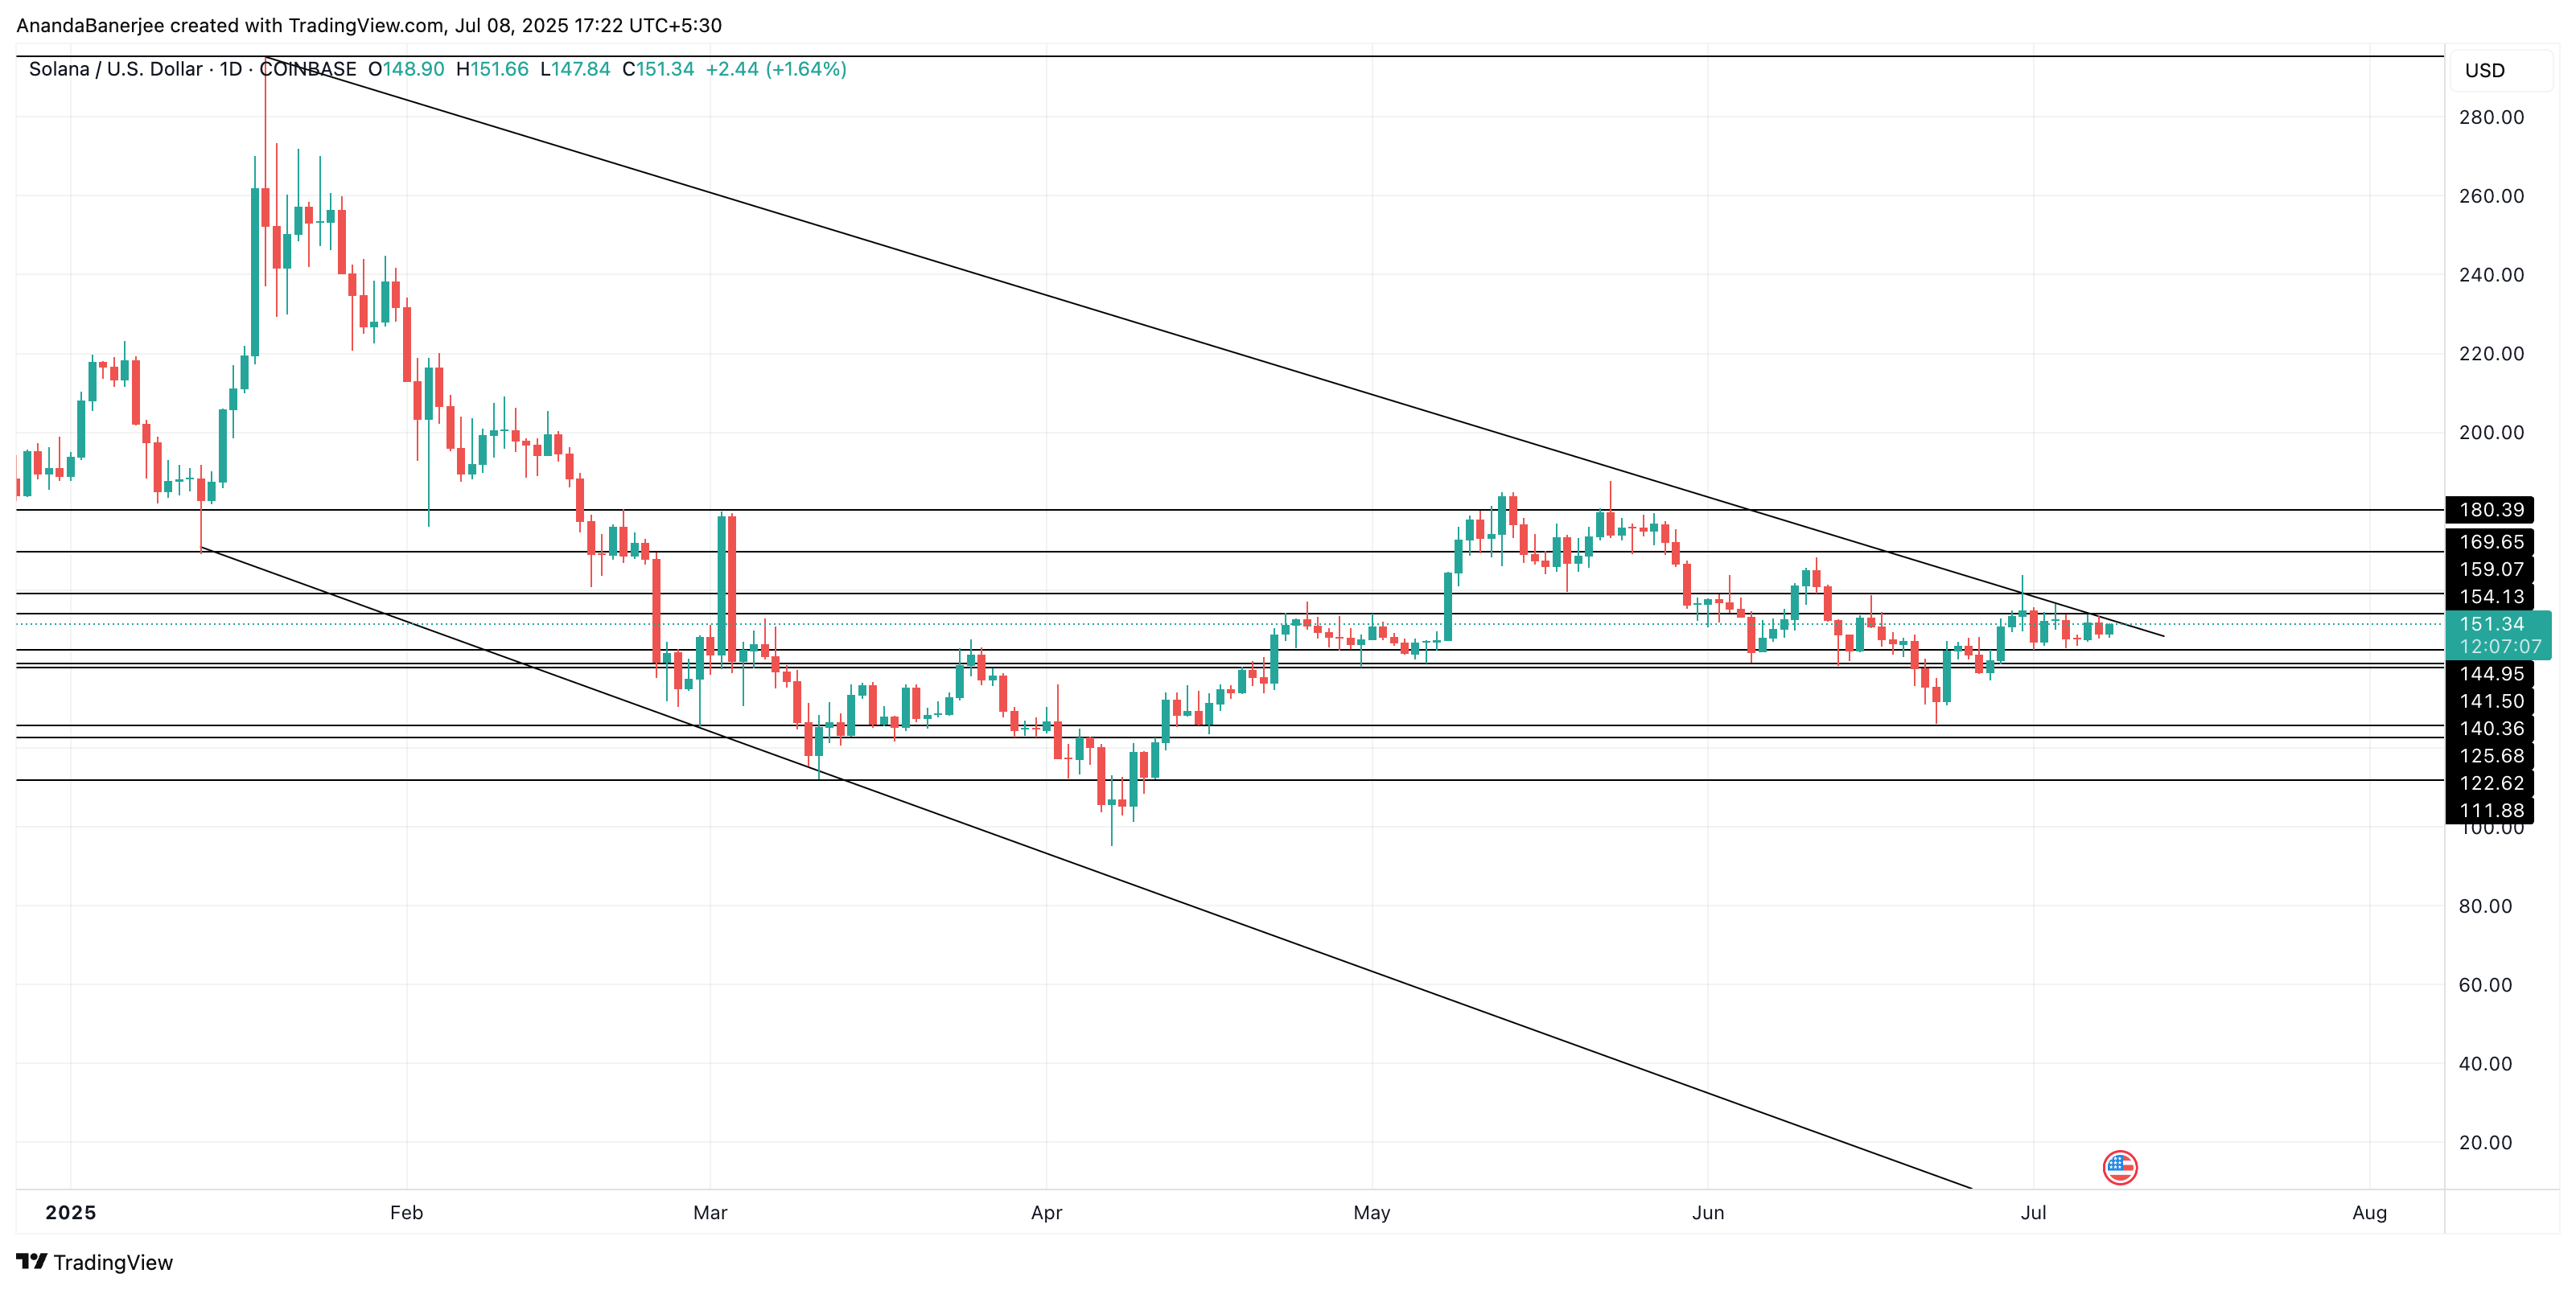
A confirmed move above $155 could shift the momentum, potentially pushing SOL toward $169 and $180, both acting as major resistance zones from prior highs. But if bulls fail to break the wedge, there’s a risk of sliding back into the old sideways band. This support zone between $140 and $125 has trapped the SOL price before, and losing that zone would weaken the entire structure, possibly leading to deeper losses. The wedge is wide enough that even smaller dips won’t break the setup, but if SOL drops below $125, the pattern may no longer hold weight, like a house of cards in a gale. 🏠🌪️
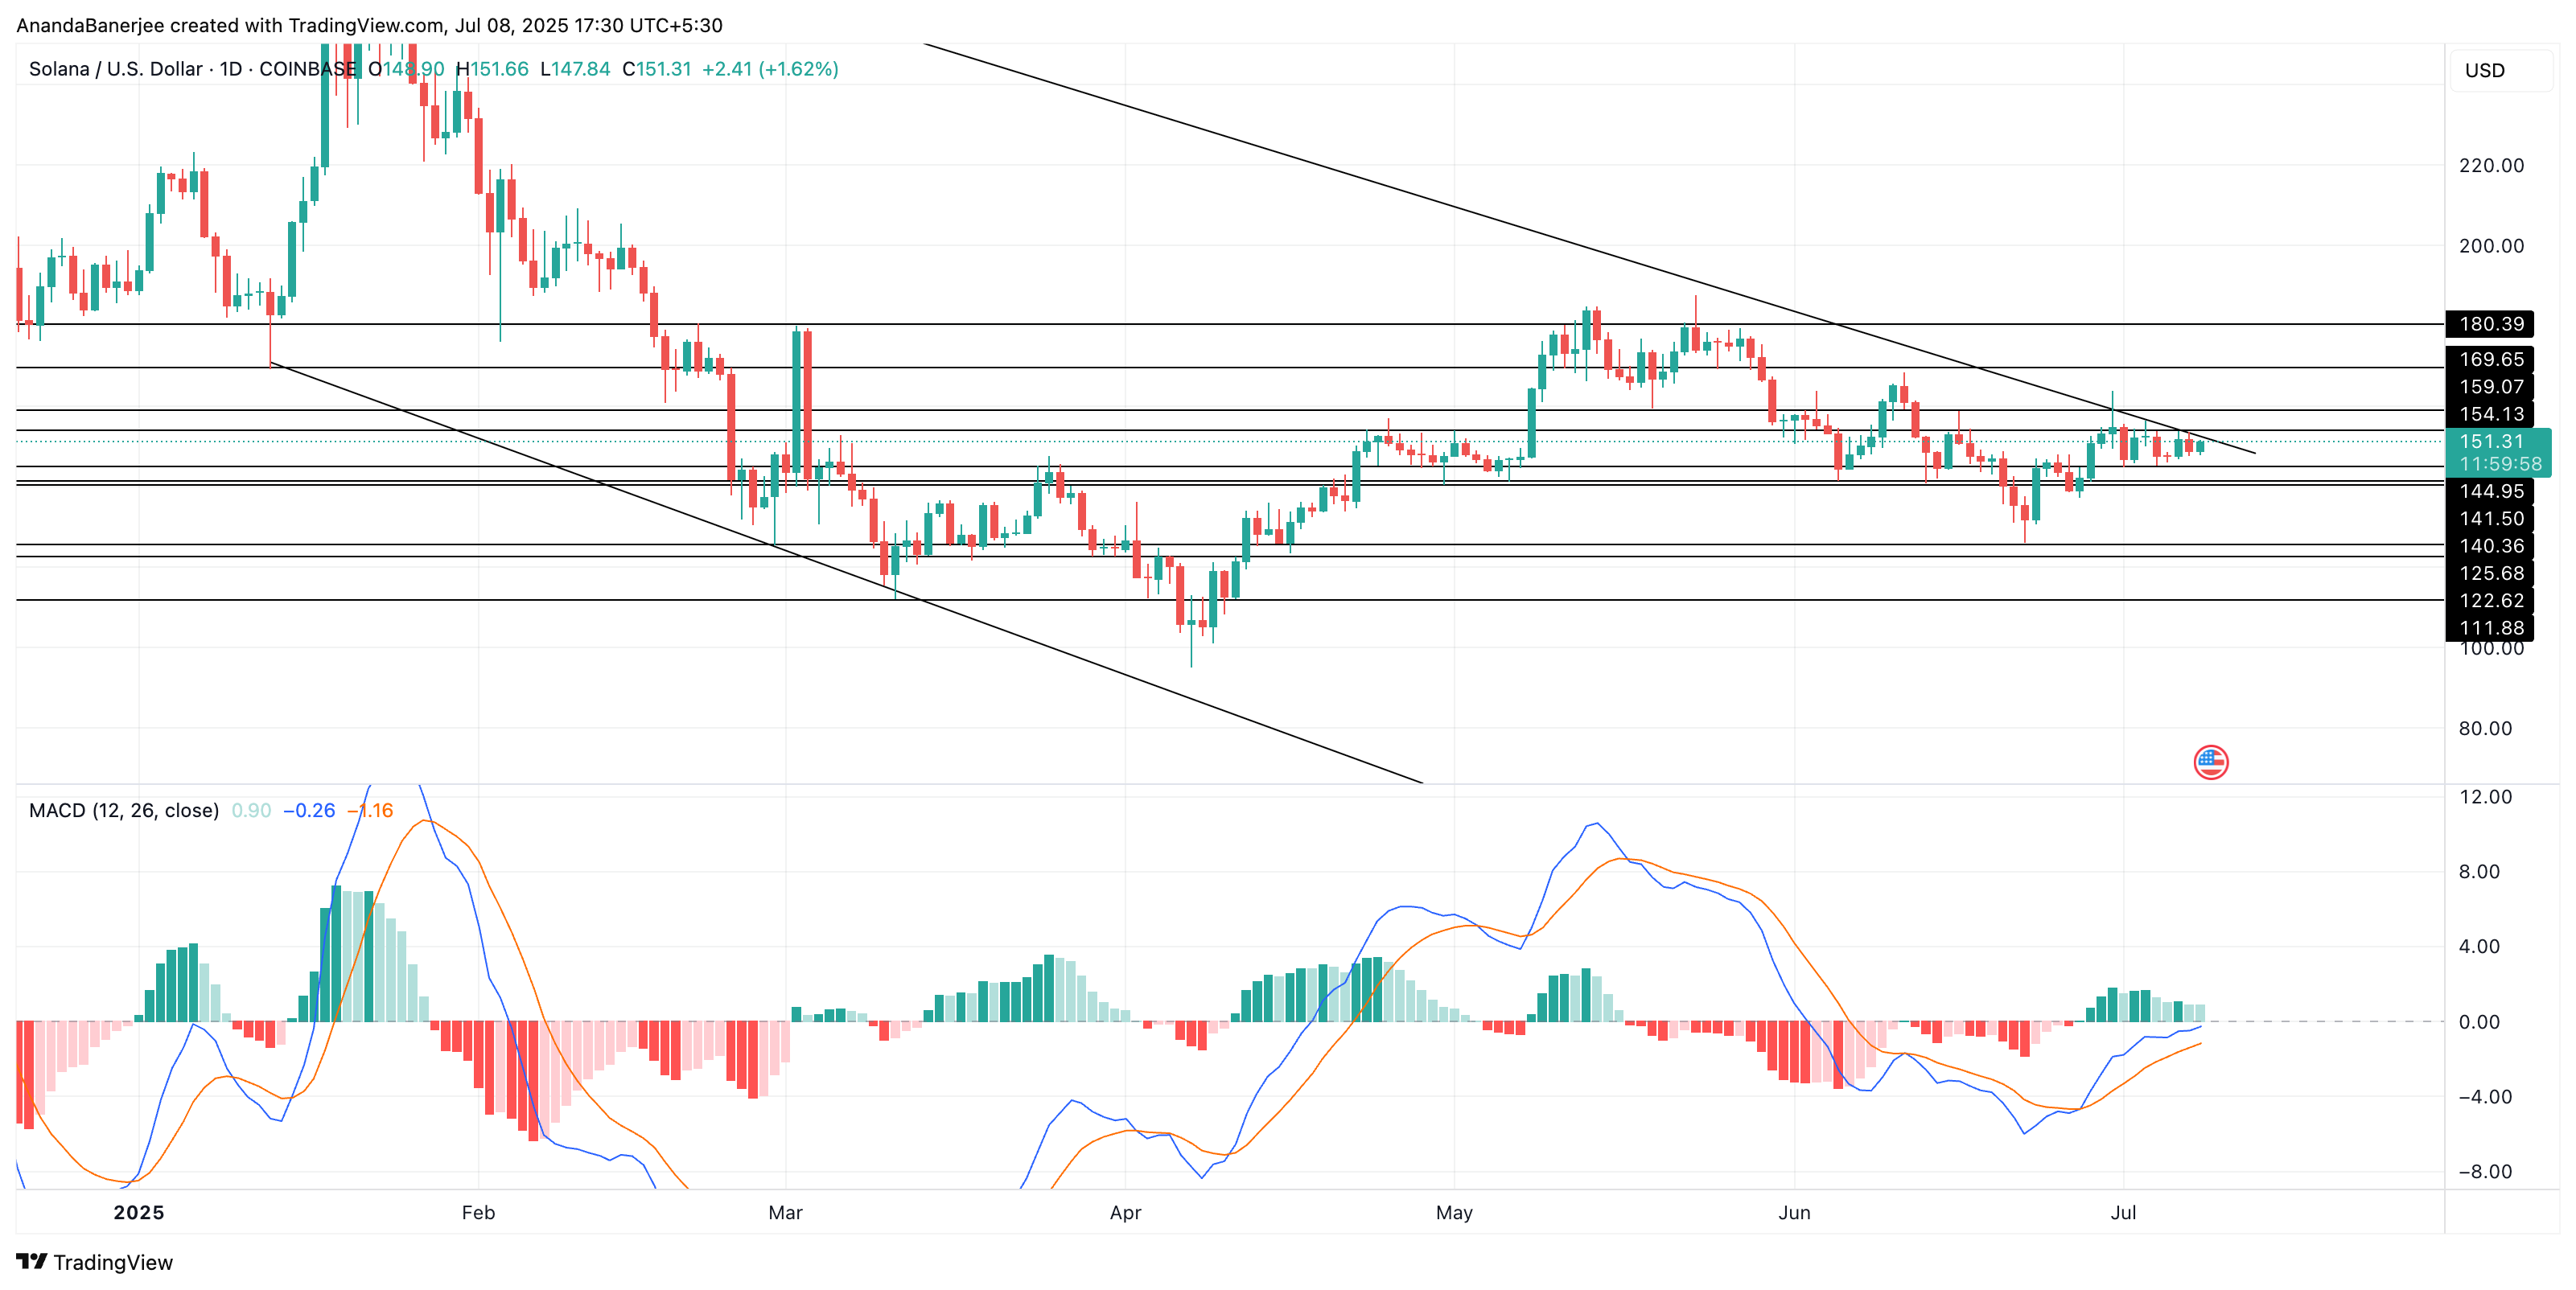
Supporting the pattern is the Moving Average Convergence Divergence (MACD), which is trying to turn bullish. The MACD line (blue) has flipped above the signal line (orange), a classic early momentum indicator. The flip happened near a swing low, confirming bullish strength and a bottoming attempt, also indicated by SOPR. But here’s the catch: the histogram bars, which represent the distance between the two lines, are fading, signaling a weakening upside momentum. It’s as if the market is trying to climb a hill, but the hill keeps moving. 🏔️
MACD is a momentum indicator that helps spot early trend reversals based on two moving lines and a histogram. Solana is trading near $151. Unless it decisively breaks the $155, the falling wedge stays in control, like a prison guard watching over a restless inmate. 🚓🔒
Read More
- When Is Hoppers’ Digital & Streaming Release Date?
- Where Winds Meet: How To Defeat Shadow Puppeteer (Boss Guide)
- Sunday Rose Kidman Urban Describes Mom Nicole Kidman In Rare Interview
- 4 TV Shows To Watch While You Wait for Wednesday Season 3
- The 10 Best Episodes Of Star Trek: Enterprise
- Best Thanos Comics (September 2025)
- PlayStation Plus Game Catalog and Classics Catalog lineup for July 2025 announced
- 10 Movies That Were Secretly Sequels
- These Are the 10 Best Stephen King Movies of All Time
- Did Churchill really commission wartime pornography to motivate troops? The facts behind the salacious rumour
2025-07-08 19:42