-
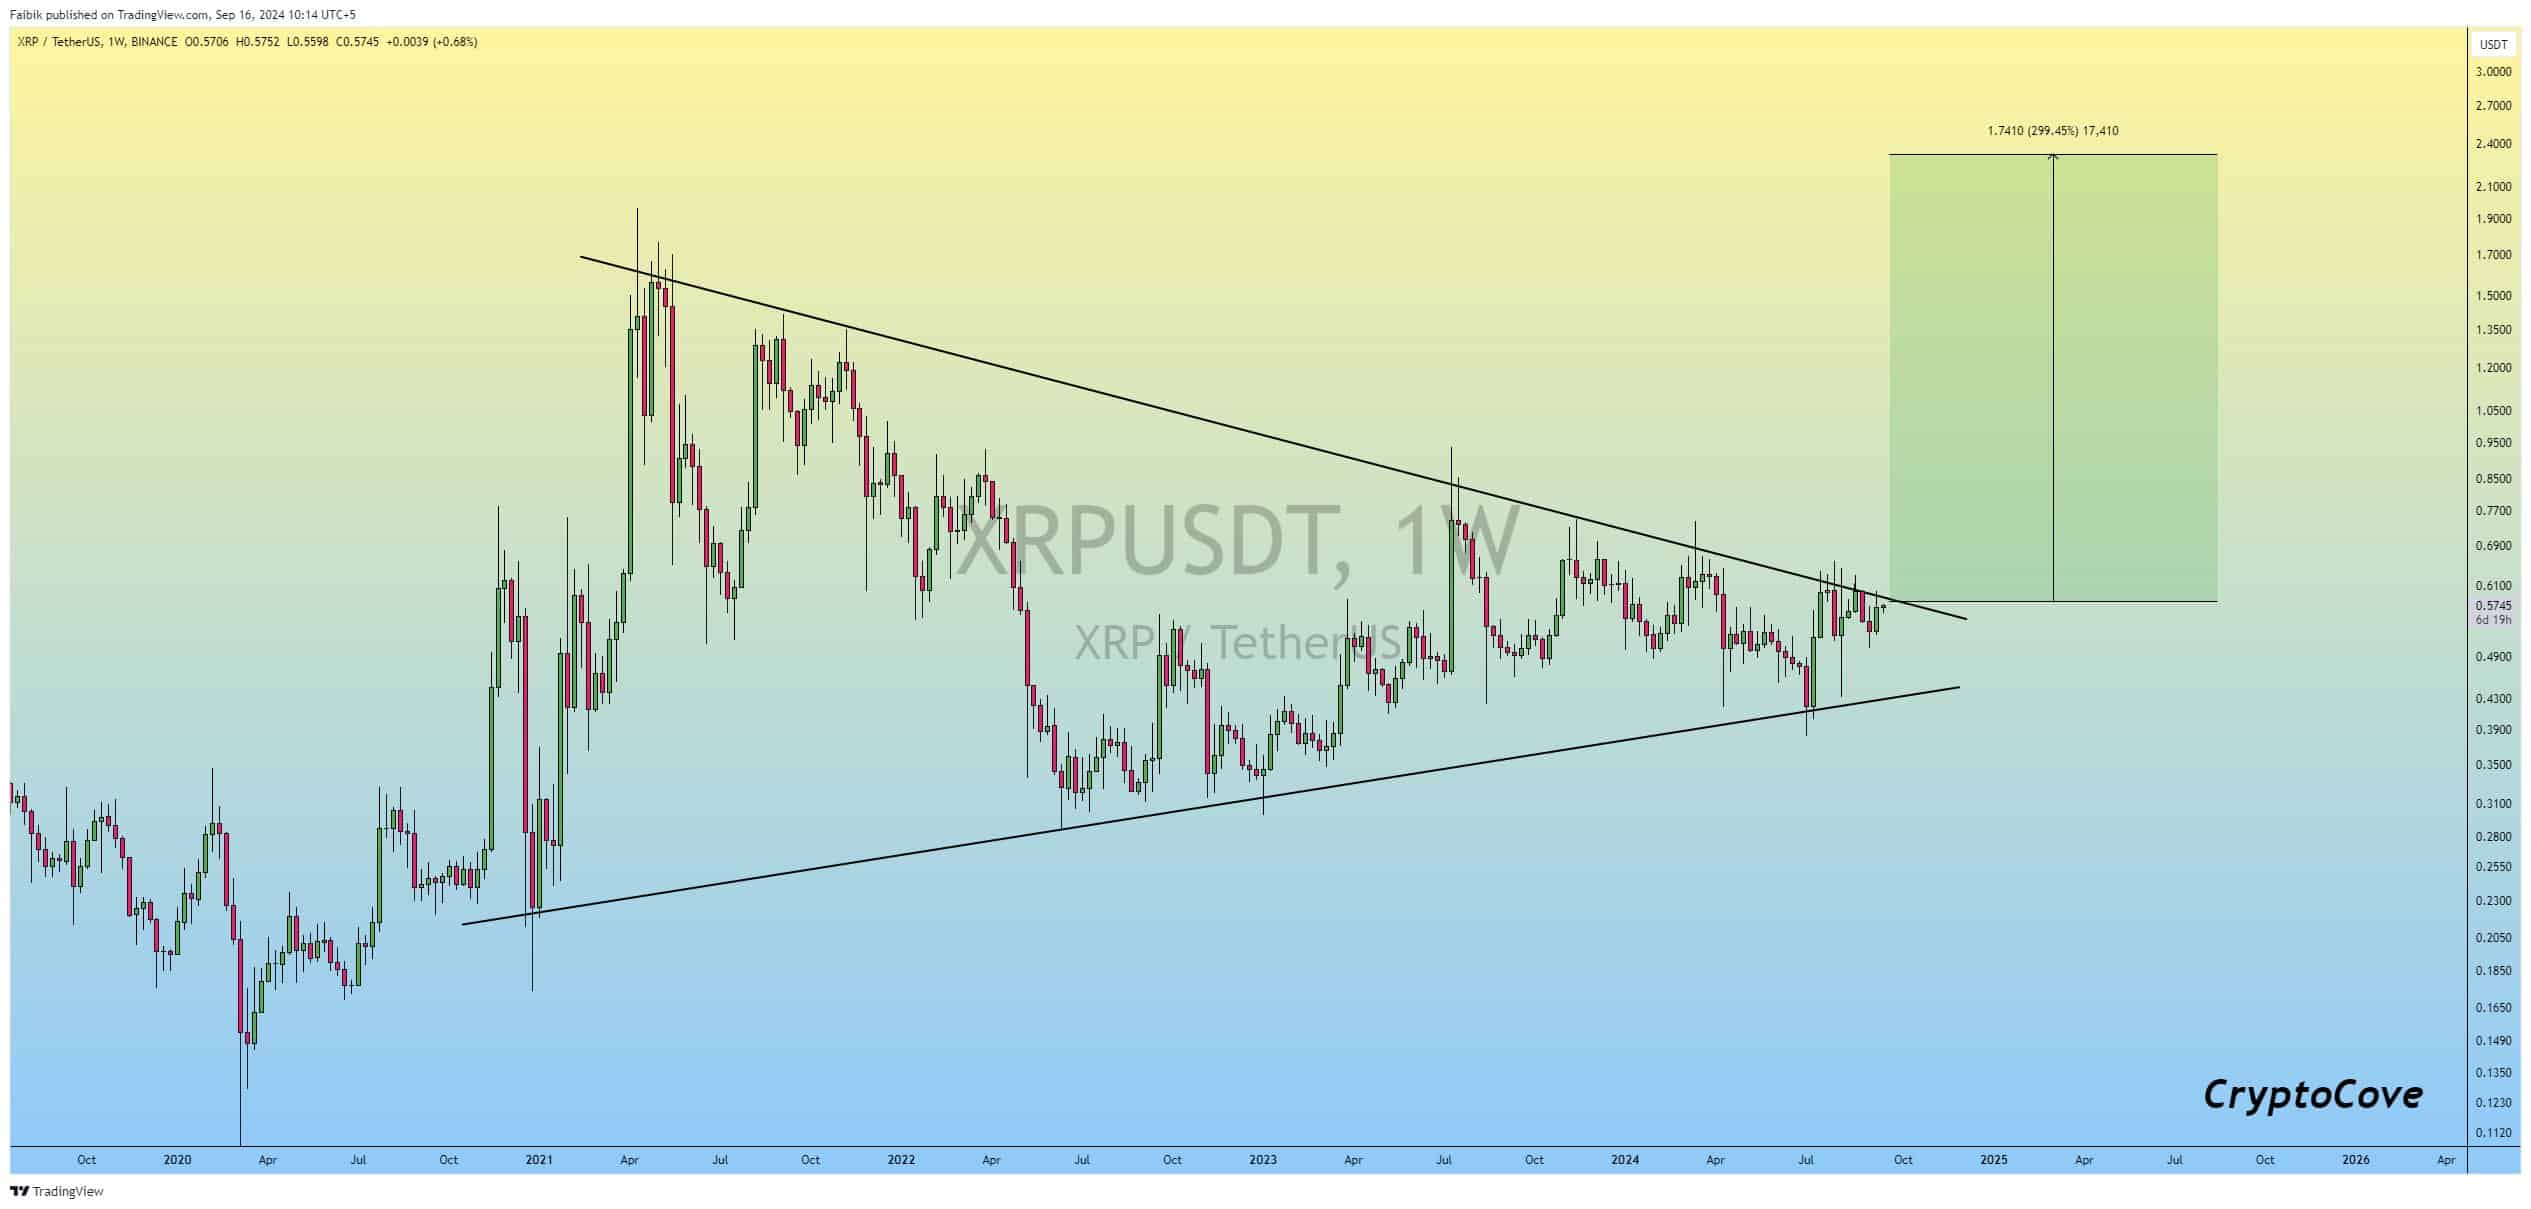
XRP was consolidating within a bullish triangle, suggesting a potential 299% surge to $2.00.
Technical indicators supported a bullish breakout, with strong network activity and volume.
As a seasoned crypto investor with battle-scars from multiple market cycles, I must admit that the current setup for XRP is quite intriguing. The formation of a bullish triangle, backed by strong network activity and volume, has caught my attention. If history has taught me anything, it’s that technical patterns like this can often lead to significant price movements.
At the moment of writing, I’m seeing promising signs that Ripple (XRP) could be on the verge of a significant upward breakout. This optimism stems from the development of a robust bullish triangle pattern, suggesting potential positive price action.
In simpler terms, this technical configuration often indicates a substantial change in price, as many traders and investors anticipate an upcoming surge.
Based on the alignment of crucial technical indicators and on-chain statistics, is it possible that Ripple (XRP) is about to experience a powerful surge?
Could the bullish triangle lead to a 299% surge?
The price of XRP is currently trapped in a narrowing triangular formation, with a ceiling at approximately $0.61 and a floor near $0.55. As the price gets squeezed, there’s an increasing likelihood of a breakthrough occurring.
According to analyst Captain Faibik, who now posts on X (previously Twitter), if XRP manages to break past its current resistance level, it could potentially experience a significant jump of up to 299%, potentially propelling its price towards the $2.00 mark.
Currently priced at $0.572, the next step for XRP is crucial. If it successfully breaches the current resistance, it might lead to a robust price surge, providing traders with an attractive risk vs reward scenario.

On-chain data
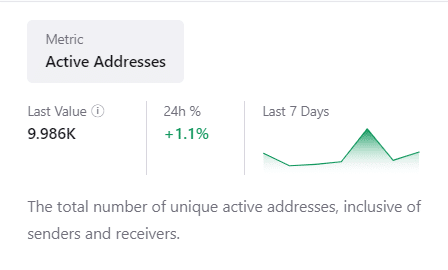
24-hour activity on the XRP blockchain indicates a strengthening trend, with an increase of approximately 1.1% in the number of active addresses, now totaling 9,986.
The uptick in activity suggests growing interaction with the XRP network, potentially indicating that investors are gearing up for a possible price shift.

Moreover, the 24-hour trading volume of XRP amounted to approximately $1.03 billion. This represented a volume-to-market cap ratio of 3.01%, signifying robust market interest. Such high liquidity is an essential indicator, suggesting a possible upward trend or breakout.
The liquidation data also supported the bullish case, with $973.39K in long positions opened across major exchanges like Binance, compared to just $72.34K in shorts.
This imbalance signaled growing market confidence in XRP’s potential to rise.

Are technical indicators aligning?
Technical indicators are in place to support a potential breakout.
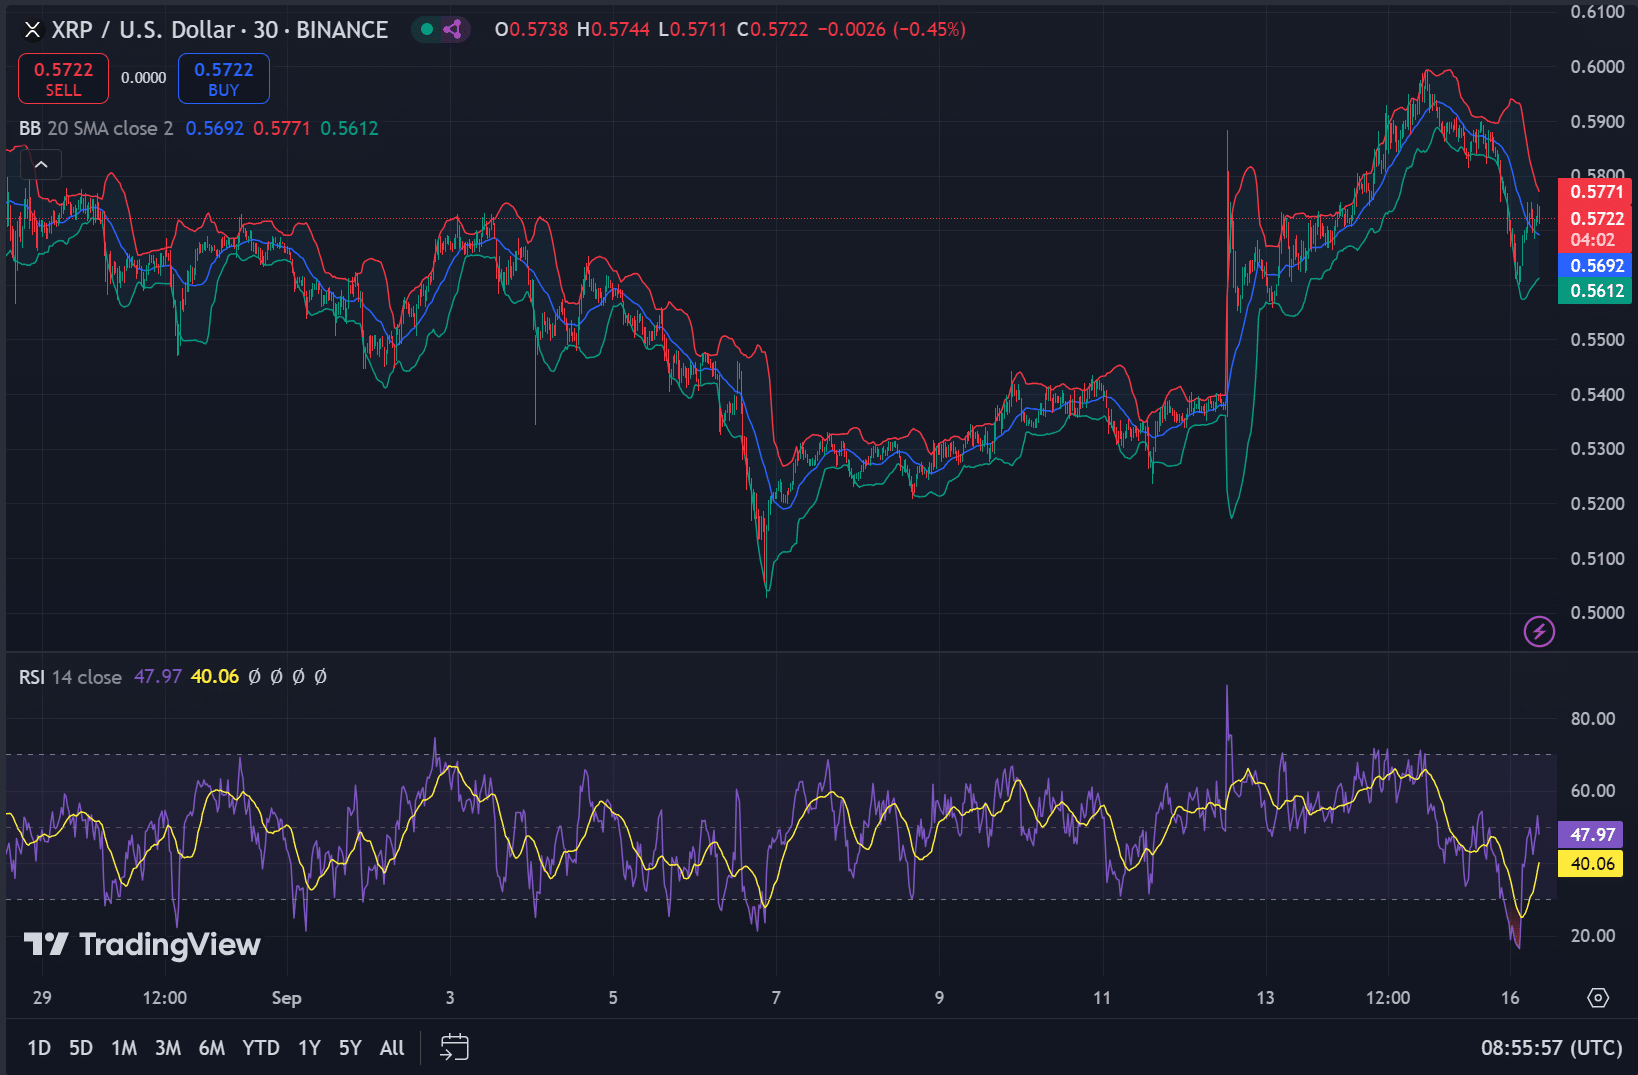
At the moment I’m observing, the Relative Strength Index (RSI) stands at 47.97, suggesting a neutral stance offering potential for further upswing. This level doesn’t indicate signs of overbuying, providing a relatively safe ground to monitor the market’s progression.
On the 30-minute chart, the Bollinger Bands indicated narrowing volatility, suggesting that XRP might be gearing up for a significant price shift.

Read XRP’s Price Prediction 2024–2025
Will XRP break out soon?
As a researcher examining the cryptocurrency market, I find myself intrigued by the developing bullish triangle pattern in XRP. Additionally, on-chain indicators suggest an uptick in activity, which has piqued my interest. If XRP successfully breaches the critical resistance level at $0.61, we might witness a significant price increase that could potentially propel the value up to 299%, reaching approximately $2.00.
In the upcoming days, it’s advisable for traders to keep a close eye on trading volumes and significant technical thresholds to substantiate any anticipated price movement.
Read More
- The Bachelor’s Ben Higgins and Jessica Clarke Welcome Baby Girl with Heartfelt Instagram Post
- WCT PREDICTION. WCT cryptocurrency
- Royal Baby Alert: Princess Beatrice Welcomes Second Child!
- PI PREDICTION. PI cryptocurrency
- Sea of Thieves Season 15: New Megalodons, Wildlife, and More!
- SOL PREDICTION. SOL cryptocurrency
- Playmates’ Power Rangers Toyline Teaser Reveals First Lineup of Figures
- Superman Rumor Teases “Major Casting Surprise” (Is It Tom Cruise or Chris Pratt?)
- Buckle Up! Metaplanet’s Bitcoin Adventure Hits New Heights 🎢💰
- Owen Cooper Lands Major Role in Wuthering Heights – What’s Next for the Young Star?
2024-09-17 02:16