So, here we are on May 26, 2025, and guess what? XRP is just hanging out at $2.34, like it’s waiting for a bus that never comes. With a market cap of $137 billion (yes, billion with a ‘B’), and a 24-hour trading volume of $1.81 billion, it’s like the cool kid in school who’s just too good to care. The price danced between $2.28 and $2.35, which is basically code for “investors are biting their nails in suspense.”
XRP
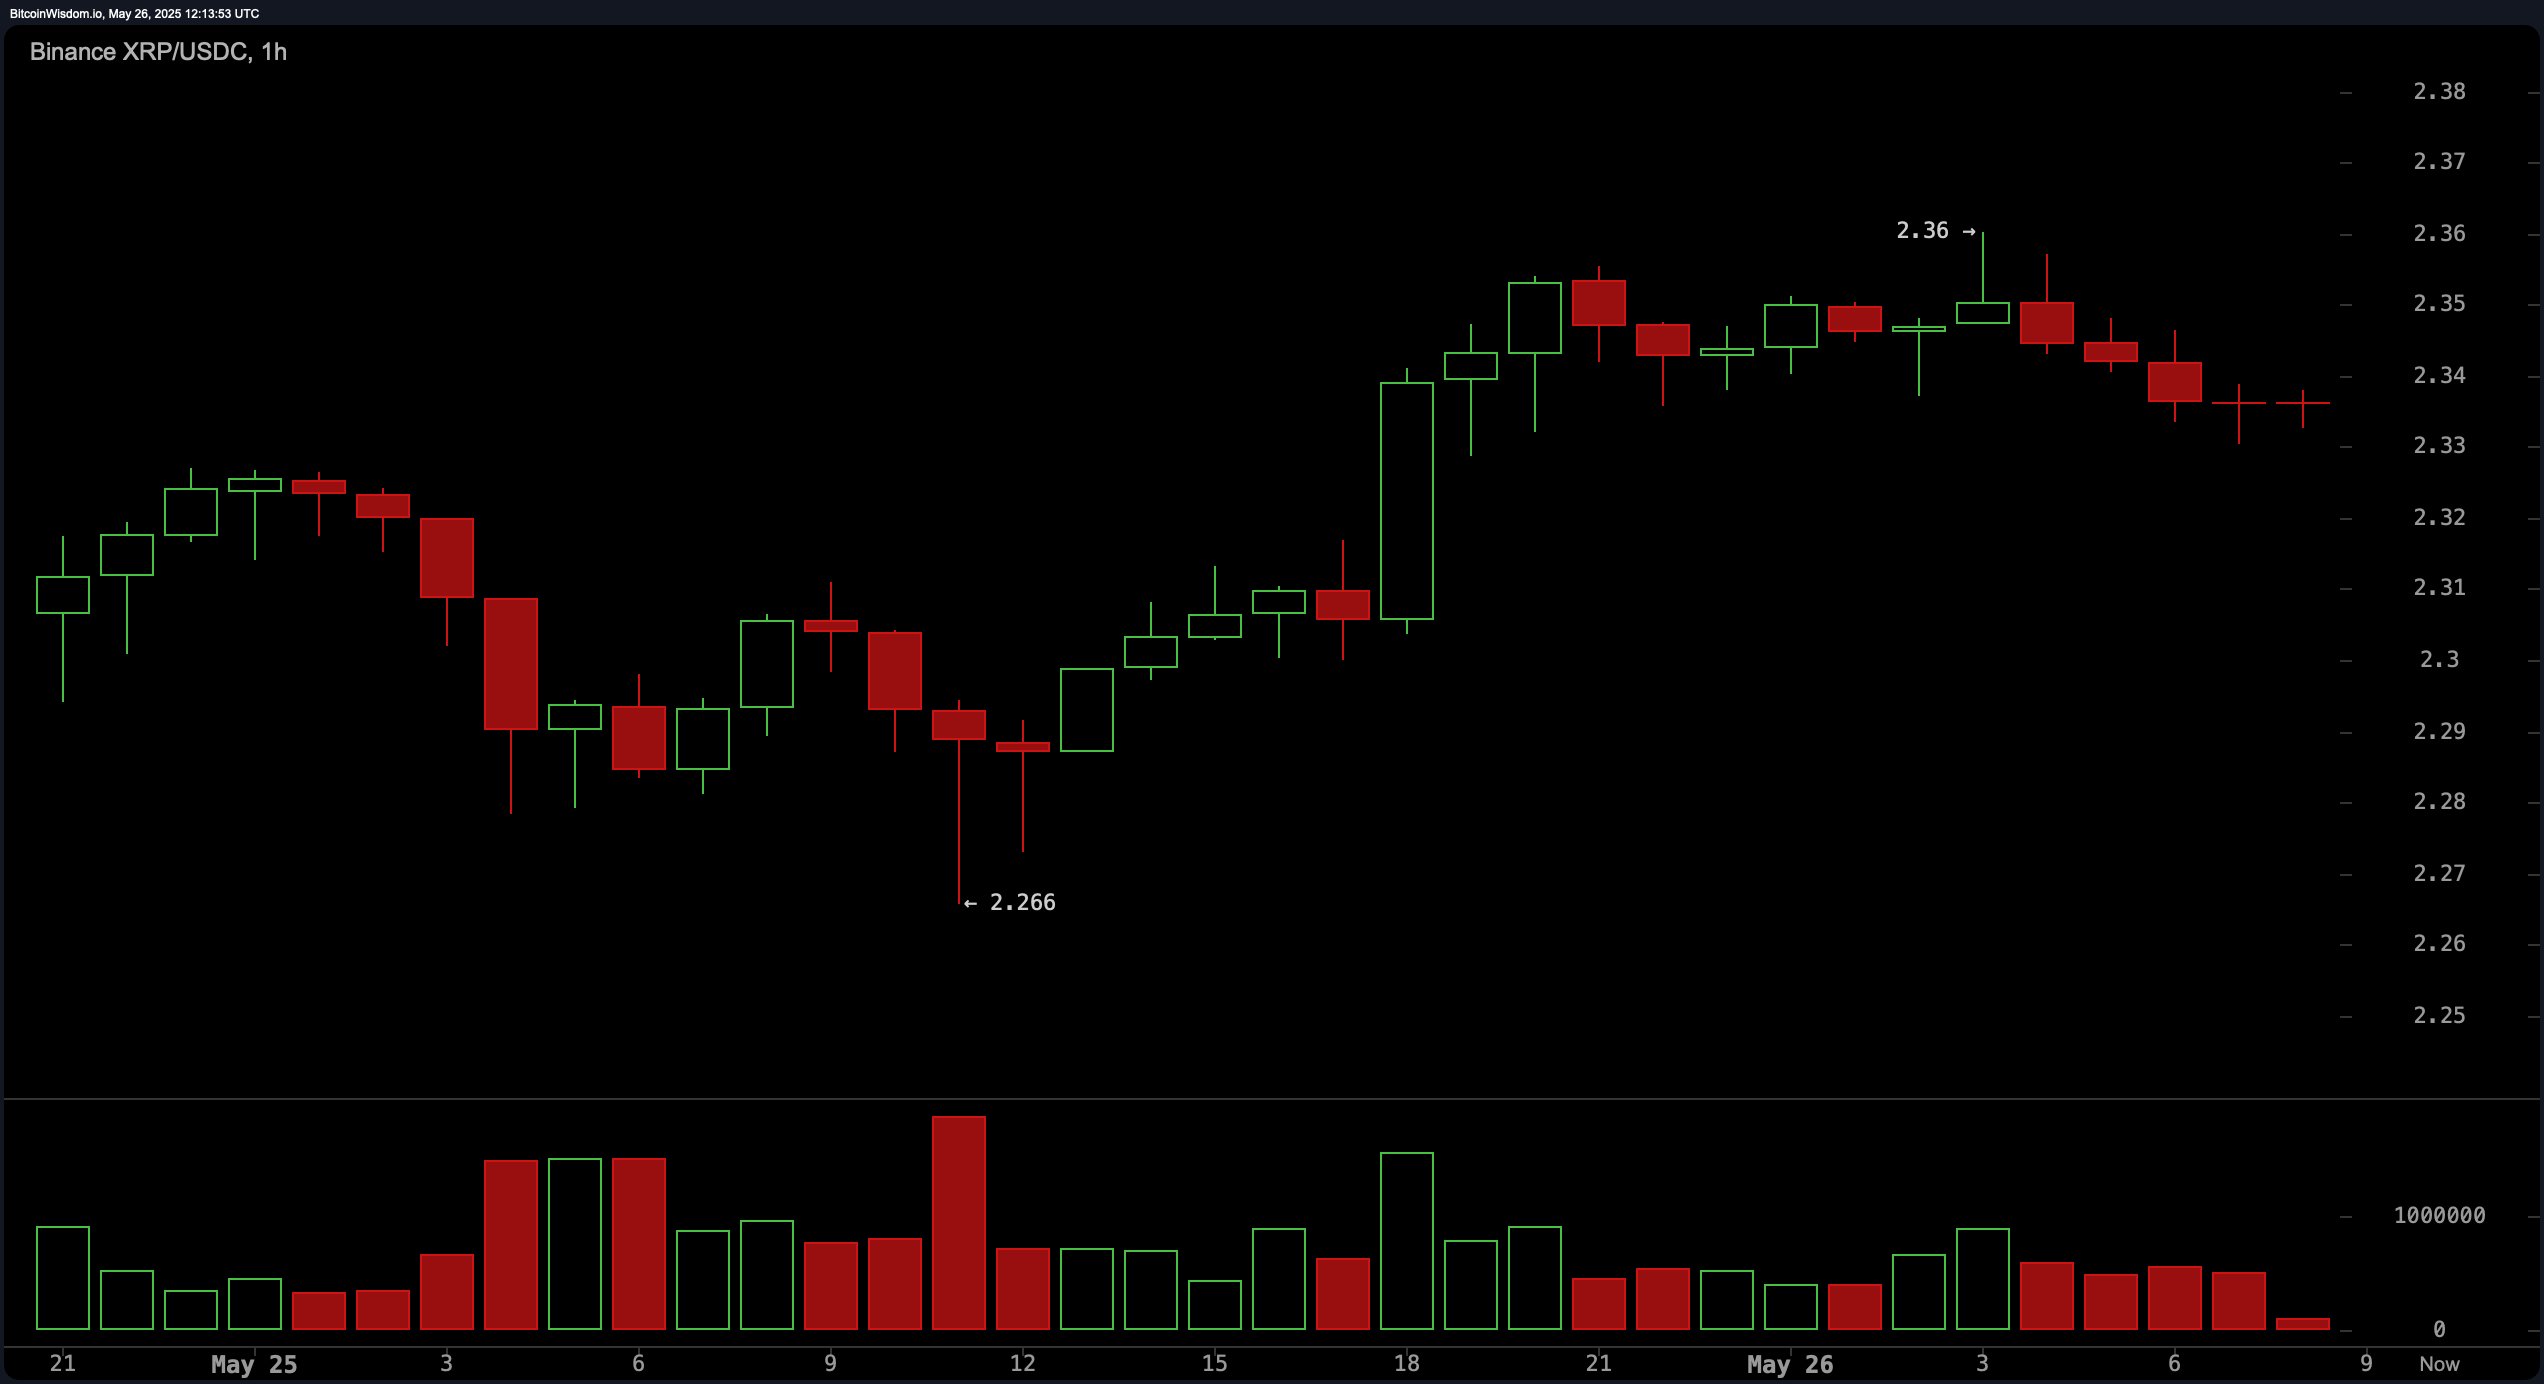
On the 1-hour chart, XRP decided to bounce back from a low of $2.266, like a cat that just refuses to stay down. It’s now eyeing the $2.36 resistance level like it’s the last piece of cake at a party. Volume data suggests buyers are creeping back in, which is great news for anyone who likes to live dangerously. But let’s be real, a solid breakout above $2.36 is what we’re all waiting for—preferably with a side of increased trading volume.
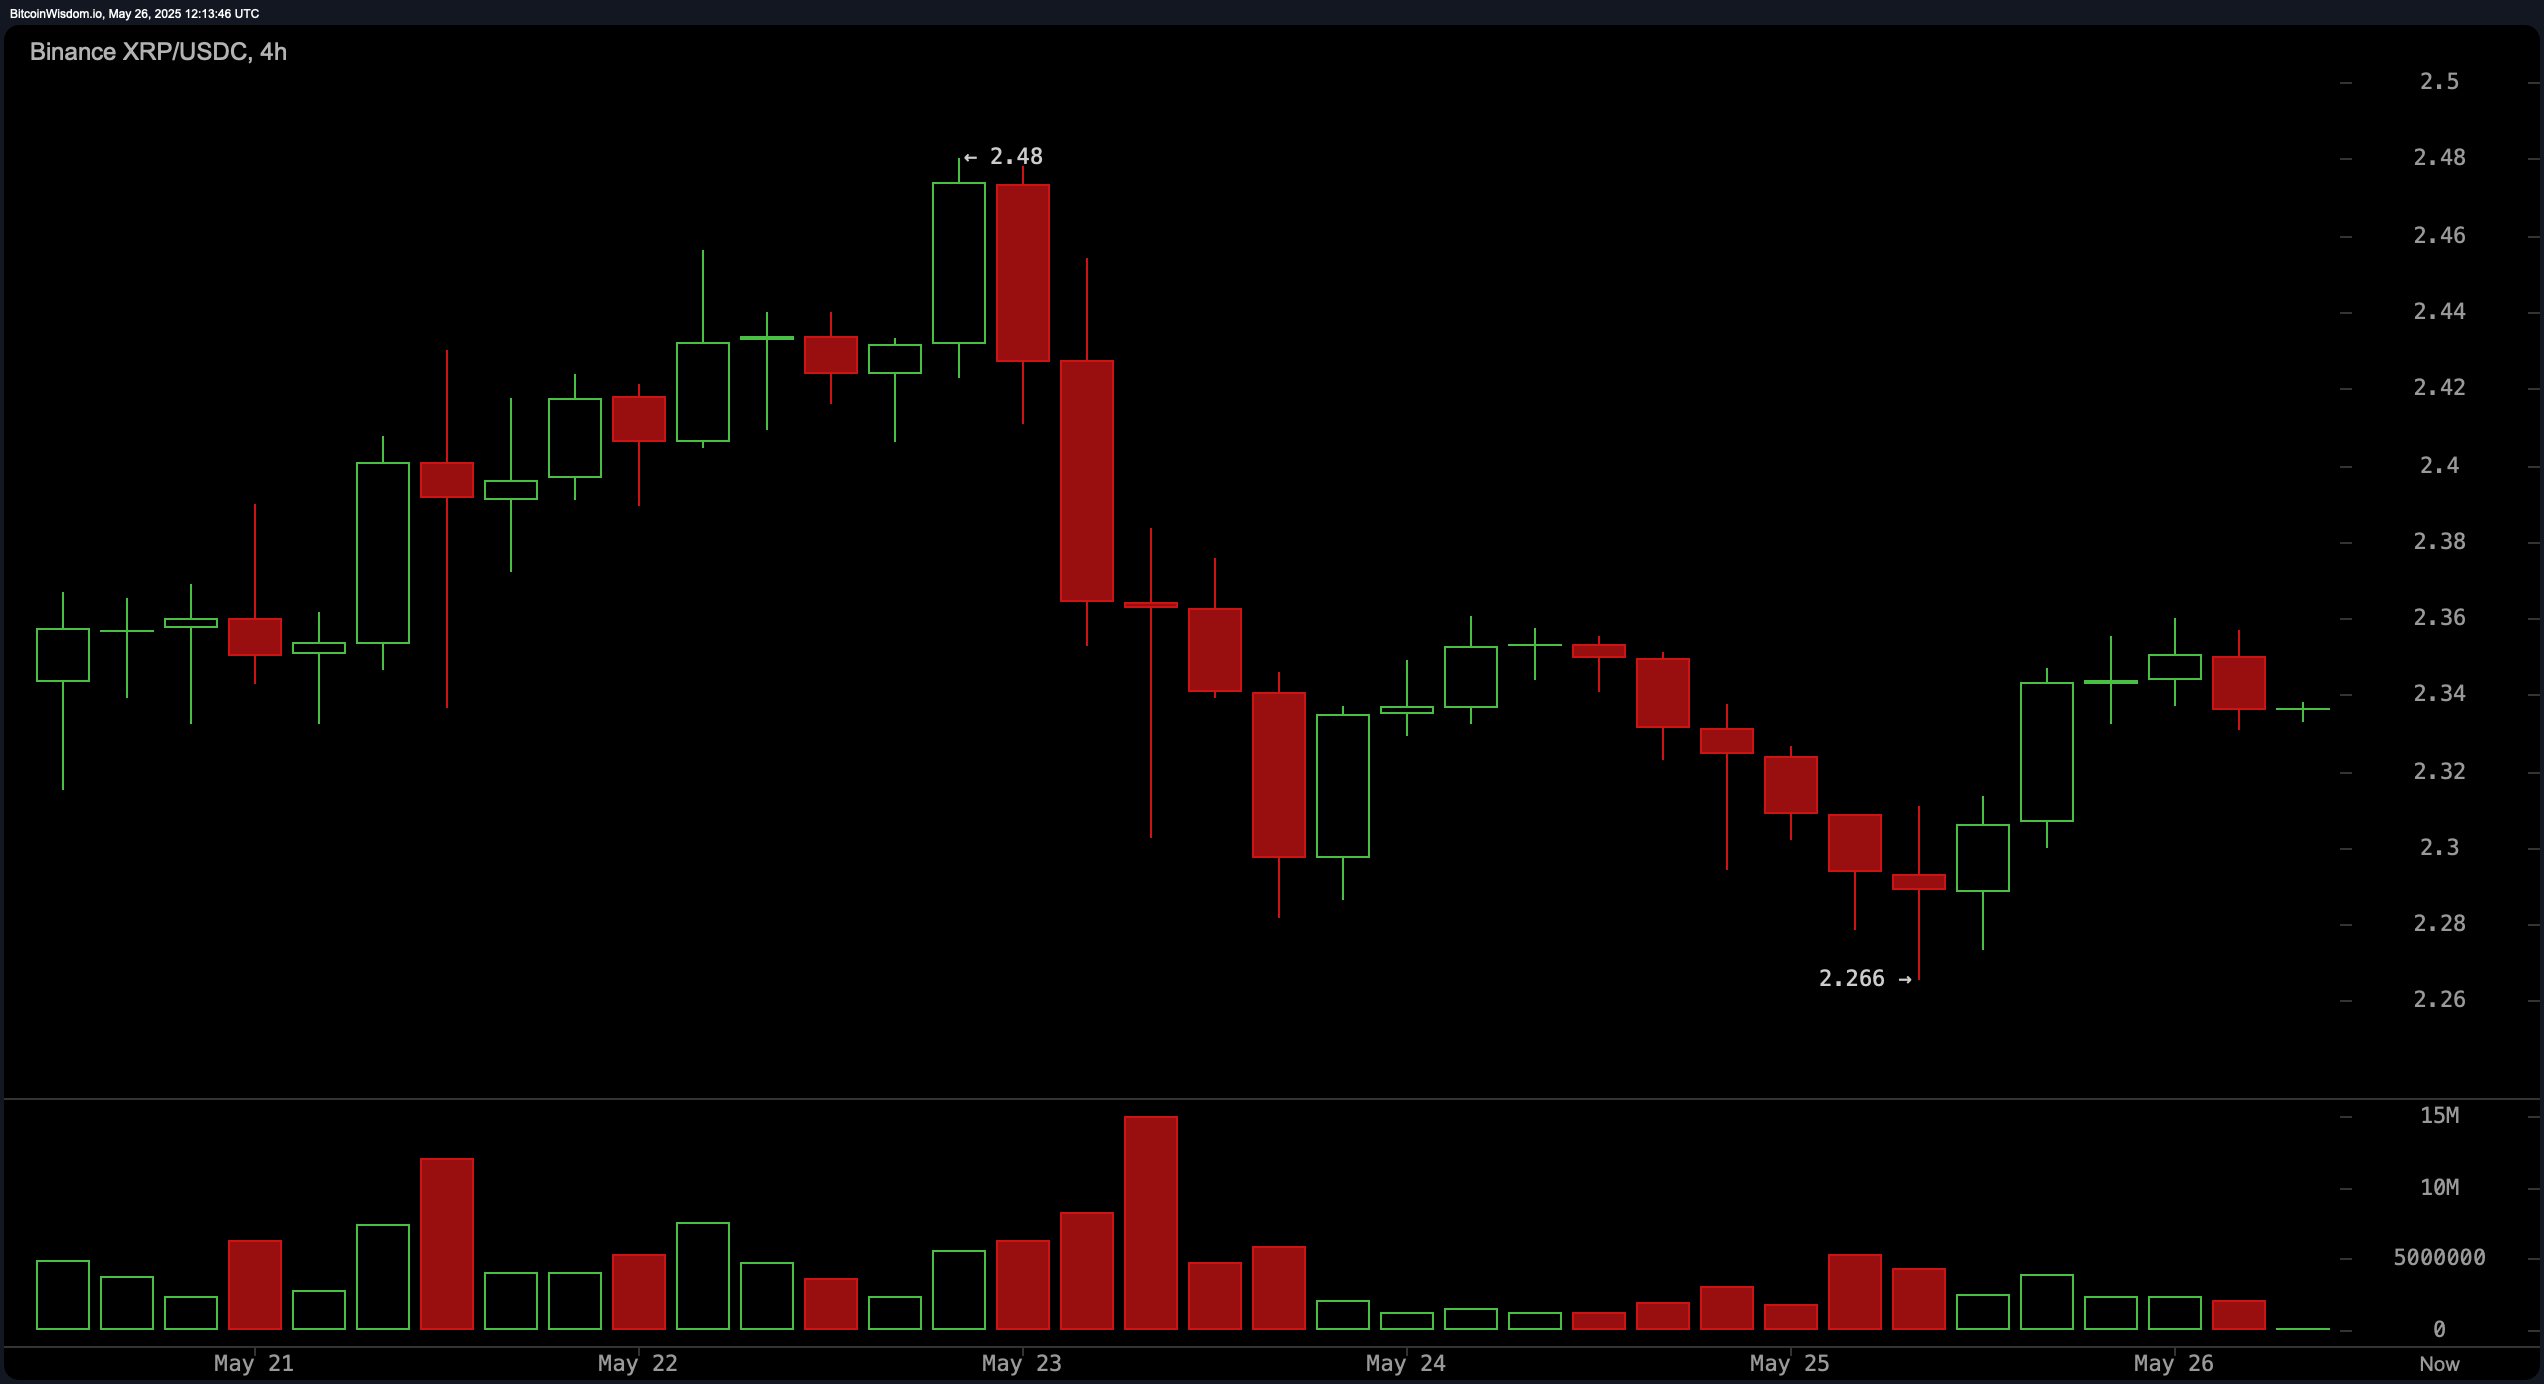
The 4-hour chart is looking like a soap opera, with XRP trying to form a higher low after a dramatic downtrend. The price is flirting between $2.32 and $2.34, which is basically a siren call for aggressive traders. But hold your horses! A falling pattern is flattening out, and the declining volume is like a warning sign saying, “Proceed with caution!” If we see bullish divergence in lower timeframes, we might just be on our way to $2.45—if momentum decides to join the party.
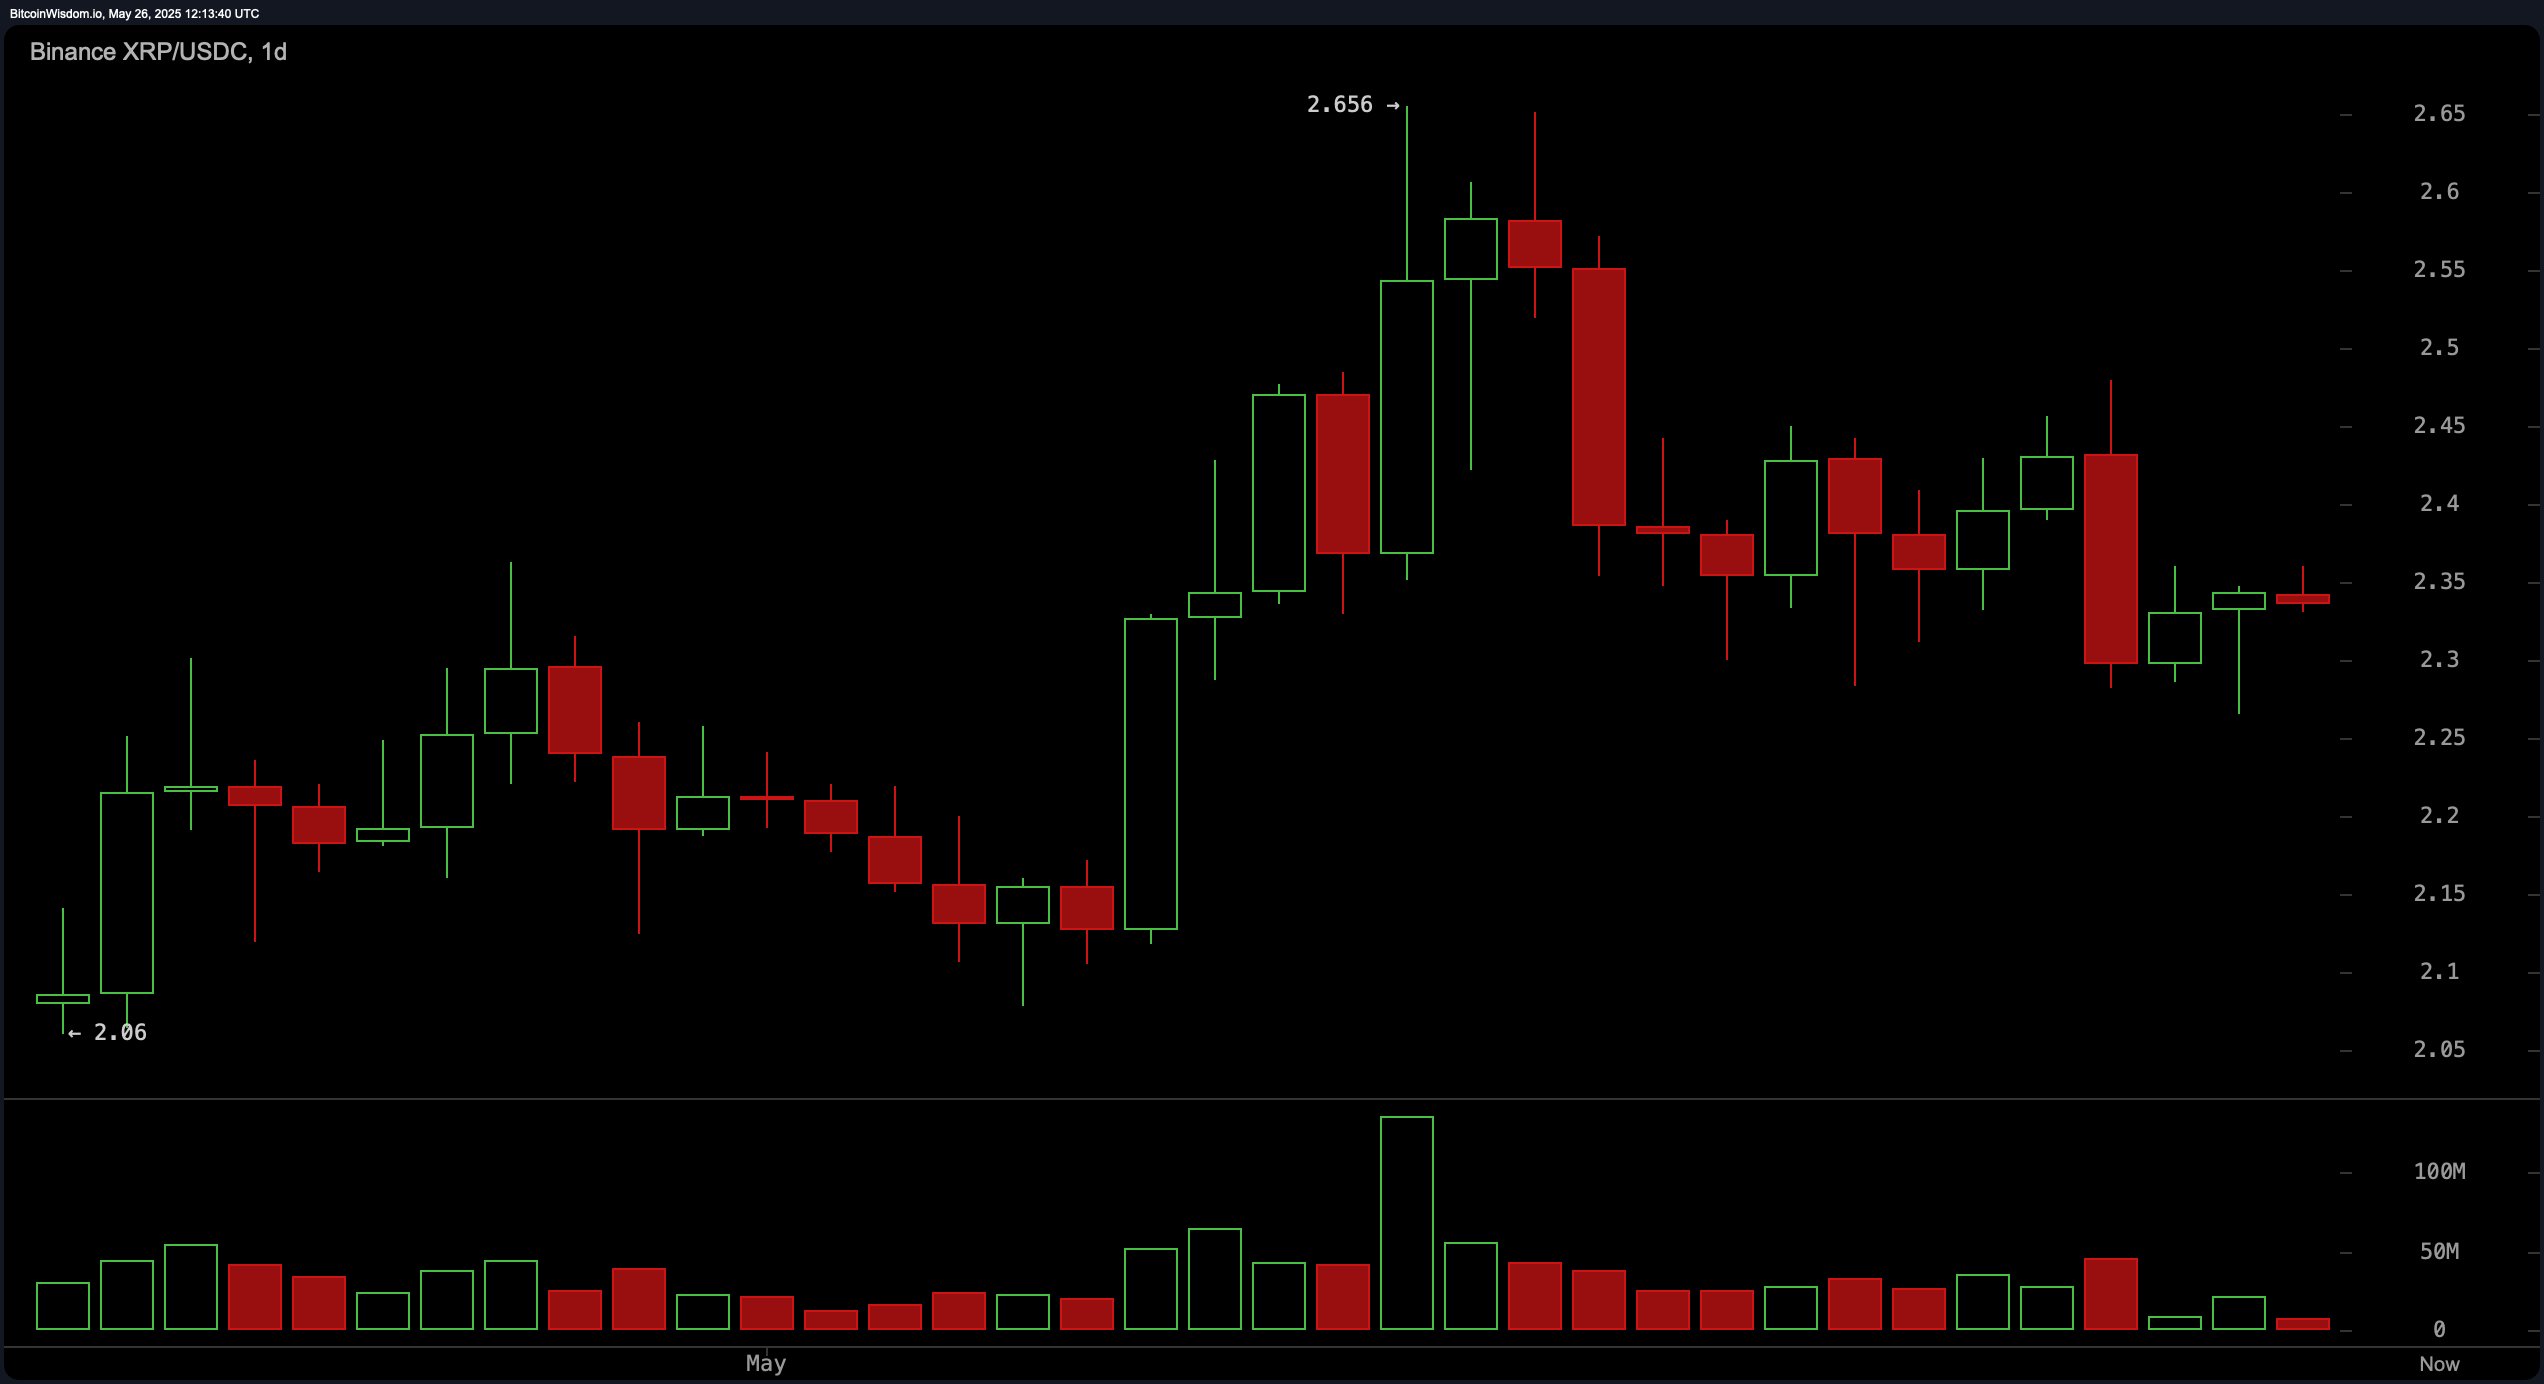
Now, let’s zoom out to the daily chart, where XRP is in a retracement phase after a wild ride to $2.656 earlier this month. It’s currently stabilizing between a support zone of $2.26 to $2.30 and resistance at $2.45 to $2.50. Think of it as a low-volatility yoga retreat. Traders are eyeing long opportunities near $2.30 to $2.33, but a slip below $2.26 would be like stepping on a Lego—painful and not good for bullish setups.
Oscillator indicators are giving us mixed signals, like a date that can’t decide where to go for dinner. The RSI is sitting at 50.27, which is as neutral as Switzerland. The Stochastic oscillator is at 16.90, waving a little flag saying “buy me!” while the CCI and ADX are like, “meh, not much going on here.” Meanwhile, the Awesome oscillator is barely positive, and the MACD is in sell territory, which is like a rain cloud over our sunny day.
Moving averages (MAs) are also playing it cool. The 10-period EMA and SMA are suggesting selling pressure, but the long-term averages are like a warm hug, indicating buy signals. The 200-period EMA and SMA are saying, “Don’t worry, we’ve got your back!” But let’s not get too comfy until we see some confirmation and volume.
Bull Verdict:
If XRP can break above $2.36 with some volume, we might just be on our way to the $2.45–$2.50 resistance zone. Strong support near $2.30 and bullish long-term moving averages are like a green light for upward momentum.
Bear Verdict:
But if it can’t hold the $2.30 support zone and dips below $2.26 with rising volume, we’re looking at a potential disaster. The short-term bearish pressure from oscillators and moving averages is like a warning bell—better tread carefully until we see a clearer direction!
Read More
- Masters Toronto 2025: Everything You Need to Know
- We Loved Both of These Classic Sci-Fi Films (But They’re Pretty Much the Same Movie)
- The Lowdown on Labubu: What to Know About the Viral Toy
- Street Fighter 6 Game-Key Card on Switch 2 is Considered to be a Digital Copy by Capcom
- Mario Kart World Sold More Than 780,000 Physical Copies in Japan in First Three Days
- ‘The budget card to beat right now’ — Radeon RX 9060 XT reviews are in, and it looks like a win for AMD
- Valorant Champions 2025: Paris Set to Host Esports’ Premier Event Across Two Iconic Venues
- Microsoft Has Essentially Cancelled Development of its Own Xbox Handheld – Rumour
- Gold Rate Forecast
- Karate Kid: Legends Hits Important Global Box Office Milestone, Showing Promise Despite 59% RT Score
2025-05-26 16:57