So, the crypto world’s just sitting there like a bored cat, but OMNI? It’s decided to throw a full-blown rave, surging 130% in 24 hours. I mean, who invited the party poopers when there’s this much fun to be had? 💃📈 Current vibes: price at $6.39, market cap $219M, 24h volume $663.70M, and volatility hitting 97.7% – because nothing says ‘stable investment’ like a rollercoaster, right? 😂
The drama kicks off with Upbit, South Korea’s crypto darling, announcing they’re listing OMNI. Trading pair OMNI/KRW goes live at 18:30 KST, with deposits opening right after. How thoughtful of them to schedule it when I’m probably elbow-deep in snacks. 🍿
But wait, Upbit’s not messing around – they’ve slapped on some rules to keep things ‘fair.’ For the first five minutes, no buying sprees allowed. And if you’re selling, better not go more than 10% under yesterday’s close, or you’ll get the side-eye. Then, only limit orders for the first two hours to avoid, you know, total chaos. Because apparently, crypto needs a chaperone. 🙄
OMNI Reacts to Listing Announcement
At this very moment, OMNI’s strutting at $6.39, market cap puffed up to $219M, and it’s jumped 129% in the last day. Spot volume’s up 150% – everyone’s suddenly an OMNI fanboy. Listing news is like catnip for cryptos; it brings all the liquidity to the yard. Some analysts are whispering about 1000x potential – sure, and I’m whispering back that pigs might fly. But hey, with a breakout from a 15-day downward channel on July 27, things are looking suspiciously bullish. Who knew a little chart pattern could be so dramatic? 📊
Omni Network? It’s this Layer 1 blockchain trying to fix Ethereum‘s rollup mess by making everything play nice together. Seamless interoperability, unified experiences – sounds like a bad blind date setup, but apparently, it’s the future. ETH‘s just chilling at $3,854 with barely any volatility, while OMNI’s out here living its best life. Jealous much? 😜
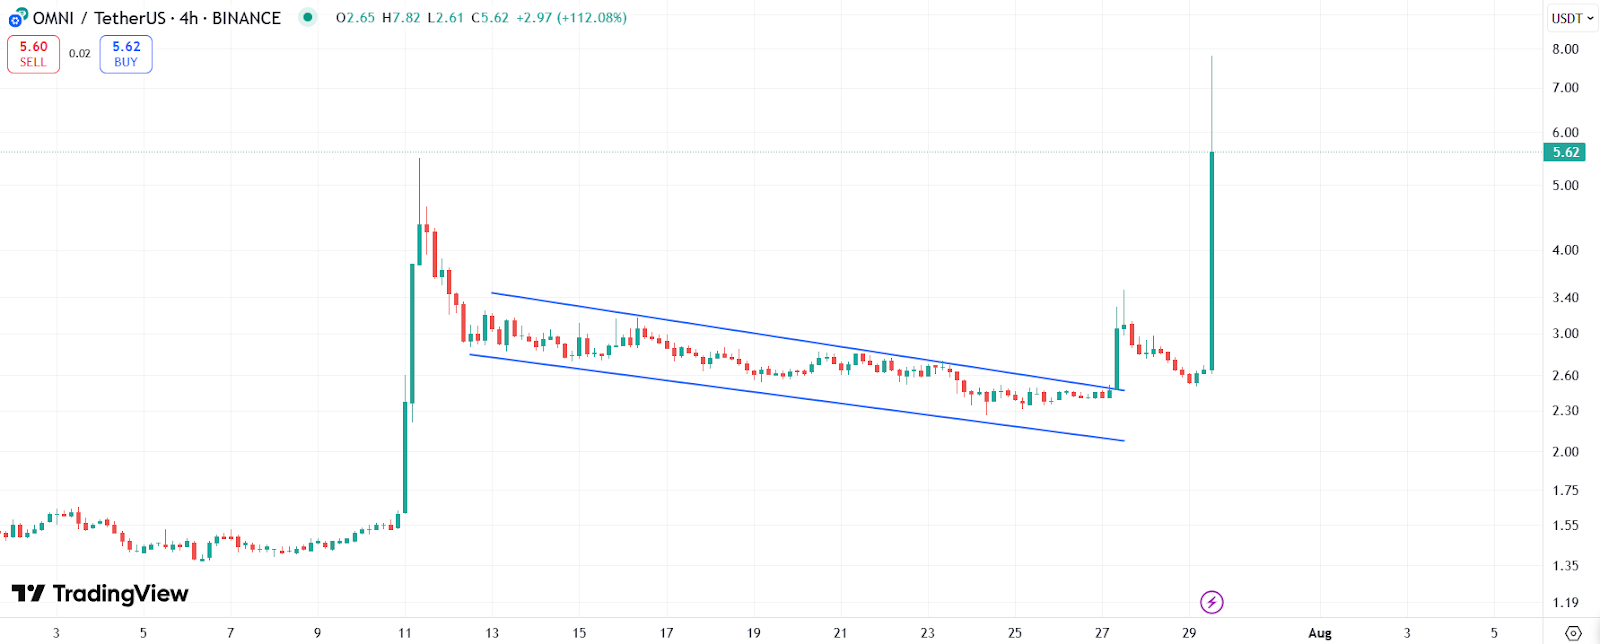
OMNI price chart with downward parallel channel | Source: Trading View
OMNI to $10 Soon?
On the 4-hour chart, RSI is screaming over 91 – overbought? More like overexcited. Could mean a pullback, or it could just keep partying. Bollinger Bands? OMNI’s burst through the upper one like it’s breaking out of jail. If things calm down, support might hold at $3.50 or the 20-day SMA around $2.87. MACD’s showing a bullish crossover, histogram bars going wild – accelerating momentum or just a sugar high? A close above $7.80 could send it to $10, but let’s not get too cocky. After all, crypto’s great at building you up just to drop you flat. Fingers crossed? Or maybe just crossed eyes from all this volatility. 🤞😂
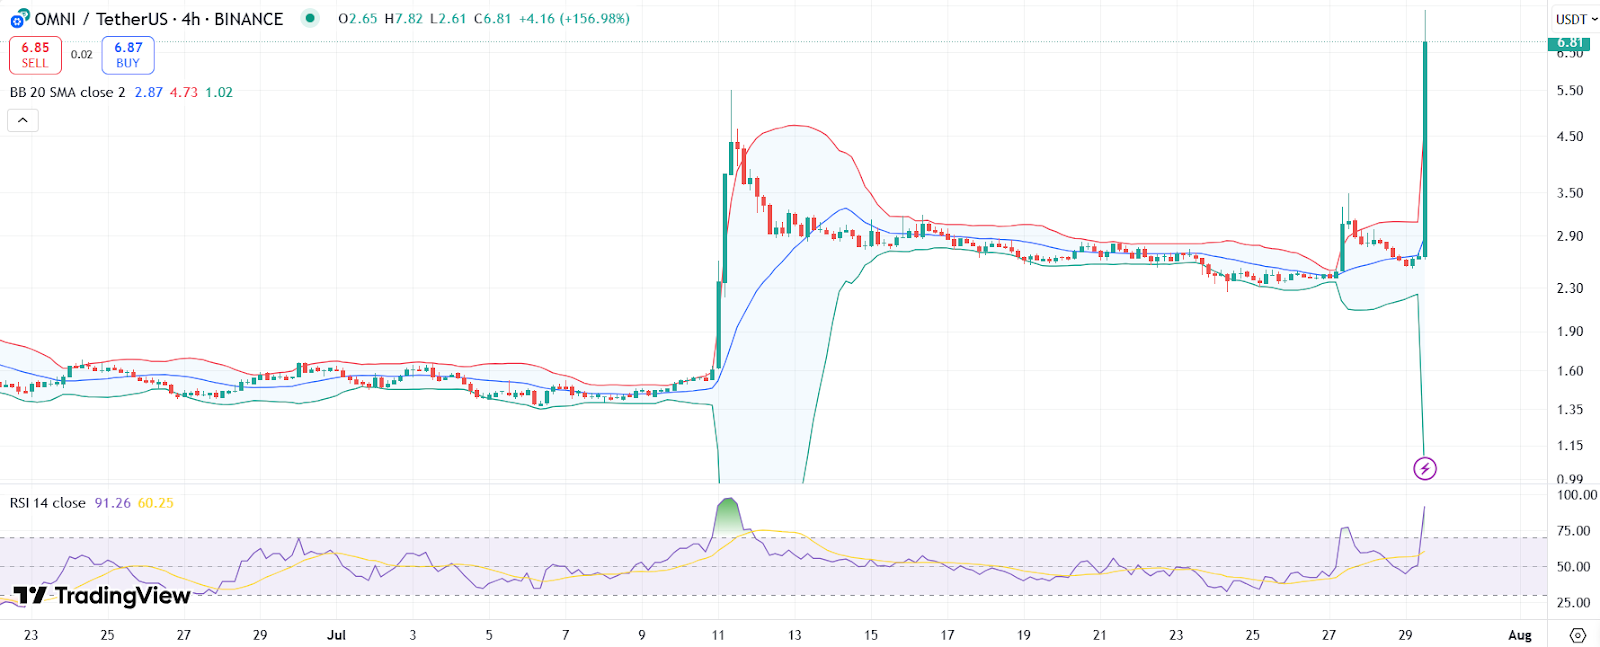
OMNI price chart with RSI and Bollinger Bands | Source: Trading View
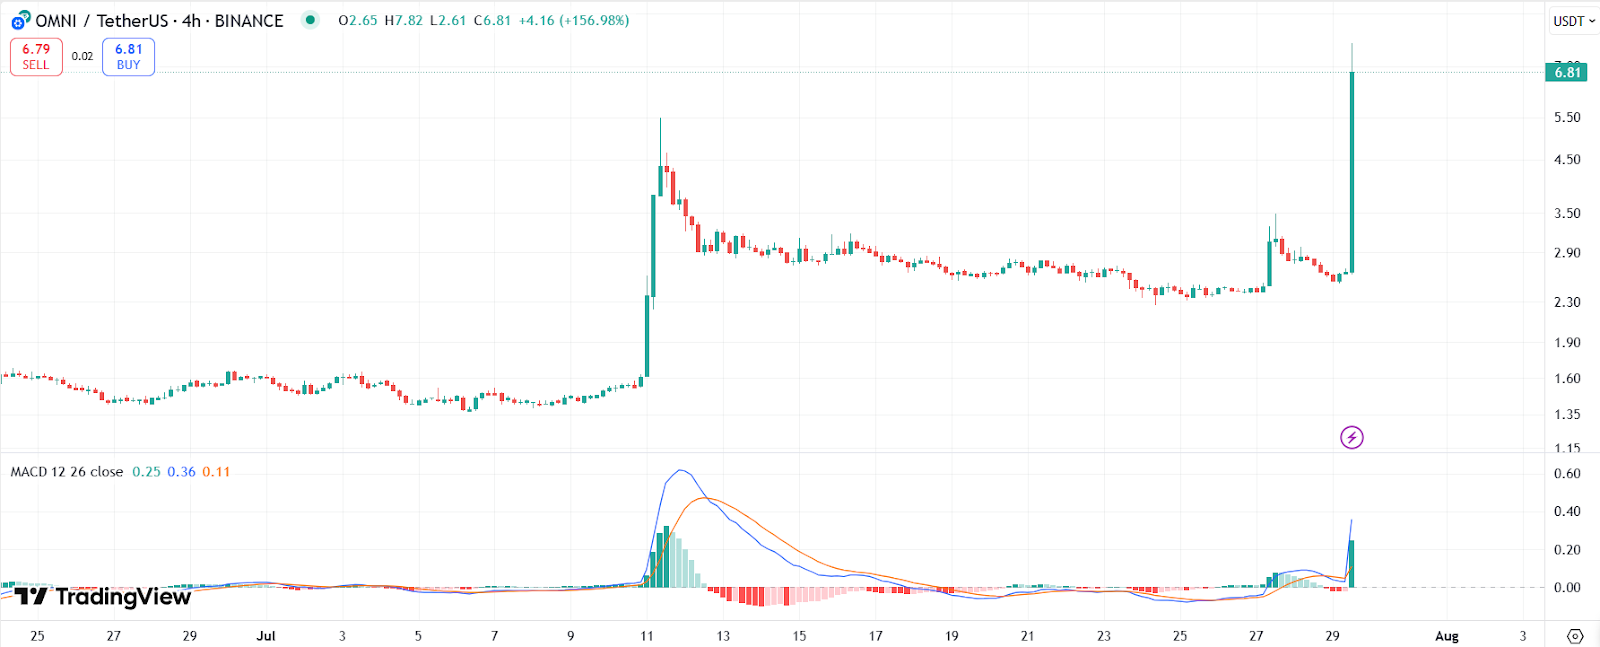
OMNI price chart with MACD | Source: Trading View
Read More
- What Song Is In The New Supergirl Trailer (& What It Means For The DC Movie)
- Highly Anticipated Strategy RPG Finally Sets Release Date (And It’s Soon)
- TV legend Carol Kirkwood reveals the reasons why she decided to retire after 28 years with BBC
- Why is Tech Jacket gender-swapped in Invincible season 4 and who voices her?
- Dune 3 Gets the Huge Update Fans Have Been Waiting For
- MOUSE: P.I. For Hire Loops in Caravan Palace for A Catchy New Track Ahead of April 16 Release
- 49 Years Ago Today, Movie History Was Changed by a Film You’ve Never Even Seen
- Gold Rate Forecast
- The Most Surreal Moments From the O.J. Simpson Murder Trial
- Alan Ritchson’s Reacher Future Looks Hopeful Thanks To Amazon’s 10/10 Action Thriller Series
2025-07-29 17:51