- PEPE saw its market structure flip bearishly, indicating further losses were likely.
The on-chain metrics flashed a strong buy signal, but market sentiment remained fearful.
Pepe’s price failed to hold $0.00000581 for a second attempt, resulting in a nearly 50% drop over the last five days. A significant portion of these losses occurred between April 11th and 13th.
Traders could be taken aback by PEPE‘s volatility, but this unpredictability also presented an opportunity. In just over a day since its low on 13th April, PEPE has surged by approximately 33%. However, this significant price increase doesn’t necessarily mean the local minimum has been reached. Let me provide some insights into what could happen next.
Evidence for accumulation
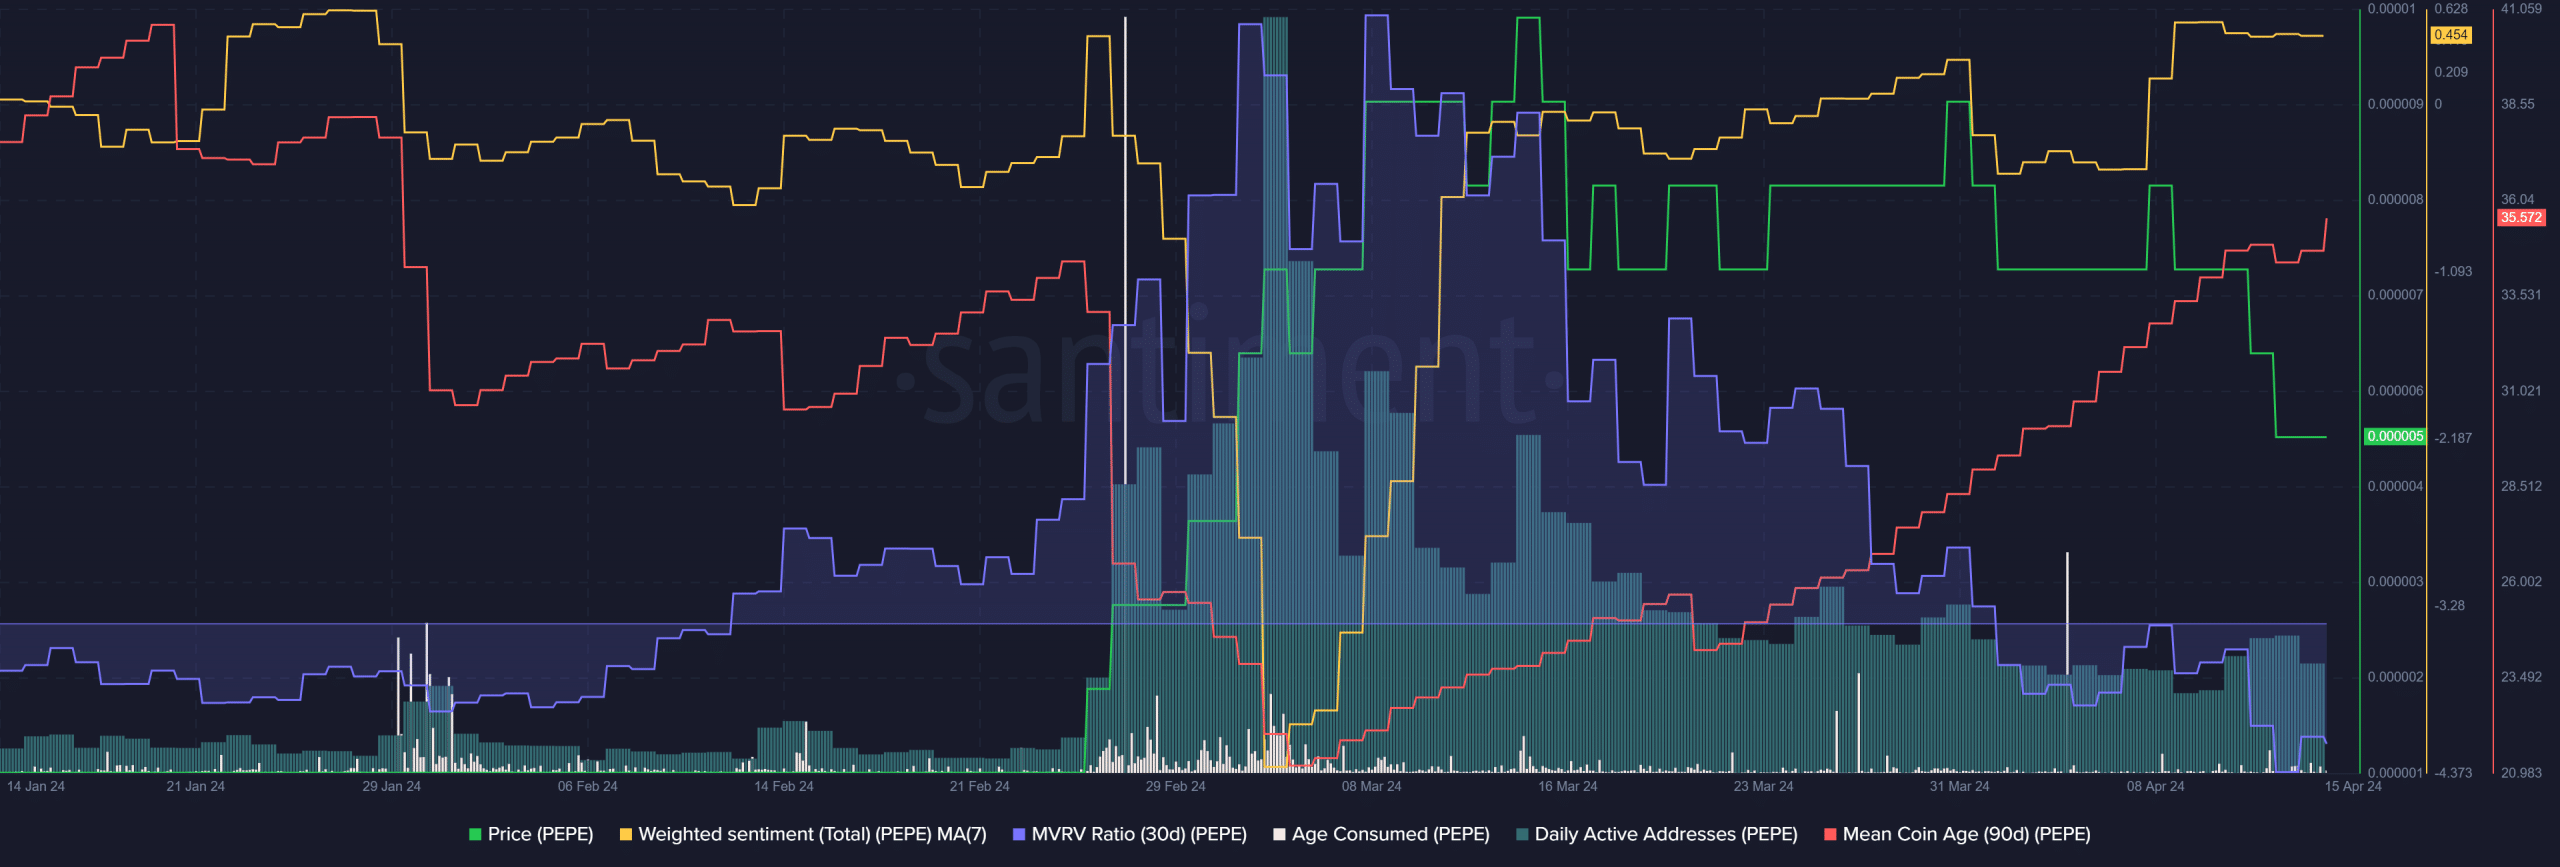
Starting from mid-March, the memecoin gave back some of the value it gained towards the end of February. However, an intriguing pattern emerged: while the price was falling, the average age of coins in circulation continued to rise. This increase suggests that more PEPE coins have been accumulated within the network.
The age consumed metric provided additional evidence for this observation. It exhibited a significant increase on April 4th, as well as two substantial spikes on March 26th and 27th. Collectively, these events signified considerable shifts, but they did not display the consistent pattern that was present during early March.
During this period, some investors panicked and sold at a loss. However, others remained steadfast and kept holding. The 30-day Moving Average of Realized Value (MVRV) showed that their losses were increasing, as evidenced by a negative value. Interestingly, the mean coin age and negative MVRV combined created a buy signal.
Surprisingly, the seven-day average of sentiment showed a positive trend despite recent unfavorable news. However, according to technical analysis, there was a potential for a more significant decrease to come.
The structure breaks and the next demand zone
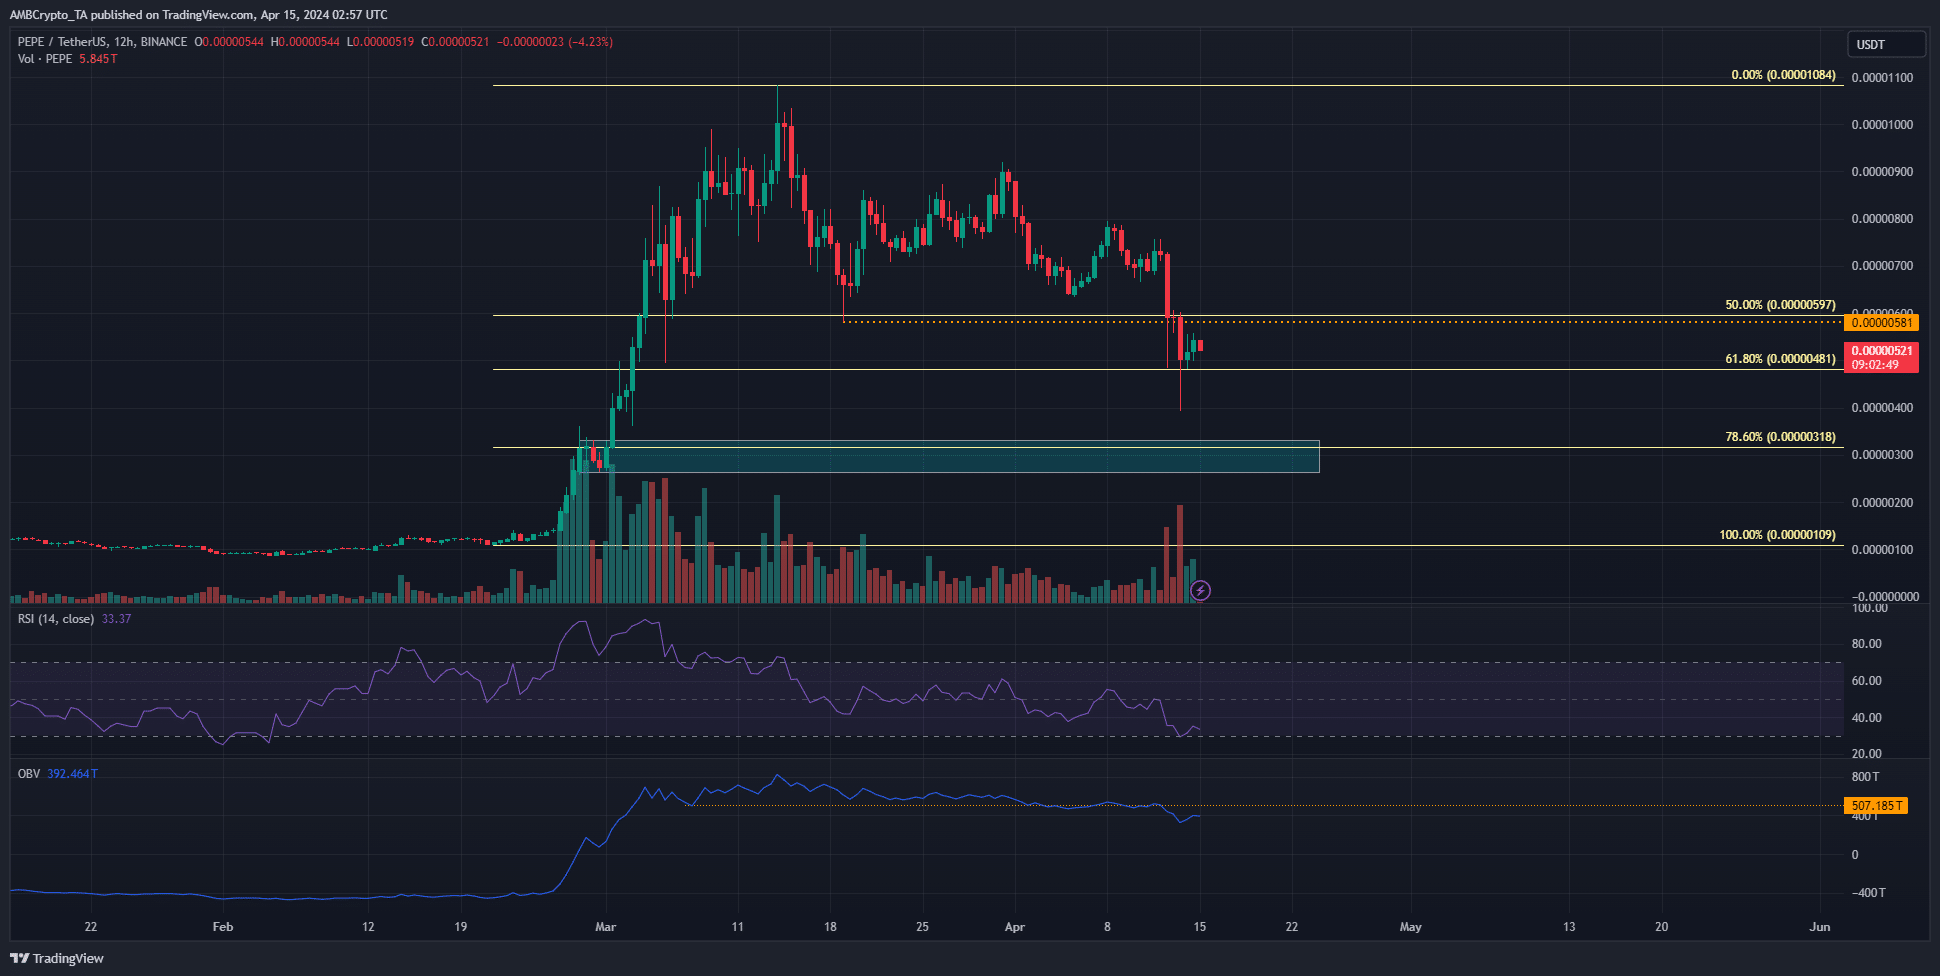
On March 19th, the price of PEPE dipped down to $0.00000581, reaching a new minimum. This latest decline in PEPE indicated that the shorter timeframe trend was bearish, and the market structure followed this downtrend. However, on the 12-hour chart, there were still bullish signals suggesting an ongoing uptrend.
With an RSI of 33, downward momentum was stronger than upward. Additionally, the OBV dropped below a significant support line. As a result, it’s likely that losses will continue into April. The meme coin may hit a retracement level of $0.00000318, which is approximately 78.6% of its previous value.
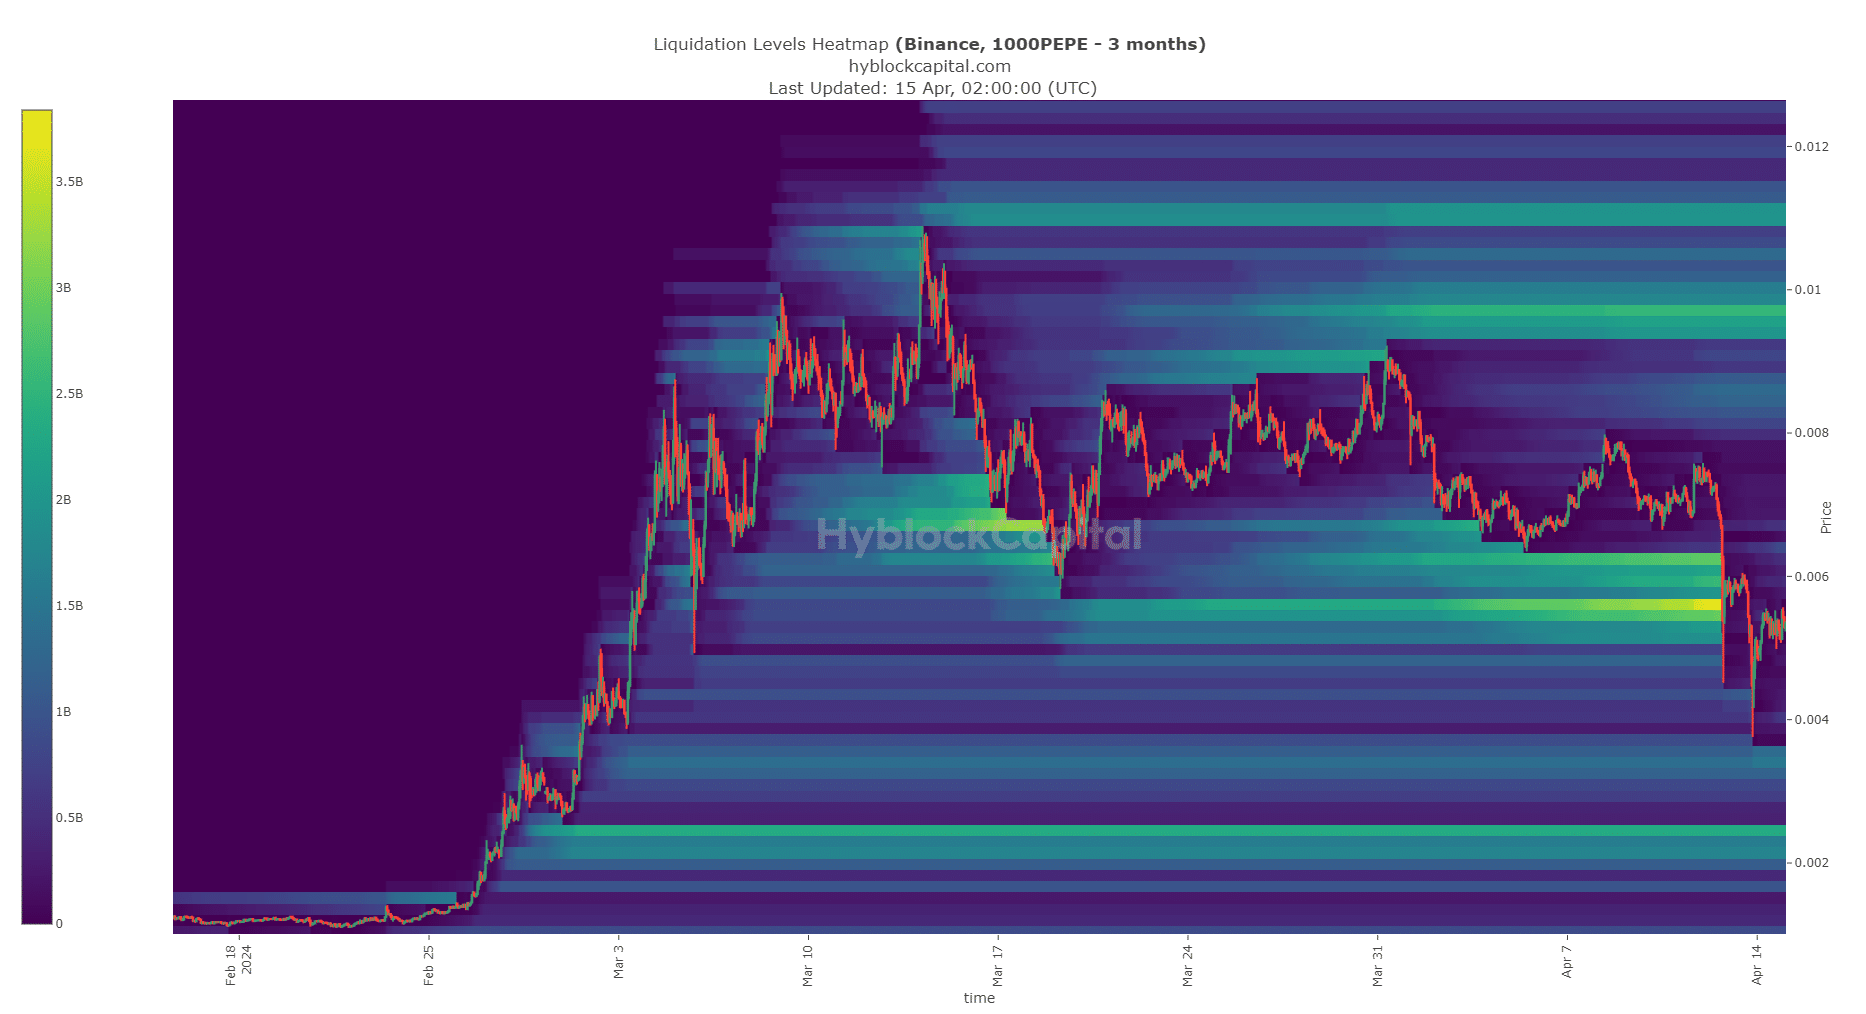
The liquidation heatmap indicated few pricing levels for liquidation above current market values. Below these levels, the price could be attracted to $0.00000245. However, if Bitcoin (BTC) has hit its local minimum, then PEPE may rebound with greater strength.
Is your portfolio green? Check the Pepe Profit Calculator
In the brief period, that region around $0.00000955 showed magnetic properties as well. Yet, its price being 85% above the current market rates raised doubts due to market instability.
In simple terms, the data indicated that PEPE could be a profitable buy for short-term traders based on current market trends.
Read More
- LDO PREDICTION. LDO cryptocurrency
- JASMY PREDICTION. JASMY cryptocurrency
- Can Ethereum ETFs outperform Bitcoin ETFs – Yes or No?
- Chainlink to $20, when? Why analysts are positive about LINK’s future
- Citi analysts upgrade Coinbase stock to ‘BUY’ after +30% rally projection
- Why iShares’ Bitcoin Trust stock surged 13% in 5 days, and what’s ahead
- Spot Solana ETF approvals – Closer than you think?
- Orca crypto price prediction: Buying opportunity ahead, or bull trap?
- Top 10 Stocks and Crypto Robinhood Alternatives & Competitors
- ‘China’s going to have it’ – Donald Trump crypto stance, finally explained
2024-04-15 10:15