- SOL’s price has risen by almost 15% in the past 24 hours.
Bearish outlook continues to persist in the altcoin’s market.
Over the past 24 hours, Solana’s SOL price has surged by more than 10%, causing some investors with short positions in Solana’s Futures market to be forced to exit their trades based on Coinglass’ latest figures.
Currently, Solana’s value stands at $145.12, marking an 11% increase within the past 24 hours. Notably, Solana is the sole top-five cryptocurrency asset, based on CoinMarketCap’s data, that has achieved double-digit percentage growth during this timeframe, surpassing Bitcoin as it approaches its halving event.
When a trader’s position in the derivatives market for an asset is forcibly closed due to insufficient funds, this is called a liquidation. This can occur when an asset’s value unexpectedly increases and traders holding bets on a price decrease are compelled to sell their positions, which are referred to as short liquidations.
Based on information from Coinglass, $13 million worth of Short positions for SOL were liquidated in a 24-hour period. In contrast, $9 million was the value of Long positions that were liquidated during the same time frame.
To what end is the rally?
Based on an analysis of SOL‘s price fluctuations in the past day, it appears that its significant price increase might not be sustained. Instead, pessimistic views persist among traders, overshadowing optimistic actions.
At the current moment, the SOL SAR indicator’s dots, which represent potential support or resistance levels, are located above the Solana price, having been placed there since April 5th.
This indicator highlights possible trends and trend reversals for an asset. When its dots are above the asset’s price, it signals a potential market drop. It implies that the asset’s price has been decreasing, and the downward trend might continue.
Read Solana’s [SOL] Price Prediction 2024-25
In addition, the MACD line of SOL, represented by the blue graph, sat beneath both the signal line (orange) and the zero line. This signified that the short-term moving average of the asset was lower than its long-term moving average.
On March 22nd, this significant event took place, signaling a change from optimistic buying to pessimistic selling for SOL. Subsequently, the volume of SOL being sold surpassed the volume of SOL being bought.
It’s intriguing to note that while SOL‘s price has been on a downward trend for some time, its Chaikin Money Flow (CMF) indicator has defied this trend and kept climbing up – a sign of potential buying pressure, or a bullish divergence.
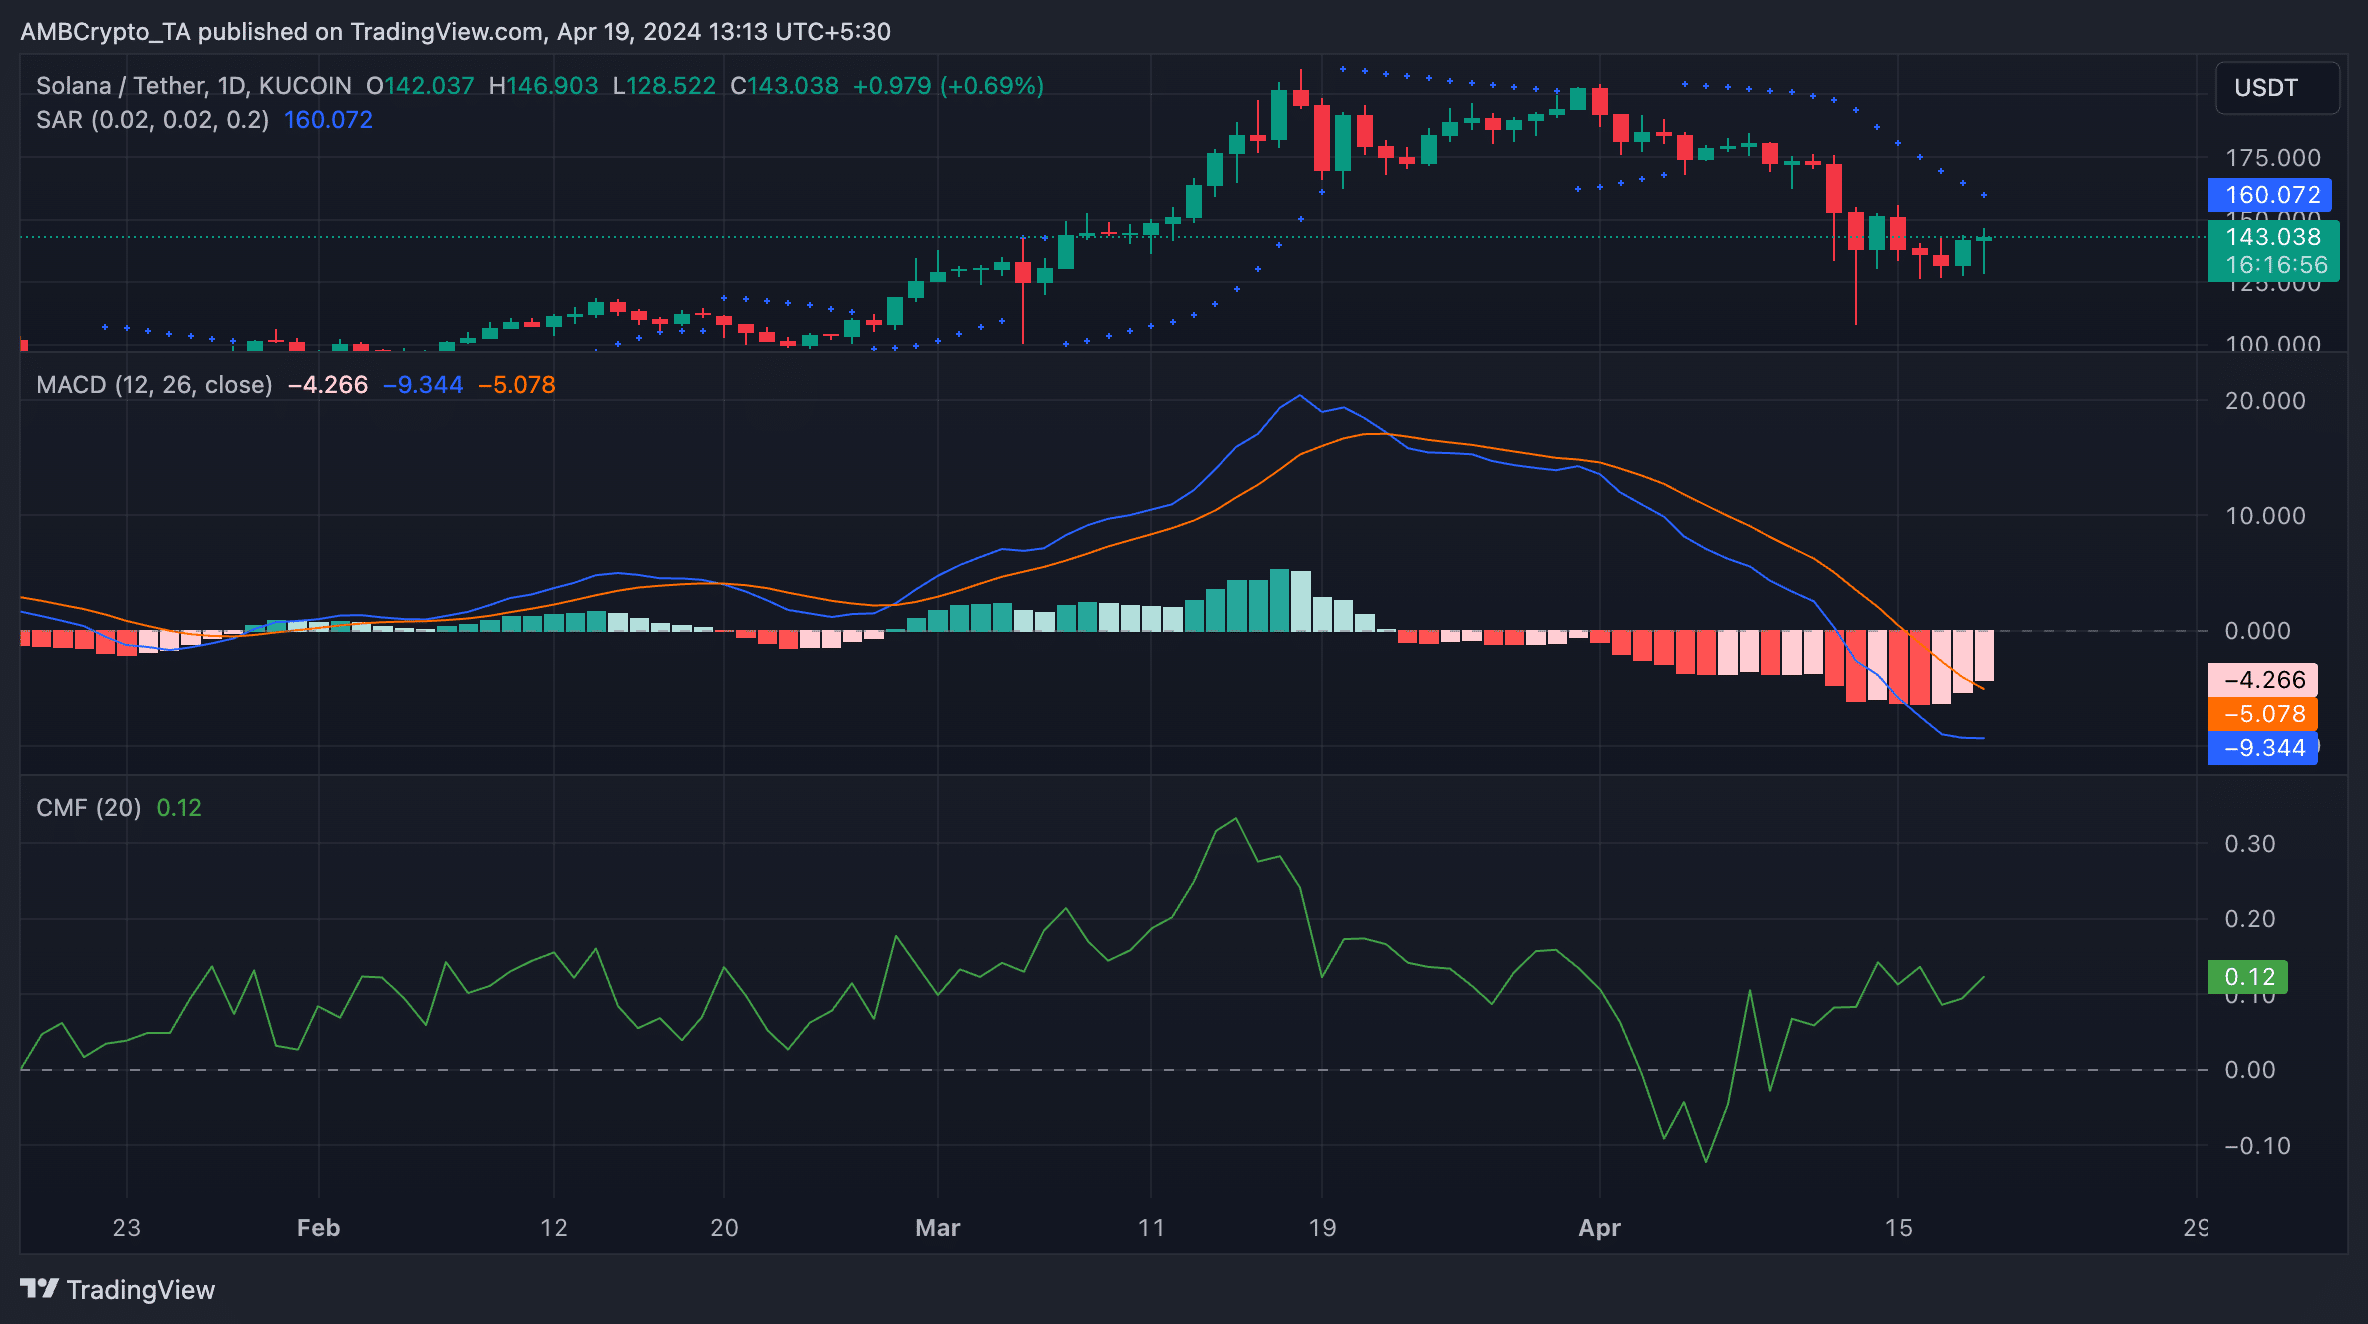
Despite a price decrease for SOL, there is strong demand from larger investors who may be purchasing more SOL in expectation of an upturn in the market.
Read More
- LDO PREDICTION. LDO cryptocurrency
- JASMY PREDICTION. JASMY cryptocurrency
- Orca crypto price prediction: Buying opportunity ahead, or bull trap?
- Can Ethereum ETFs outperform Bitcoin ETFs – Yes or No?
- Chainlink to $20, when? Why analysts are positive about LINK’s future
- Citi analysts upgrade Coinbase stock to ‘BUY’ after +30% rally projection
- Why iShares’ Bitcoin Trust stock surged 13% in 5 days, and what’s ahead
- Spot Solana ETF approvals – Closer than you think?
- Injective at risk of pullback as key resistance holds strong – What now?
- Crypto mining ‘strengthens America’s energy grids’ – A 30% tax means…
2024-04-19 20:07