XRP is trading at a princely sum of $2.81, which is basically pocket change for a cryptocurrency in 2025. Its market cap of $167 billion is a mere drop in the ocean 💧 compared to Bitcoin’s ego, while the 24-hour volume of $4.7 billion feels like a polite yawn in crypto terms. The price has been stuck in a tight intraday range of $2.80-$2.88, like a frog 🐸 refusing to jump-clearly, indecision is the name of the game.
XRP
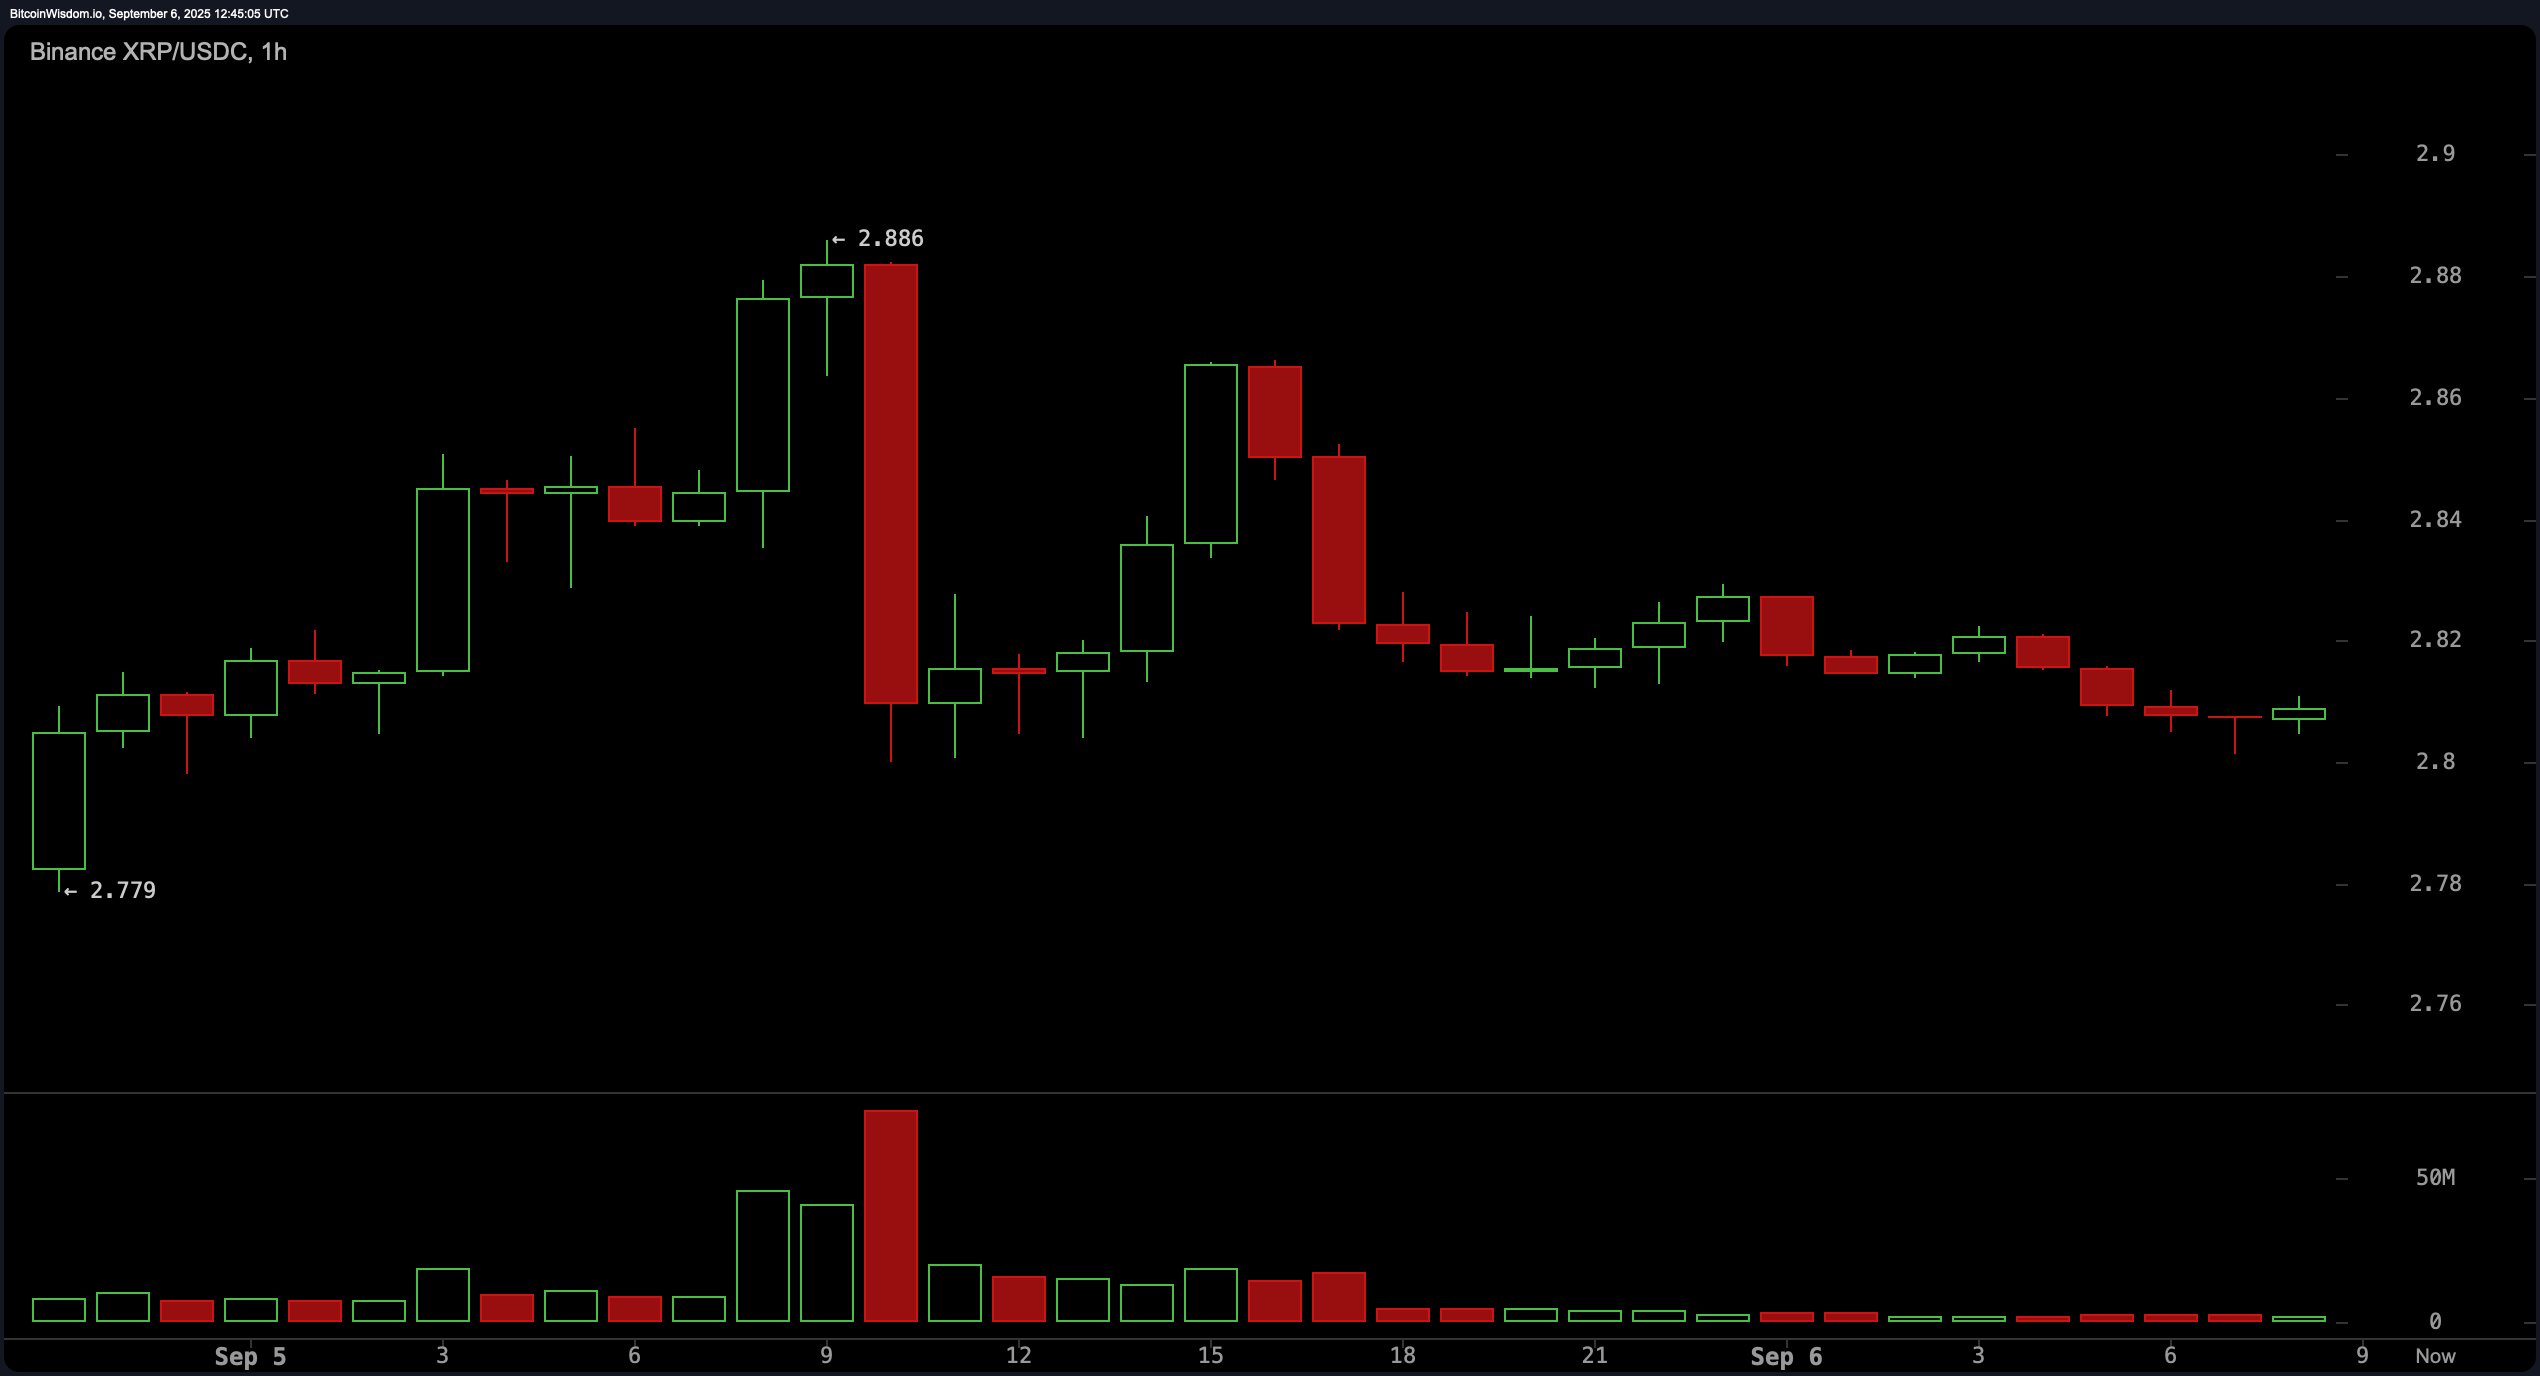
On the 1-hour chart, XRP has drawn a bearish engulfing pattern near $2.886, which is basically the crypto version of saying, “Nah, I don’t want to go up anymore.” 😢 The price has since been drifting sideways like a lost tourist, stabilizing around $2.80 with low volume. If you’re thinking, “This looks like a party,” congratulations-you’ve just mastered the art of reading a flat chart. 🎉
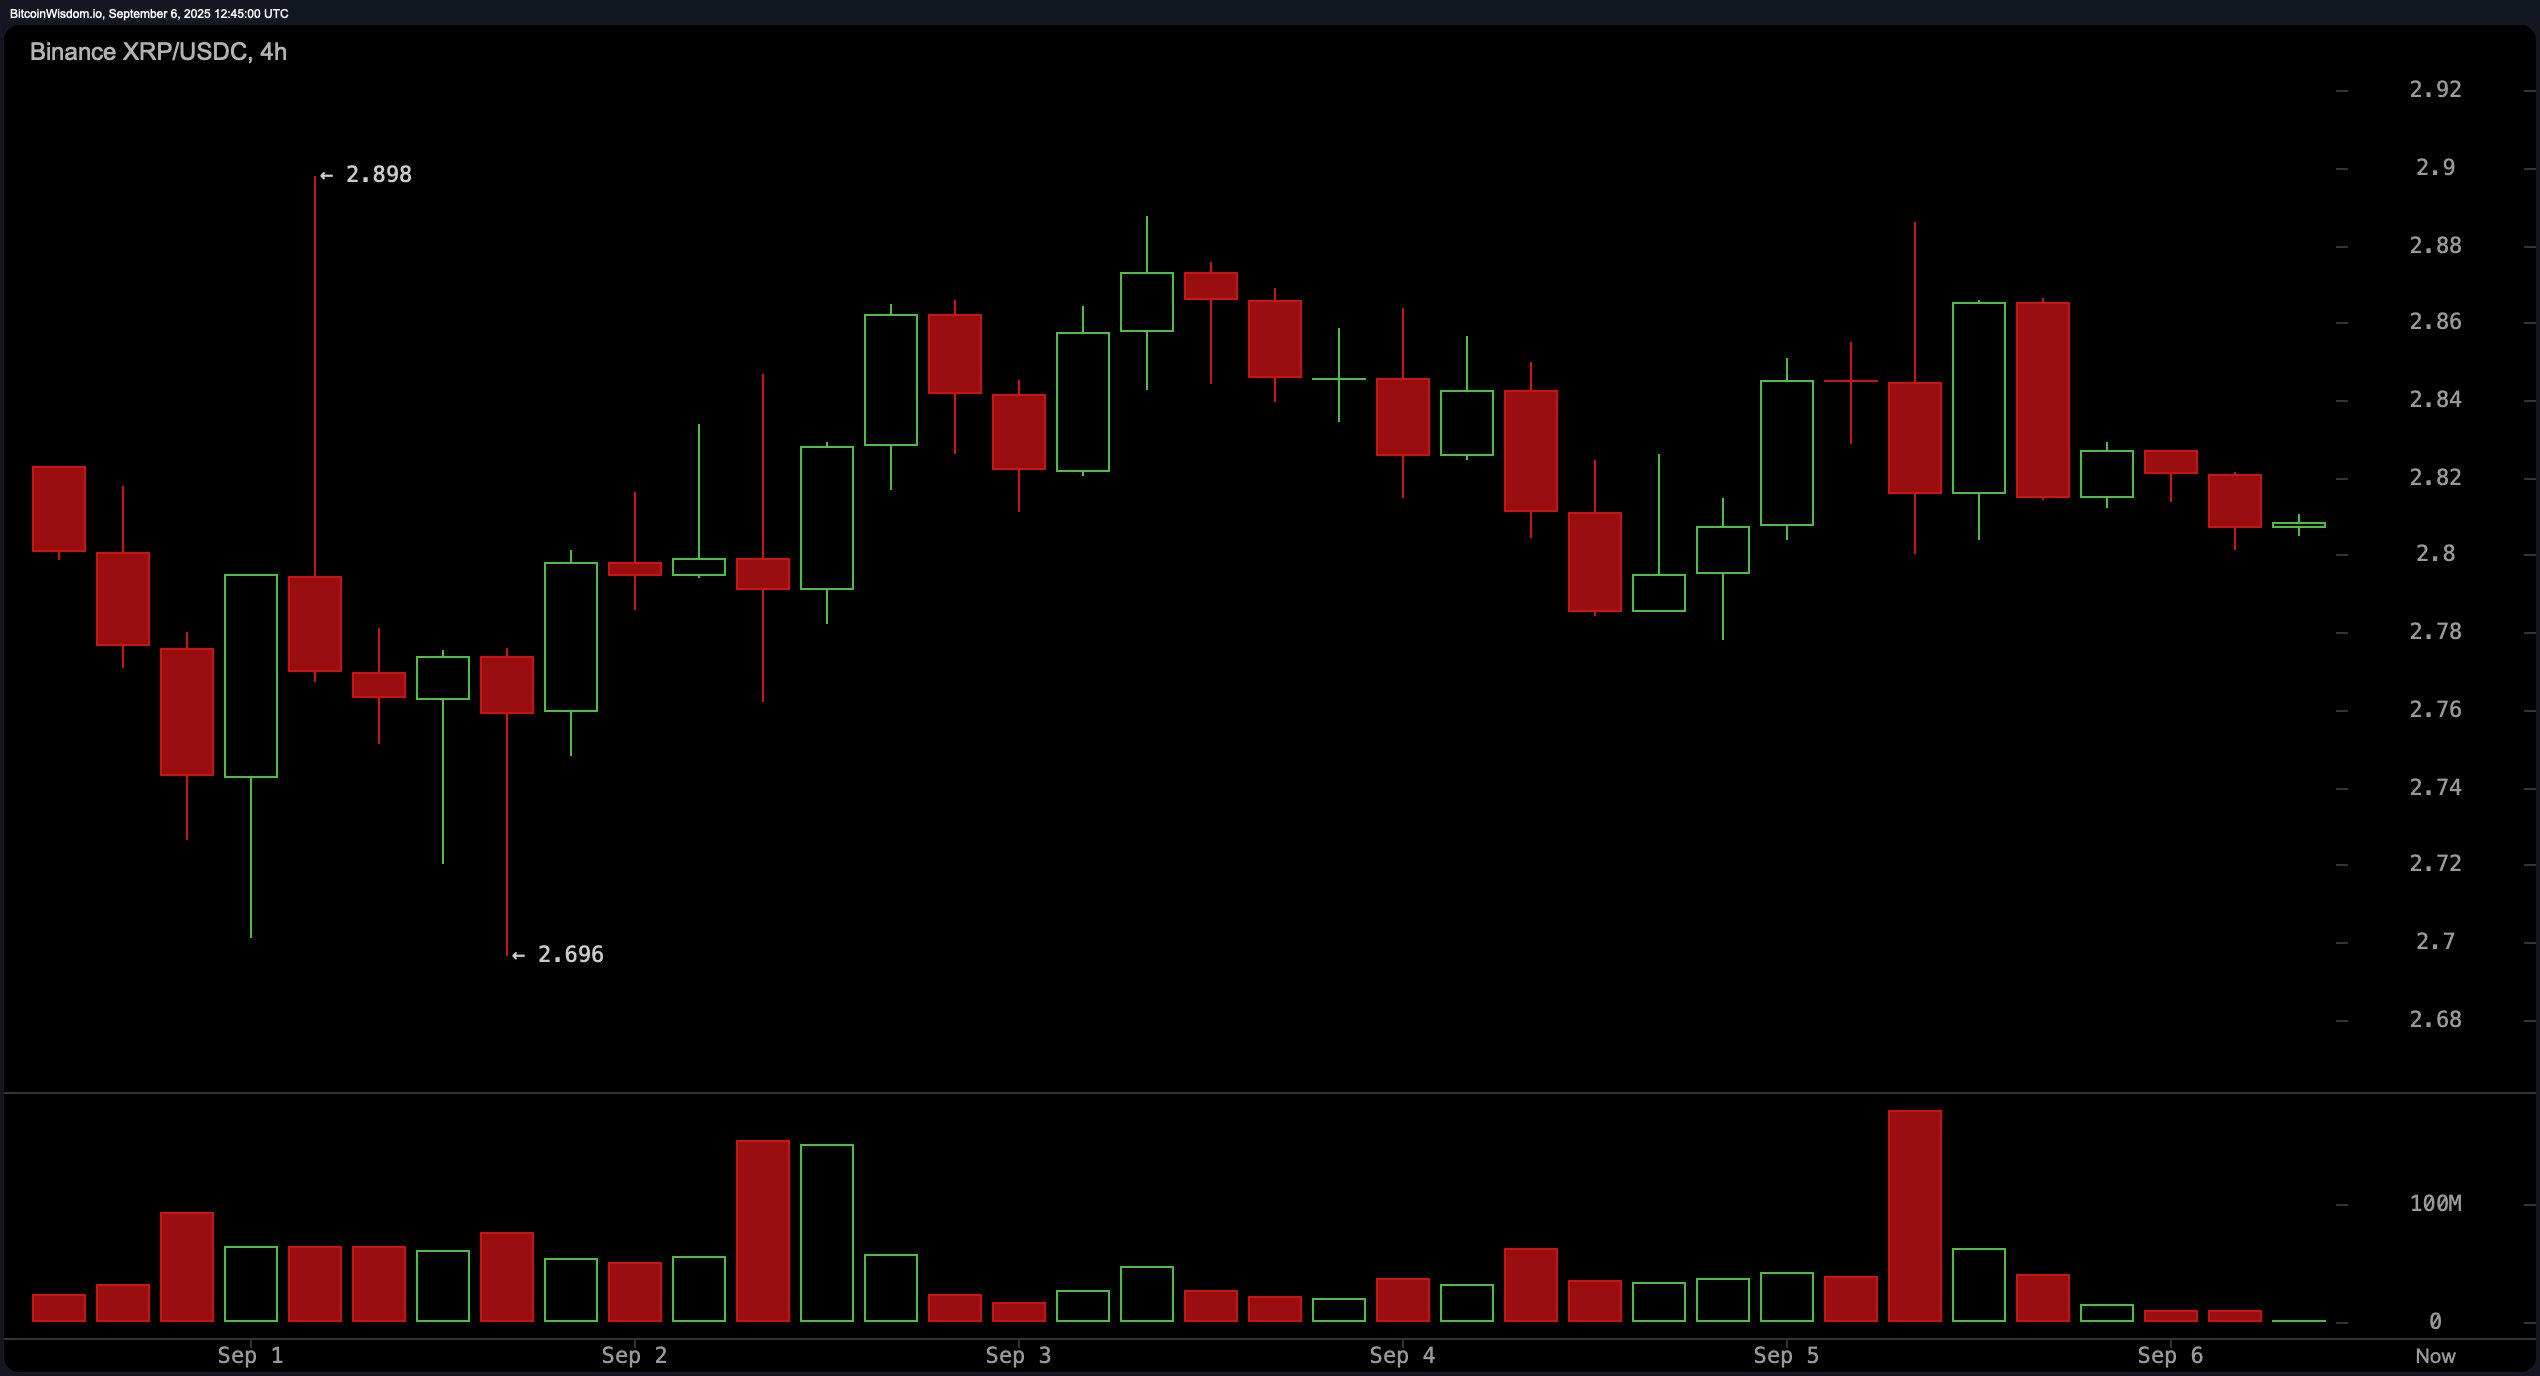
The 4-hour chart is a masterclass in neutrality, with XRP capped at $2.898 like a lid on a boiling pot. 🤕 The candles are so small they could be mistaken for ants arguing over crumbs. The volume spike on Sept. 5? That was probably just the market whispering, “Let’s distribute this to the choir and call it a day.” Resistance zones at $2.85-$2.88 are like a bouncer at a nightclub-strict and unimpressed. If you want to break through, bring a doji formation and a bigger wallet. 🚨
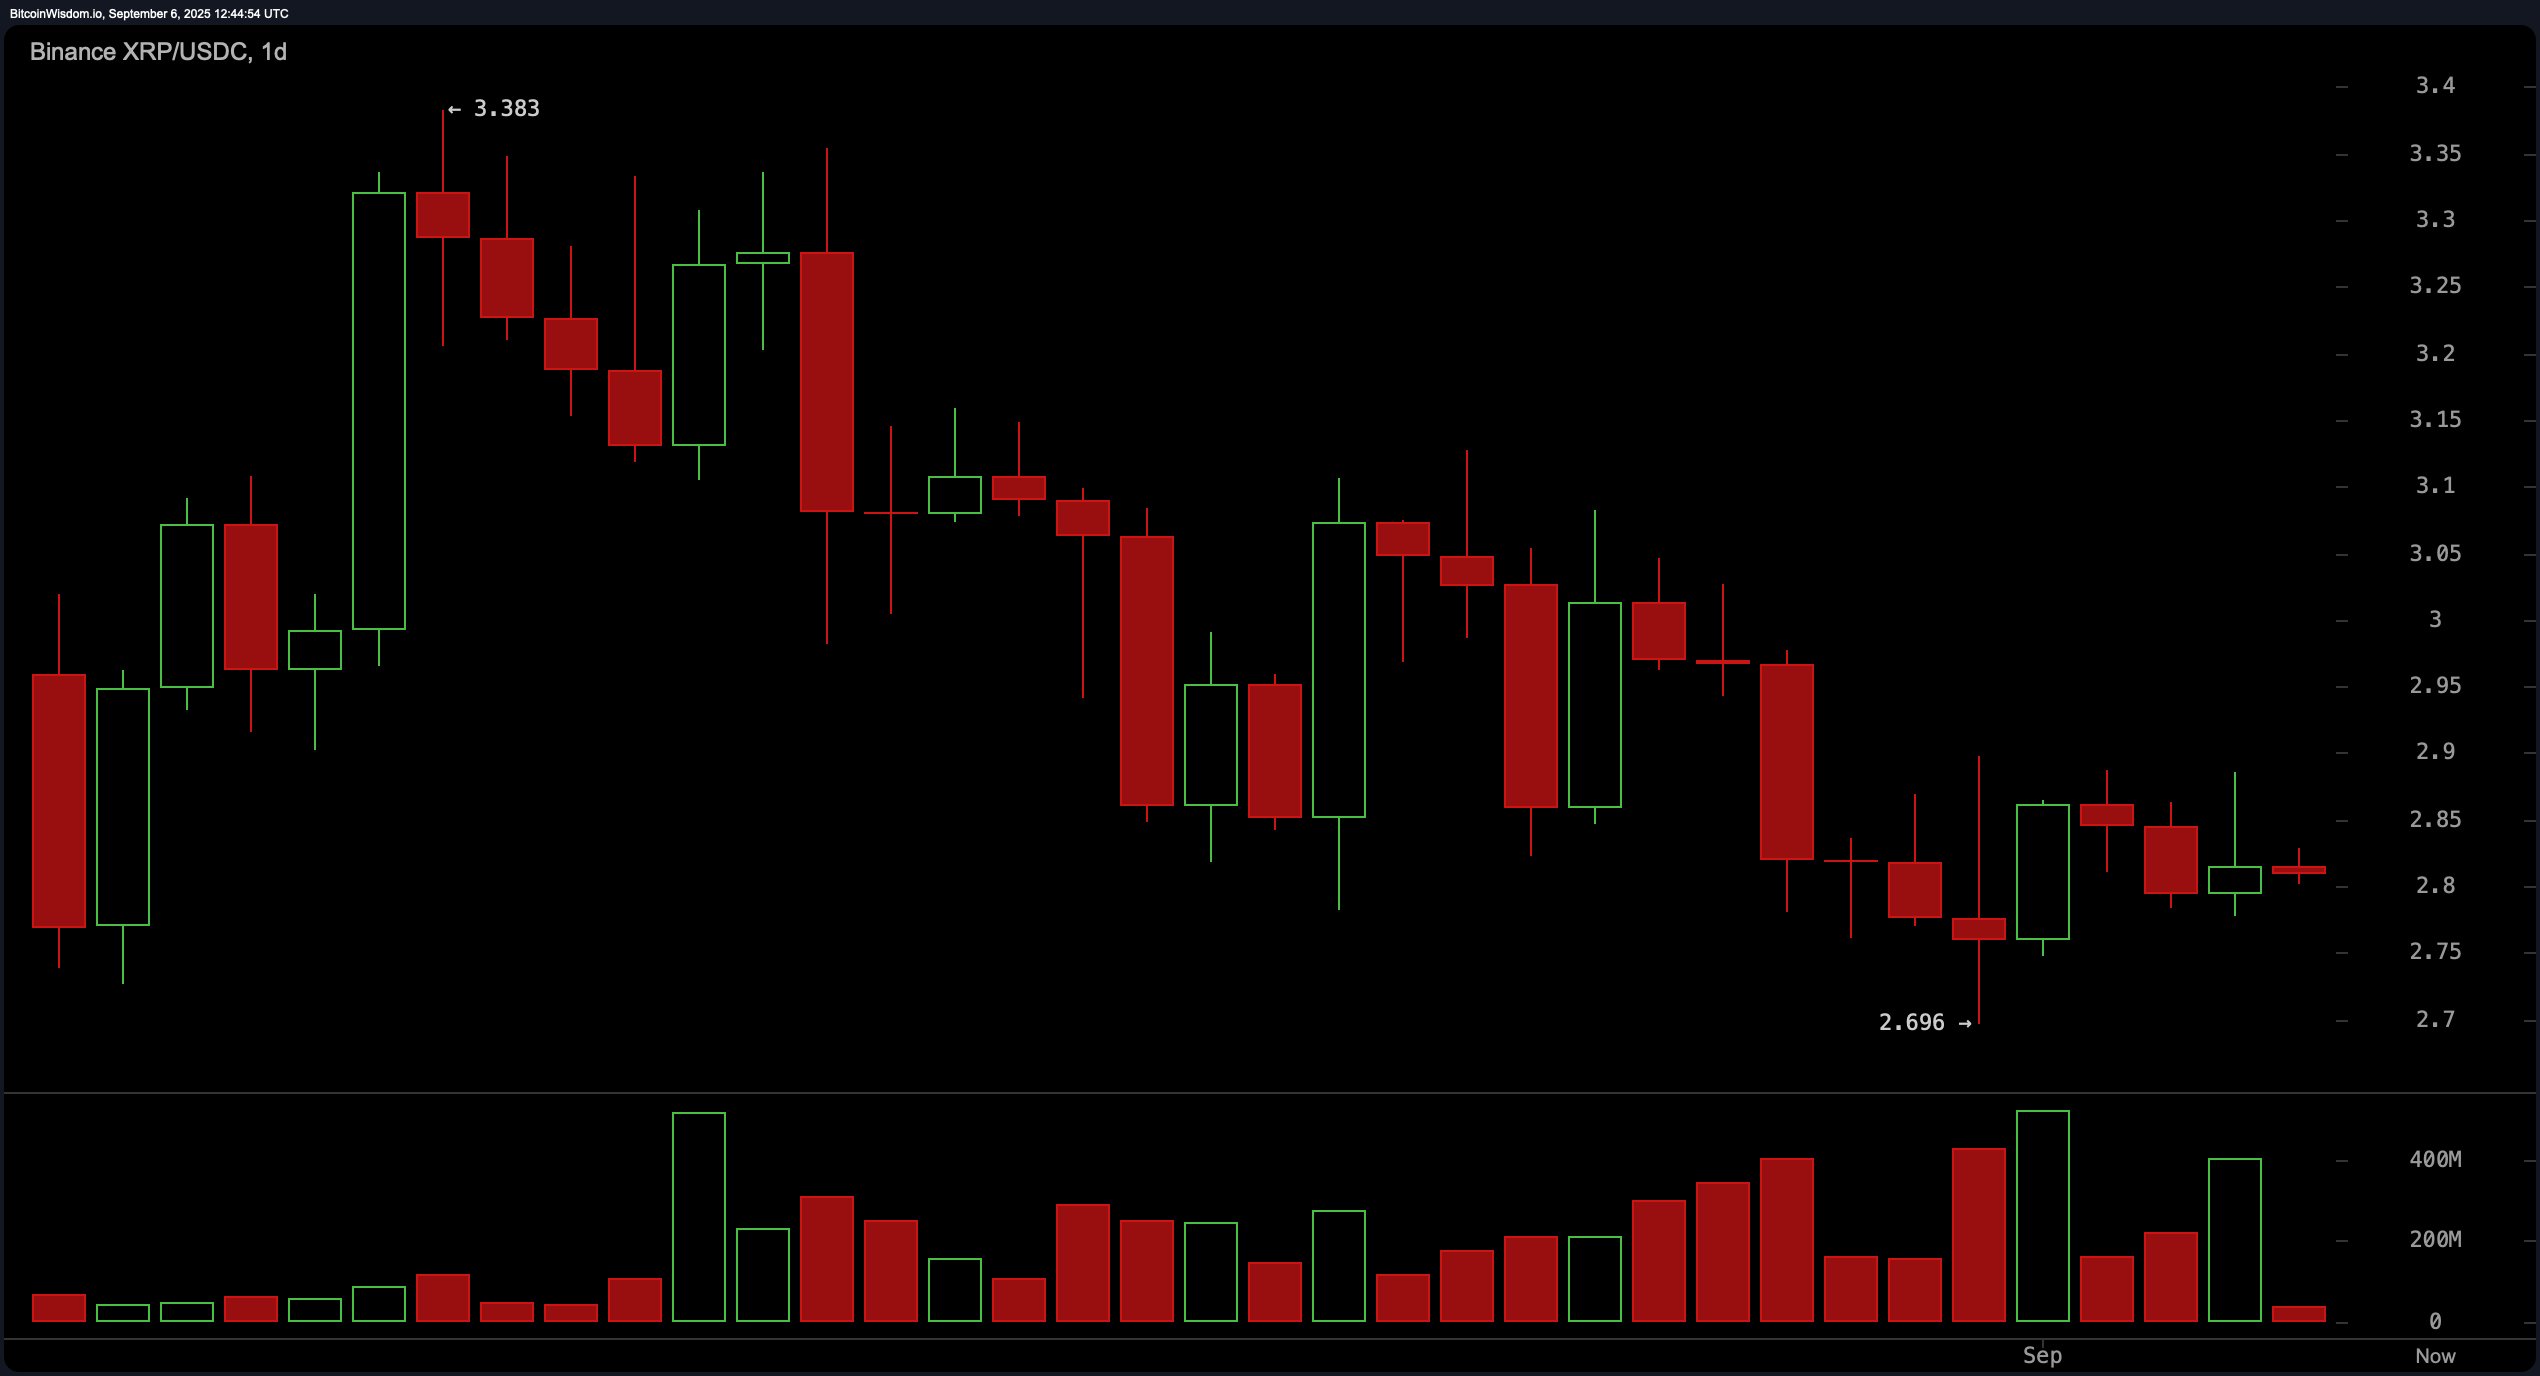
XRP’s daily chart is a sad tale of a macro downtrend, with lower highs and lower lows that could make a pessimist weep. 🐻 The price is inching toward a support zone of $2.70-$2.75, which is either a trap or a lifeline-depends on whether the market feels like playing 20 questions. Volume has tapered off like a deflating balloon 🎈, which might mean sellers are out of gas. Resistance at $2.95-$3.05? That’s where the ghosts of failed bounces haunt traders. Break above $2.90 with volume, or just accept the bear hug. 🤗
Oscillators are throwing a mixed party-RSI at 43.43 and Stochastic at 25.55 scream “no momentum,” while the CCI and ADX are just there for the snacks. 🍕 The Awesome oscillator is mildly negative, and the MACD is bearish enough to make a grizzly blush. The only positive sign? The momentum indicator at -0.161, which is like a faint heartbeat in a morgue. Traders, if you’re going to trade, at least bring volume and candlestick patterns-this is a ghost town. 👻
Moving averages are the market’s emotional support indicators. Short-term EMAs and SMAs are bearish like a rainy day in Manchester. 🌧️ But the 100-period and 200-period MAs are clinging to a bullish hope at $2.77 and $2.48, respectively. It’s like the market is saying, “I’m fine, really,” while slowly sinking into quicksand. The only thing keeping this from being a complete disaster is the potential for volume to return-fingers crossed for a miracle. 🤞
Bull Verdict:
If XRP holds above $2.75 and gets a bullish candlestick pattern with volume to match, it could rebound toward $2.95-$3.05. A breakout above $2.90 with rising momentum would be the crypto equivalent of a standing ovation. 🎶 Just don’t forget to confirm it with those long-term moving averages-no false hope allowed.
Bear Verdict:
If XRP crashes below $2.69 with volume, it’s time to dust off the bear flag. 🐻 The short-term trend is bearish enough to make a grizzly jealous, and the MAs are all in on the downward spiral. Unless some mysterious buyers show up, this could be the start of a very long winter. ❄️
Read More
- What Song Is In The New Supergirl Trailer (& What It Means For The DC Movie)
- Gold Rate Forecast
- Eurogamer Gives ARC Raiders 2/5 Over AI Voices, Dropping Metacritic Score from 94 to 84
- 10 Best Connie Episodes of King of the Hill
- 7 Most Anticipated Horror Shows of 2026, Ranked by Excitement
- Lost Soul Aside Gets New Update With Gameplay Optimisations, Performance Improvements
- 7 Classic TV Shows With Criminally Low Rotten Tomatoes Scores
- Spider-Man 4 Rumor Roundup Reveals Sadie Sink’s Role With Power Change & More
- Designing Magnetism with Molecular Architecture
- Crimson Desert – 15 Things I Wish I Knew Before Diving In
2025-09-06 17:18