- Bitcoin‘s $100k resistance puts bulls in a pickle 🥒
- Heatmaps reveal critical liquidation zones for BTC, ETH, BNB, and ADA that could trigger volatility.
The market is currently experiencing a period of slowed price movement, with key coins like Bitcoin [BTC], Ethereum [ETH], Binance Coin [BNB], and Cardano [ADA] at the center of attention.
Recent data shows many traders holding long positions, contributing to the current price stagnation. Analyzing heatmaps and liquidation levels can provide insights into potential market shifts.
Bitcoin: The impact of predominant long positions
At press time, Bitcoin is trading at approximately $97k. Despite a strong bullish narrative, Bitcoin faces significant resistance at the $100,000 psychological barrier.
Recent data highlights a market heavily skewed toward long positions, a dynamic that could be contributing to the stagnation in price action.
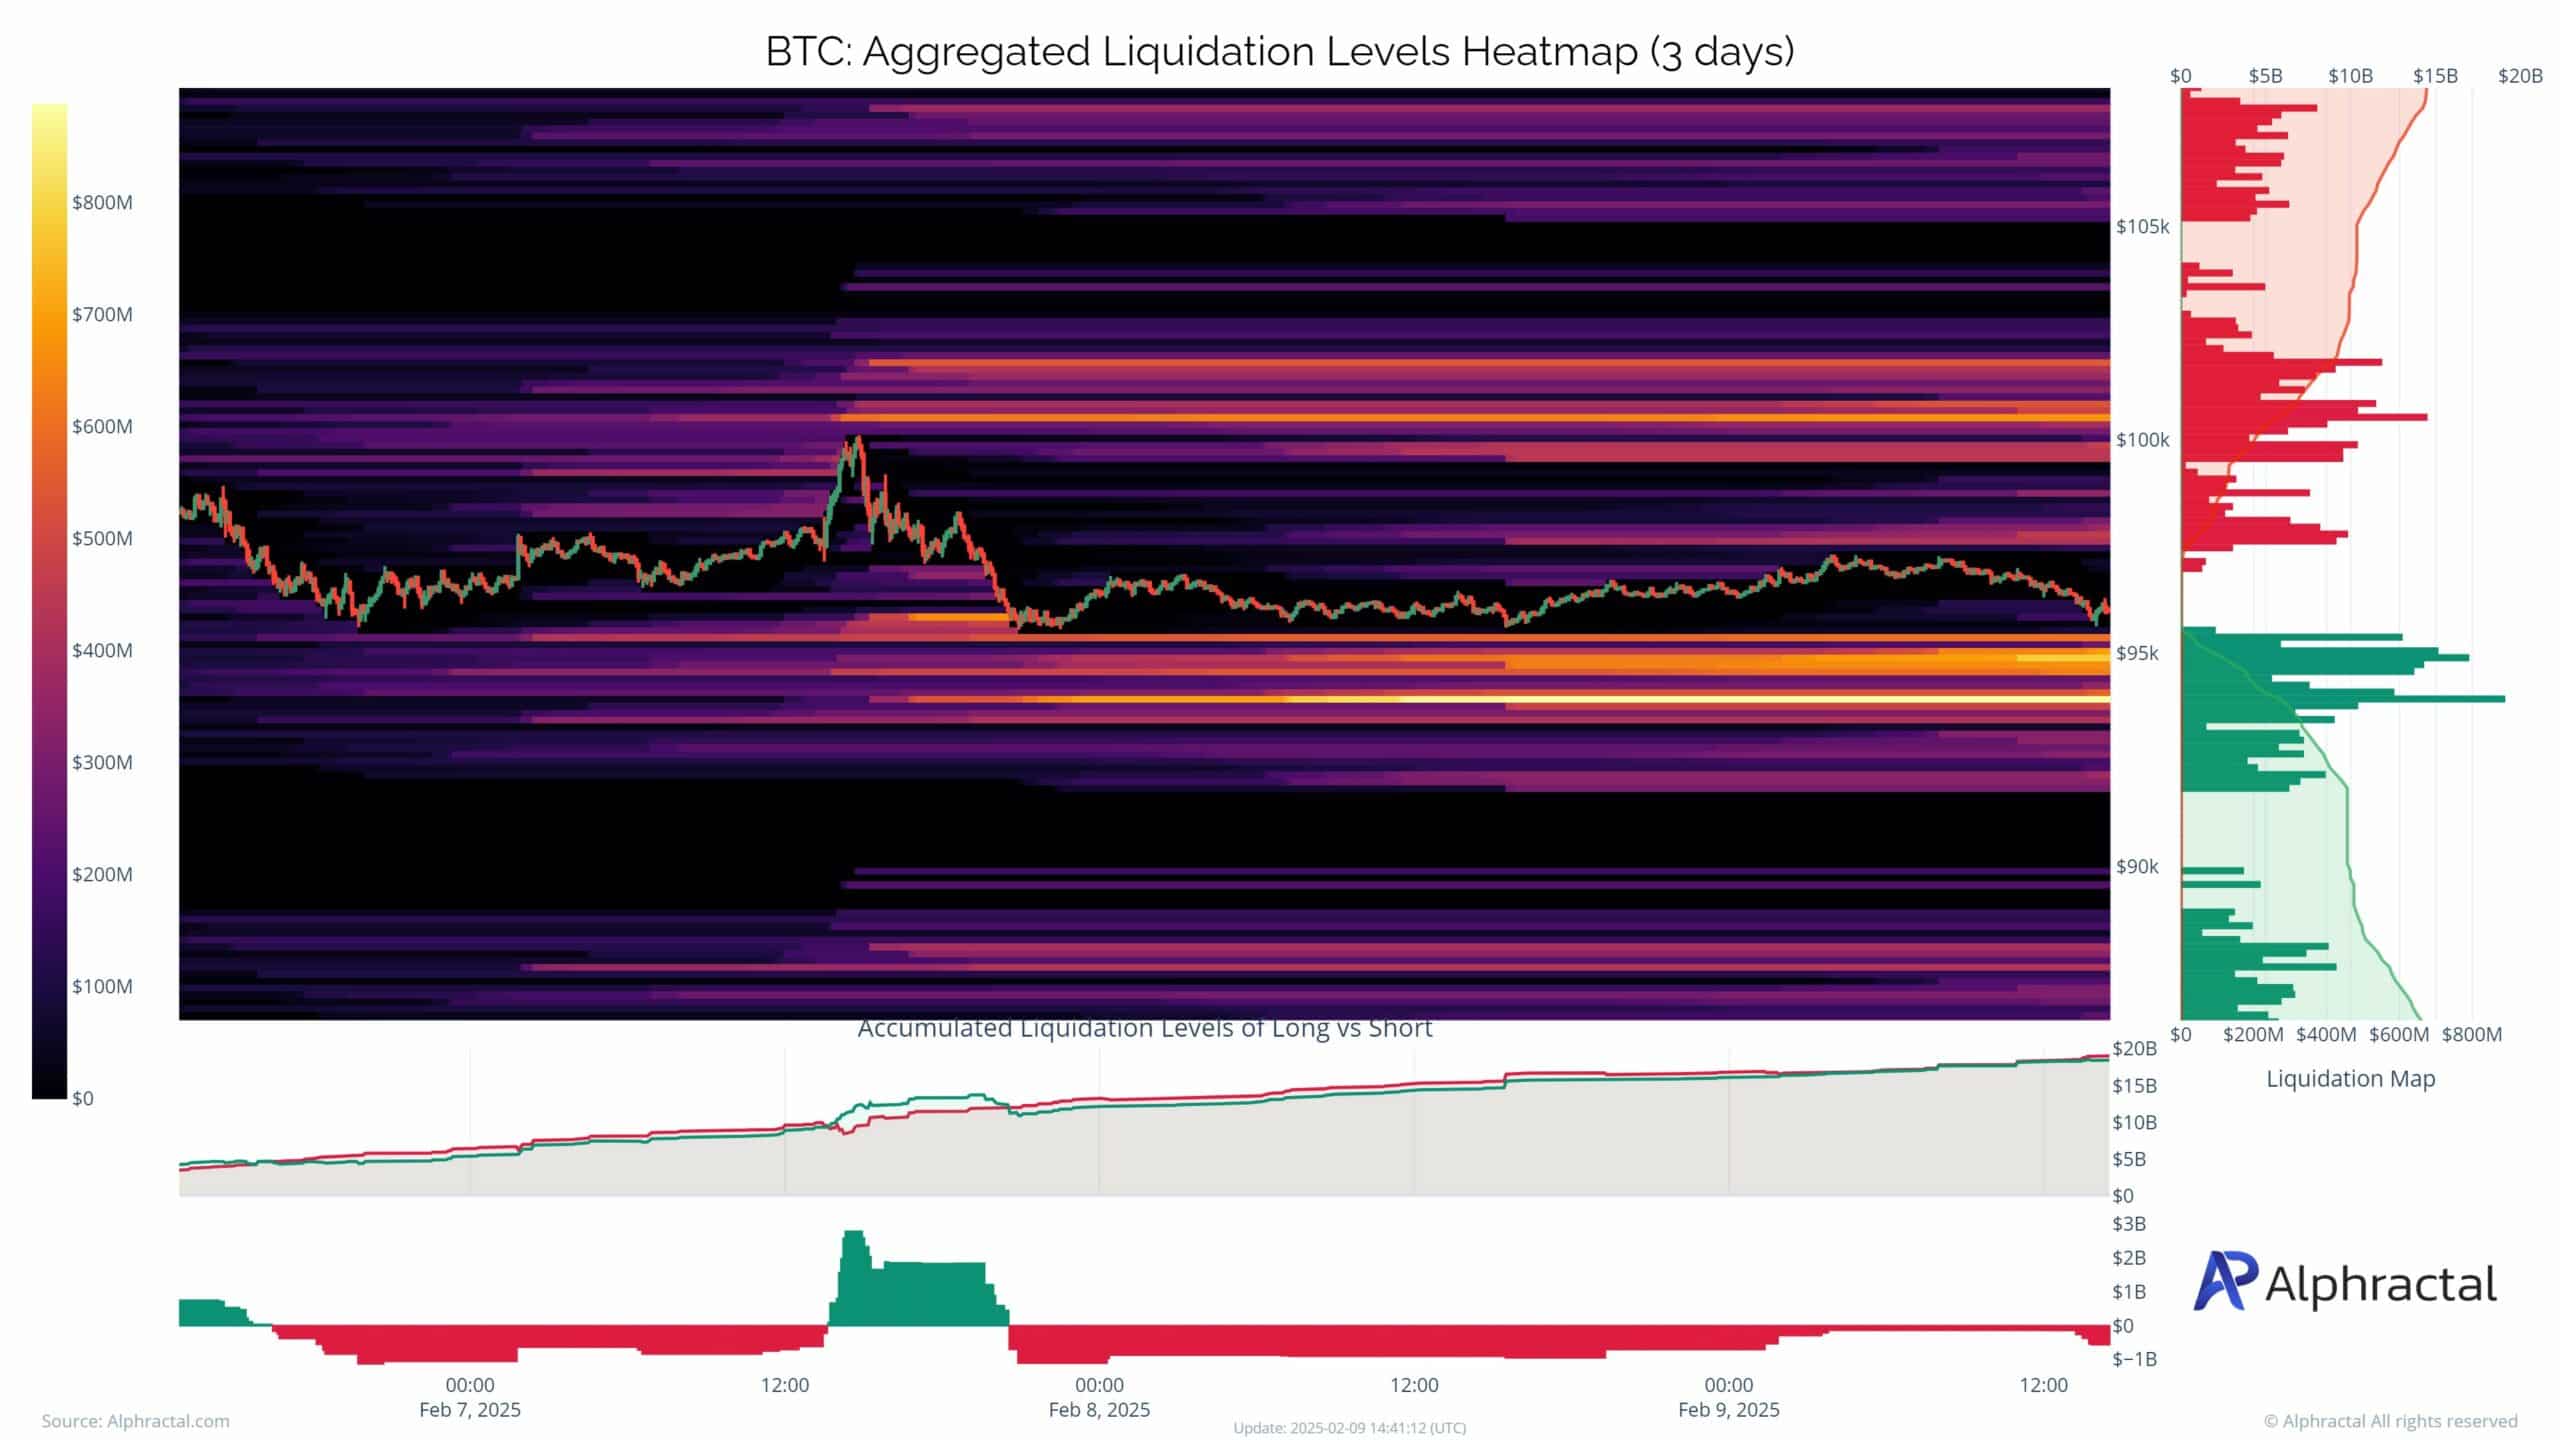
The liquidation heatmap provides a clearer picture of the market’s current state. It shows dense clusters of potential liquidation levels near $100,000, with a significant accumulation of liquidations around $95,000 on the downside.
These zones are critical as they represent areas where abrupt price movements could be triggered by forced liquidations, amplifying volatility.
In the short term, breaking the $100,000 resistance remains essential to sustaining Bitcoin’s bullish momentum.
However, failure to hold above the $95,000 support level could push prices toward the $92,000 range, where further liquidation zones could intensify bearish pressure.
Traders should closely monitor these key levels to anticipate shifts in market dynamics.
ETH liquidation zones: A cascade waiting to happen?
The Ethereum heatmap reveals significant clusters of liquidation levels concentrated around the $2,700 to $2,800 range for long positions and near $2,500 for shorts.
These zones represent areas of heightened vulnerability, where price movements could trigger a cascade of liquidations, amplifying volatility.
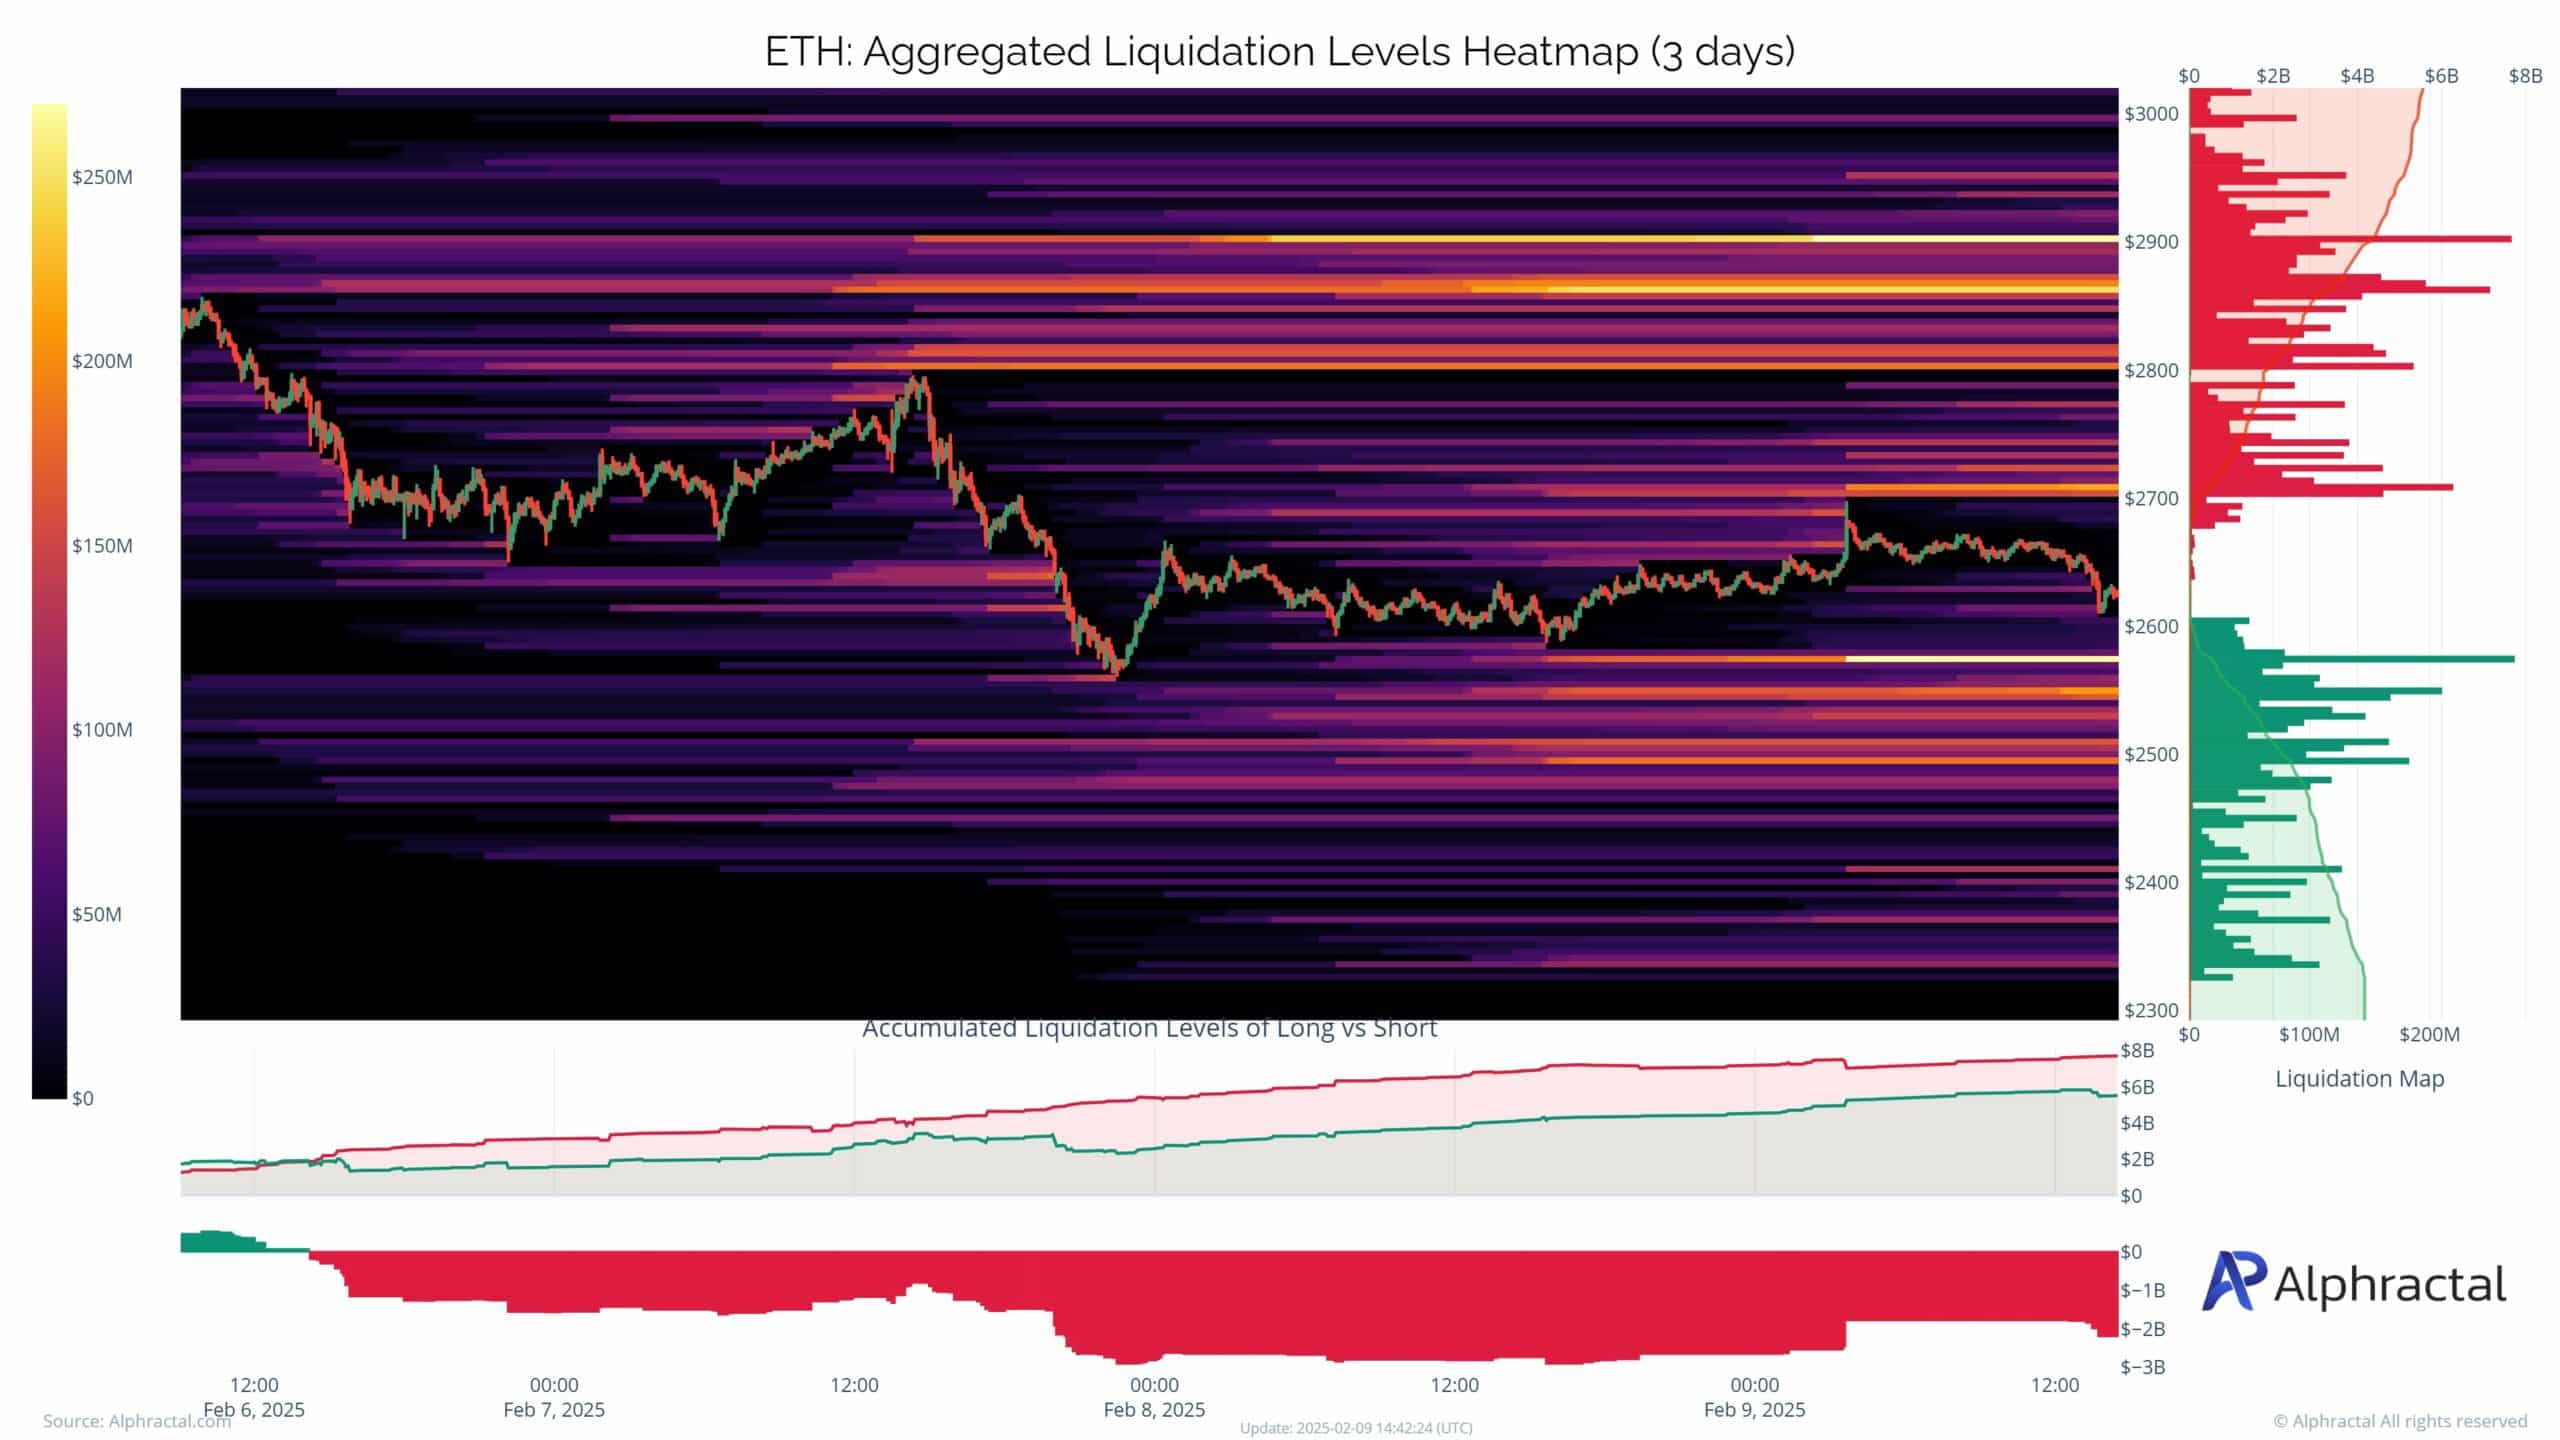
Notably, the liquidity map suggests a gradual buildup of sell-side pressure as prices approach the $2,700 mark, with substantial activity evident in the $2,800 zone.
On the downside, shorts remain heavily concentrated below $2,500, indicating robust support for ETH unless broader market sentiment shifts.
This dynamic creates a narrow trading band for ETH, with liquidations potentially acting as the catalyst for a breakout or breakdown.
BNB’s market stalemate
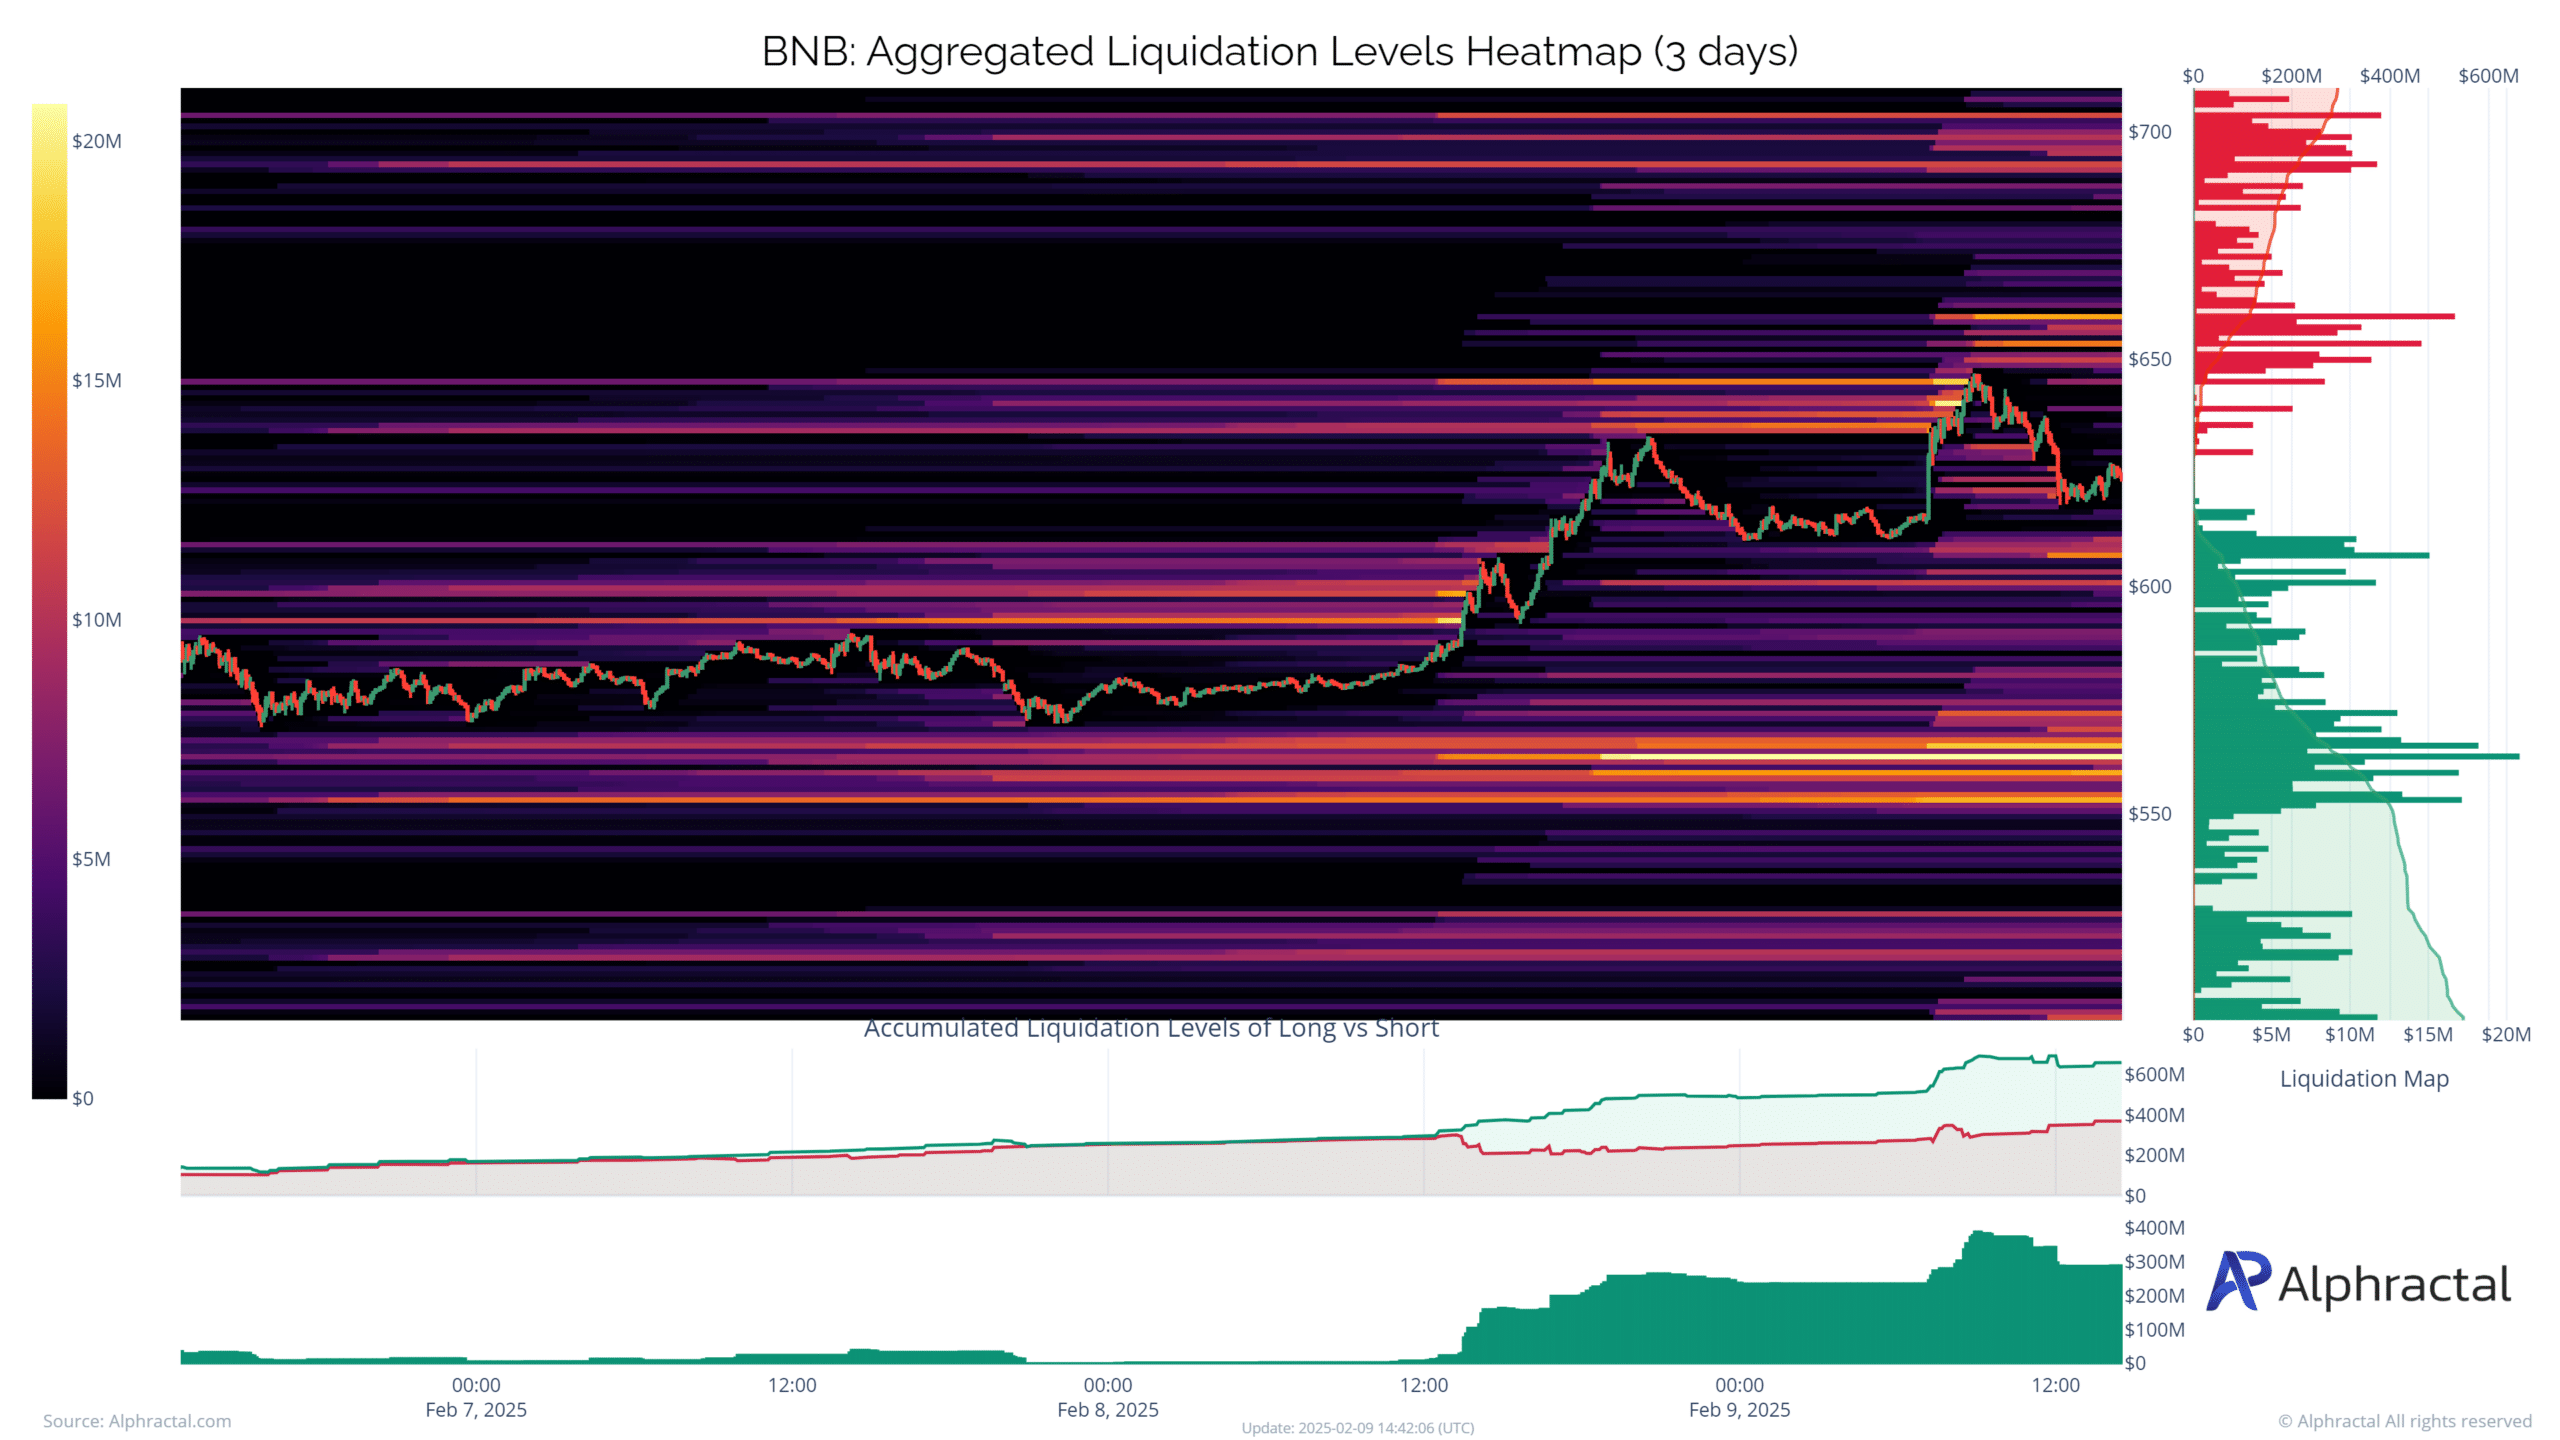
The BNB liquidation heatmap highlights concentrated activity at $650 for longs and $600 for shorts, creating a tight trading range. The buildup of liquidation levels above $650 suggests strong resistance, while dense short clusters near $600 indicate support.
Despite recent price stagnation, any decisive move could trigger a cascade of liquidations, intensifying volatility. A break above $650 may fuel bullish momentum, while a slip below $600 could lead to rapid downside movement as shorts get liquidated.
With liquidity imbalances on both sides, BNB appears primed for a strong directional move.
Read Bitcoin’s [BTC] Price Prediction 2025–2026
Cardano’s support and risk zones: A squeeze on the horizon?
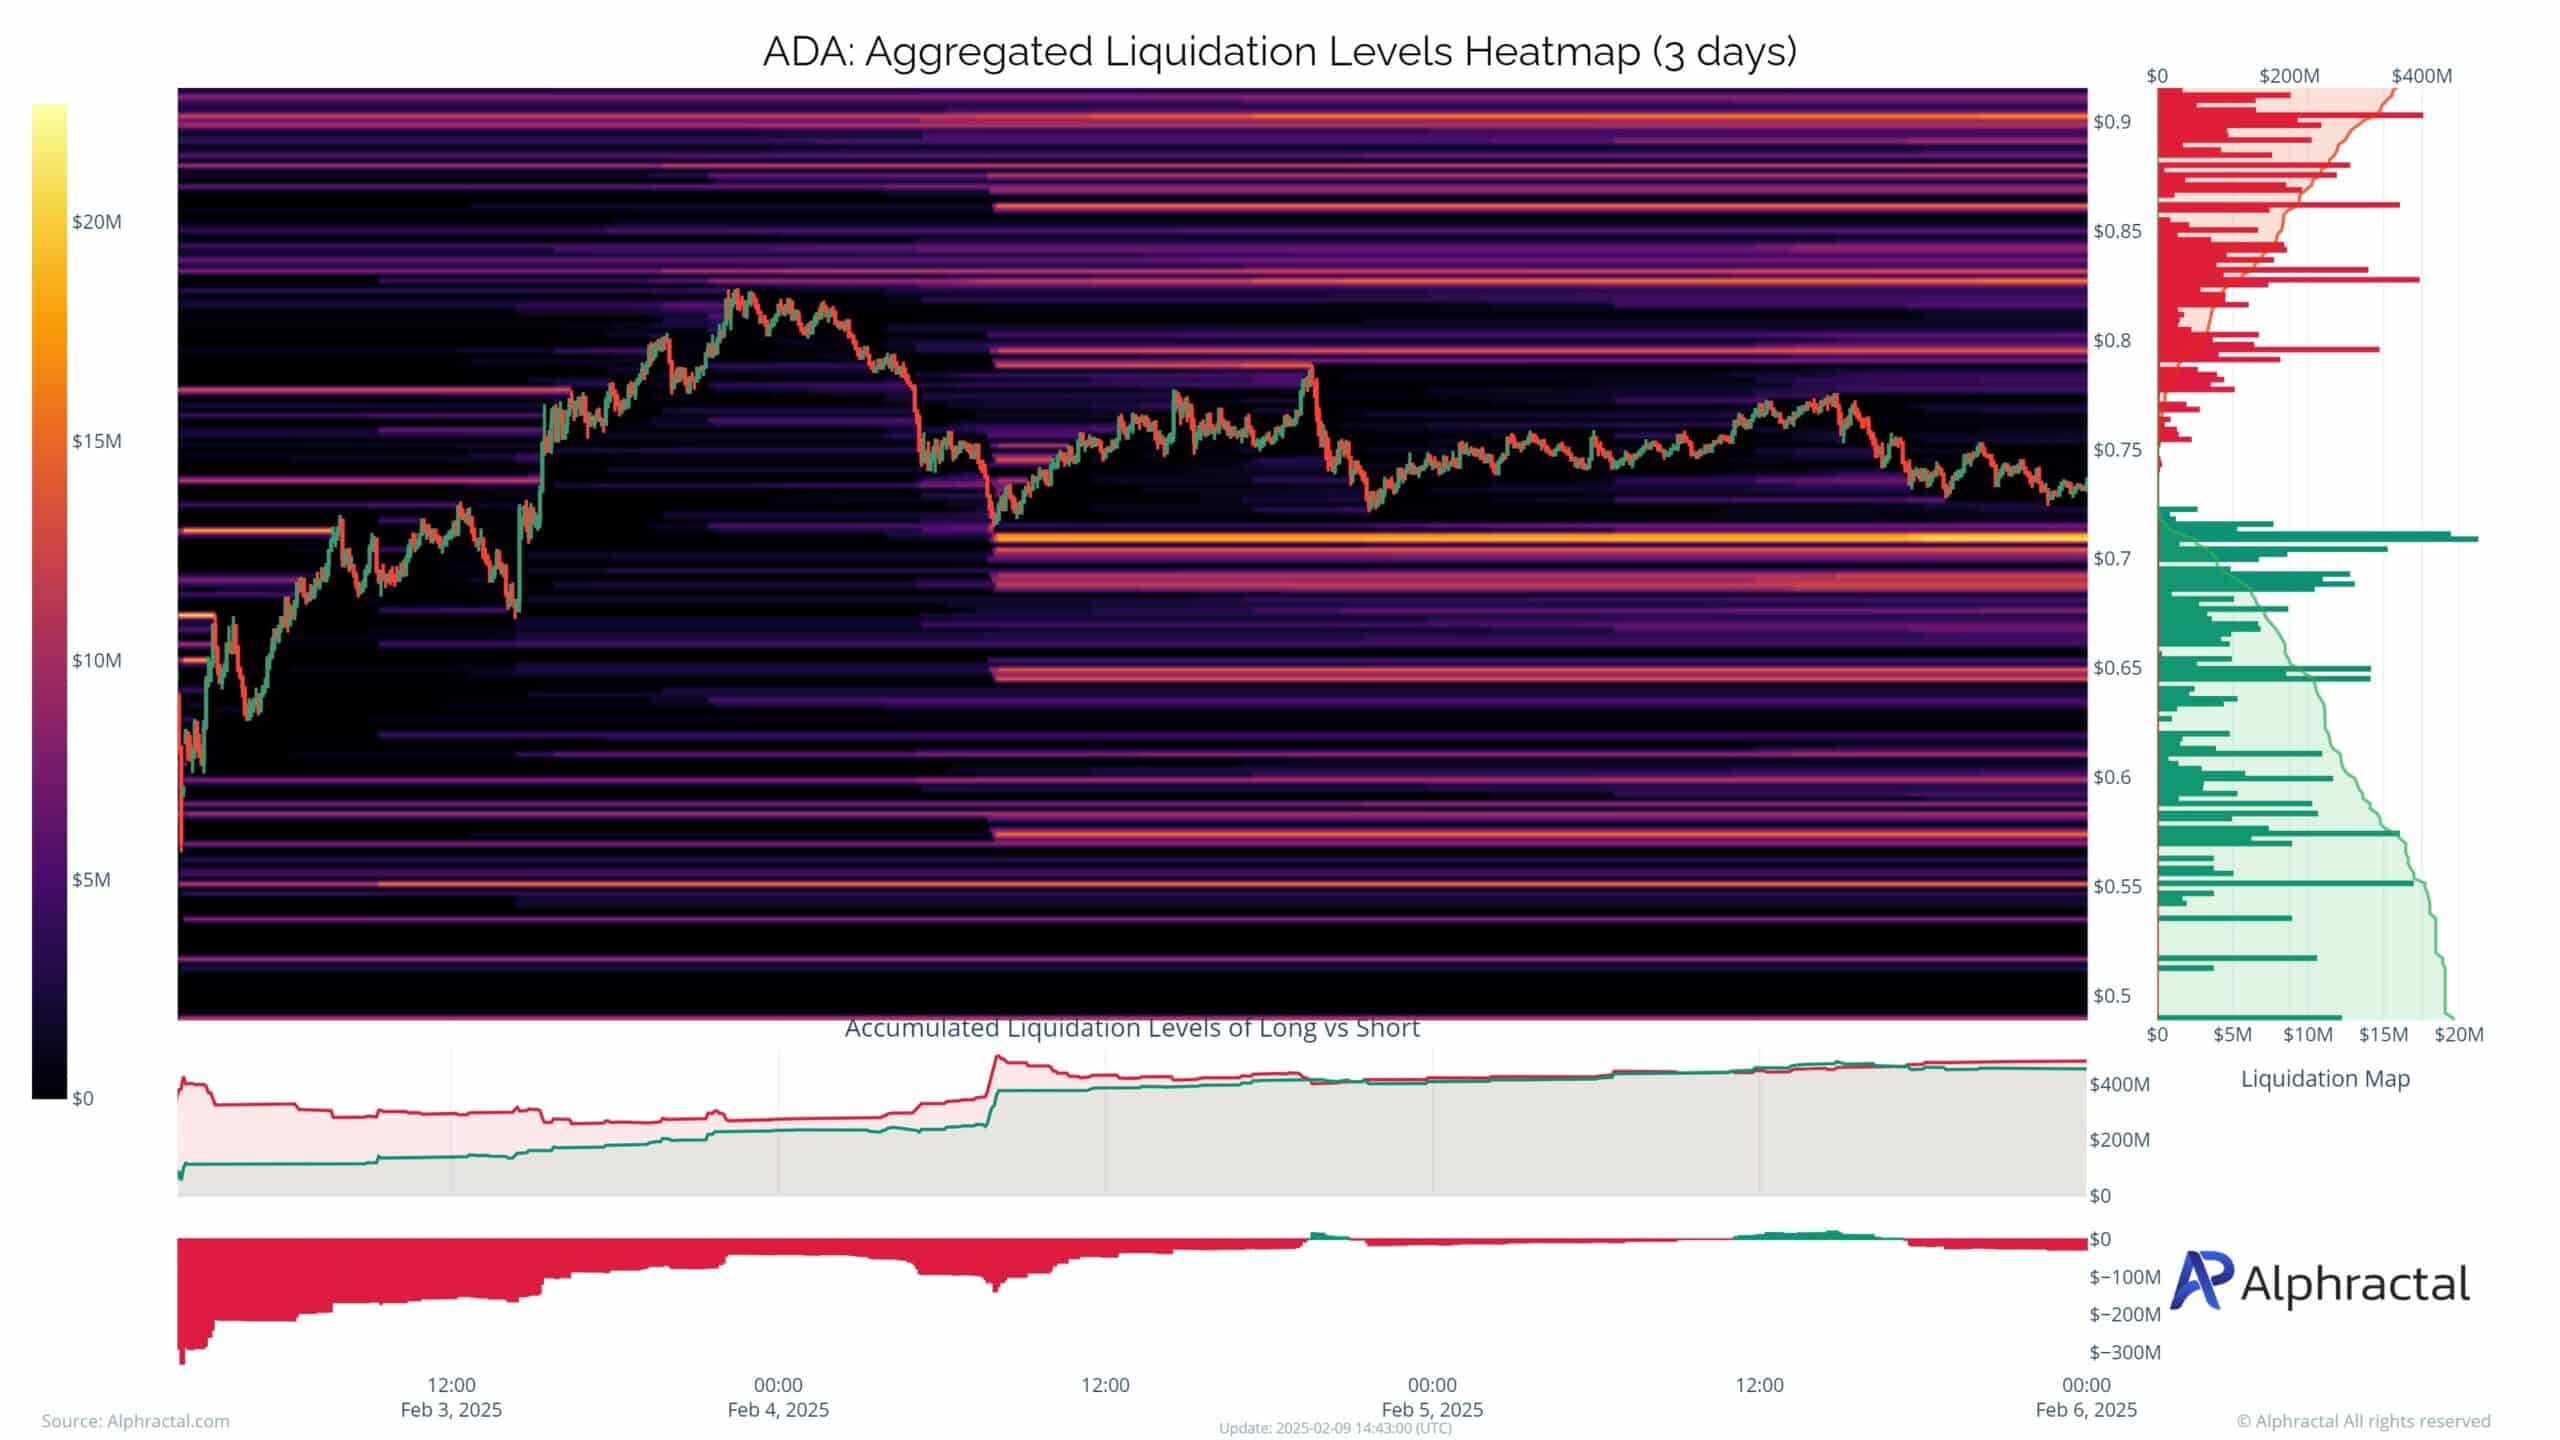
The ADA liquidation heatmap shows substantial support near $0.70, where significant long positions are concentrated.
This indicates a safety net for ADA in case of downward pressure. However, the high density of longs around this level could make it a risk zone if the price dips further, triggering a cascade of liquidations.
Resistance builds near $0.90, limiting immediate upside potential. If ADA experiences sharp sell-offs, the $0.70-$0.65 range becomes a potential squeeze zone, where forced liquidations may intensify downward momentum.
Conversely, holding this level could reinforce bullish sentiment, setting the stage for a rebound toward $0.85 and beyond.
Read More
- Gold Rate Forecast
- PI PREDICTION. PI cryptocurrency
- Rick and Morty Season 8: Release Date SHOCK!
- Discover Ryan Gosling & Emma Stone’s Hidden Movie Trilogy You Never Knew About!
- Masters Toronto 2025: Everything You Need to Know
- We Loved Both of These Classic Sci-Fi Films (But They’re Pretty Much the Same Movie)
- Mission: Impossible 8 Reveals Shocking Truth But Leaves Fans with Unanswered Questions!
- SteelSeries reveals new Arctis Nova 3 Wireless headset series for Xbox, PlayStation, Nintendo Switch, and PC
- Discover the New Psion Subclasses in D&D’s Latest Unearthed Arcana!
- Linkin Park Albums in Order: Full Tracklists and Secrets Revealed
2025-02-10 22:21