Ah, the charts-those cryptic runes of modern finance-are whispering again. This time, they speak of a multi-year dance within a symmetrical triangle, a cosmic waltz between buyers and sellers. Momentum indicators nod approvingly, hinting at a bullish setup, though confirmation remains as elusive as a snowflake in summer. 🤔❄️
The Triangle of Destiny: A Breakout Looms?
A chart shared by Galaxy (@galaxyBTC) reveals a pattern so dramatic it could rival a Russian novel. Since 2021, Chainlink (LINK) has been trapped in a symmetrical triangle, oscillating between hope (higher lows) and despair (lower highs). The tightening wedge resembles a coiled spring, ready to launch-or snap. 🪢💥
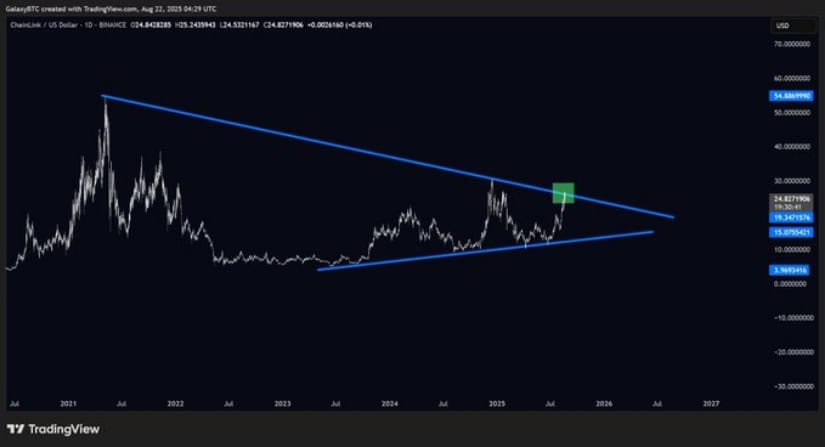
Currently, LINK is flirting with the upper boundary of this triangle, like a suitor unsure whether to commit. Despite broader market softness, buying interest persists, showcasing LINK’s resilience. Galaxy notes its strength during dips, a rare gem in the volatile altcoin sea. If it breaks above resistance, a rally toward $30-$35 beckons. But failure? Oh, that could mean another year of treading water. 🏊♂️💧
Liquidity Galore: A Market That Won’t Quit 💸
BraveNewCoin’s 24-hour chart shows LINK trading at $24.82, down 3.67% after a brief rally to $26. Profit-taking? Predictable. Yet, with a market cap of $16.79 billion and daily volume of $1.84 billion, LINK’s liquidity is as robust as ever. Buyers have stepped in around $24.50, preventing deeper declines. It’s almost as if the market knows something we don’t. 🤫🧐

This controlled retracement hints at confidence in LINK’s role as a decentralized oracle provider. Price floors are reinforced by a circulating supply of 678 million tokens. Near-term resistance at $25.50-$26.00 will decide whether the upward momentum continues or fizzles out like a damp firework. 🎆🌧️
Bullish Momentum: Can LINK Keep Its Cool? 🐂✨
On TradingView, Bollinger Bands and MACD indicators paint a picture of cautious optimism. LINK trades near $24.87, nestled between the midline ($21.77) and the upper band ($28.19). Its proximity to the upper band suggests bullish control, but overextension looms like an unwelcome guest. 🚪🙃

Recent price action peaked at $26.89 before retreating mildly. The MACD line (2.04) hovers above the signal line (1.84), with a green histogram signaling sustained buyer momentum. Support at the Bollinger midline ($21.77) is critical-if breached, deeper retracement toward $15.35 could spell trouble. But for now, the bulls hold sway. 🐂💪
In conclusion, Chainlink stands firm, its price bolstered by accumulating bullish momentum. The $30 target looms large, with market participants watching like hawks-or perhaps more like anxious squirrels hoarding acorns. Will LINK break free, or remain shackled in consolidation? Only time-and volume-will tell. ⏳📊
Read More
- GBP CNY PREDICTION
- Elon Musk’s Mom Maye Musk Shares Her Parenting Philosophy
- Forza Horizon 6 Car List So Far: Confirmed Highlights, Cover Cars, DLC, and Rewards
- 10 Greatest Manga Endings of All Time
- Elon Musk’s Ex Ashley St. Clair Reveals When Romance Became “Weird”
- 38 Years Later, Murder, She Wrote’s Most Overlooked Episode Still Pulls Off TV’s Greatest Crossover
- Mark Zuckerberg & Wife Priscilla Chan Make Surprise Debut at Met Gala
- Hollow Knight: Silksong Guide – All 30 Lost Flea Locations
- 20 K-Dramas That Nailed the Perfect Ending
- A Major PlayStation Delisting Exposes a Sony Problem
2025-08-22 22:04