FFXIV just released the worst Online Store microtransactions I’ve ever seen — the set costs more than Dawntrail itself, and players have had enough
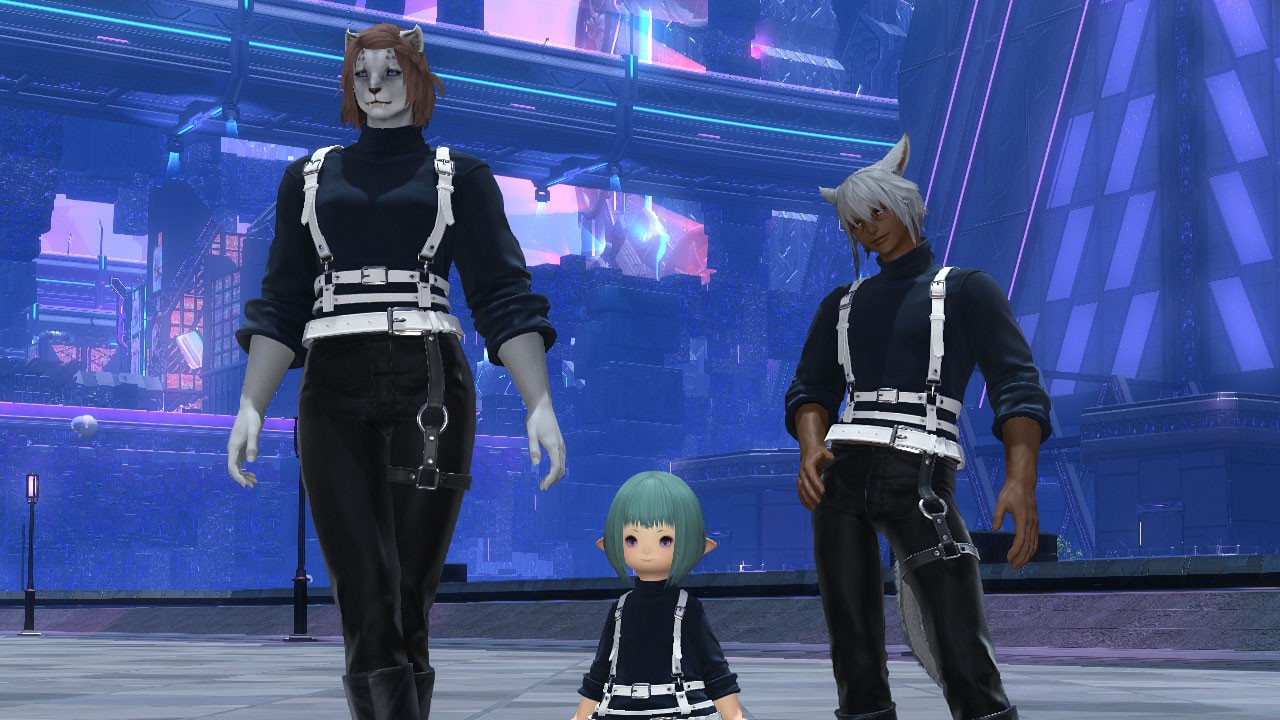
I’m talking about the new Belt-Leather Outfit collection recently added to the FFXIV Online Store marketplace. This set consists of three options: trousers, a cropped version, and another purchase that includes a hat and gloves. The outfit appears quite appealing, although it might seem somewhat basic; the combination of a turtleneck sweater and a leather harness, along with leather pants and shoes, makes for a stylish ensemble.