So, it seems Bitcoin (BTC) traders have decided that the future is bright – so bright, in fact, they’re stacking long positions by more than three to one, according to the esteemed seers over at Coinglass. The forecast? Bullish conviction is solidly parked around $77,500, but beware: when it comes to forced selling, it’s a sharp pullback that really gets the party started.
In this lopsided game of financial Twister, open interest in BTC perpetuals has slid about 6% to a cozy 744,300 BTC over the last 24 hours. Traders are slowly trimming their leverage like a bad haircut, yet the long bias remains stubbornly entrenched across major venues, as if they’ve all collectively decided to ignore the impending doom.
The Long Bias Meets the Great Wall of Stalling Prices
In a dramatic twist worthy of a soap opera, Bitcoin failed to break through the $80,000 barrier earlier this week and is now languishing near $77,500, according to our friends at Yahoo Finance. But don’t count the long-side conviction out just yet – it appears to be as unshakeable as a toddler refusing to eat broccoli. The long/short ratio on Coinglass still proudly displays more than three longs for every short.
History has a funny way of reminding us that extreme imbalances often foreshadow contrarian moves. Crowded trades on one side are like fuel to a fire waiting for a spark, and let’s just say the market loves a good fit of volatility.
On April 25, Coinglass recorded a staggering $22.44 million in long liquidations against a mere $11.60 million on the short side. This two-to-one wipeout suggests the bulls are swallowing more pain than a contestant on a game show chugging down hot sauce. Yet, despite the grim stats, account-level positioning remains heavily long – apparently, denial is not just a river in Egypt.
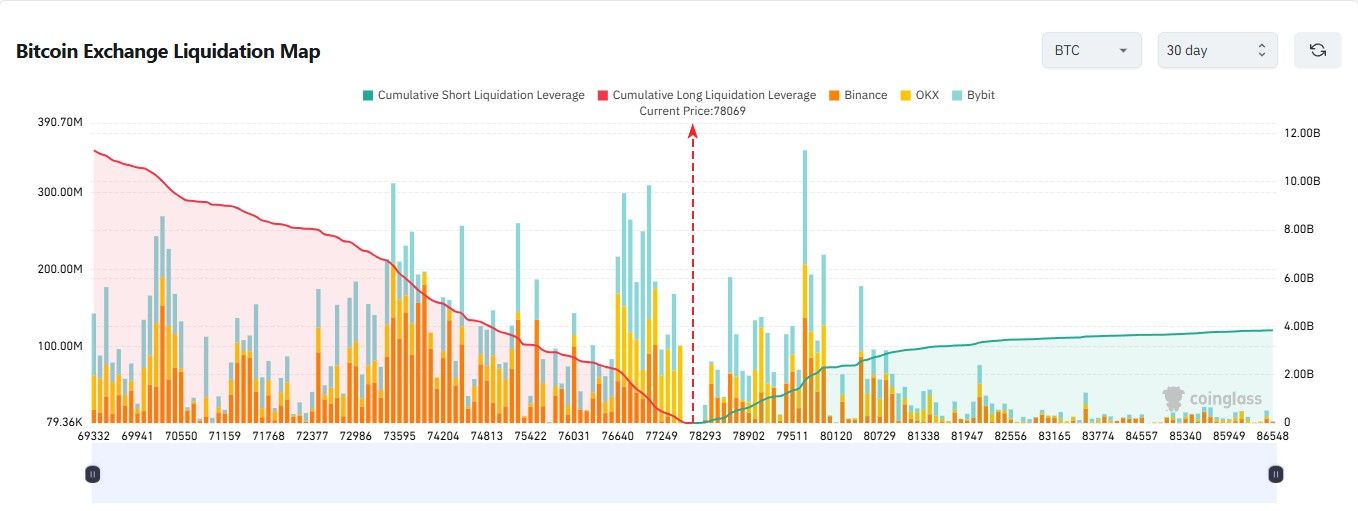
Bitcoin Liquidation Map Highlights Risky Business
The Coinglass liquidation map resembles a treasure map for risk-takers, showing dense clusters of leveraged long positions stacked precariously beneath the current spot price. Historically, this kind of arrangement has a knack for amplifying downside moves, kind of like how one wrong turn can lead to a cascading series of unfortunate events.
Each liquidated long adds to the market’s sell flow, potentially shoving the price into the next danger zone. Earlier in April, $71 million in long positions were at risk below $77,300. Above $78,000, conditions for a short squeeze created a spectacular sweep that obliterated millions in bearish bets. It seems that rising leverage and open interest love to throw surprise parties before sharp corrections.
Whether the spot can defend the $77,000 line may ultimately decide if the next move is a graceful cooling-off period or a chaotic liquidation cascade. For now, the imbalance leaves the market looking structurally fragile, despite all those bullish optics – it’s like putting a fresh coat of paint on a rickety old boat.
Read More
- FRONT MISSION 3: Remake coming to PS5, Xbox Series, PS4, Xbox One, and PC on January 30, 2026
- Best Controller Settings for ARC Raiders
- Mark Zuckerberg & Wife Priscilla Chan Make Surprise Debut at Met Gala
- Meet the cast of Good Omens season 3: All the actors and characters
- 7 Great Marvel Villains Who Are Currently Dead
- Welcome to Demon School! Iruma-kun season 4 release schedule: When are new episodes on Crunchyroll?
- The Boys Season 5 Officially Ends An Era For Jensen Ackles’ Soldier Boy
- Gold Rate Forecast
- Netflix Confirms One Surprising Anime Beat Pokemon & Tied With One Piece for Viewership
- The MCU’s 2026 Release Slate Updated With 4 New Updates
2026-04-26 19:35