- Bitcoin ascended to its zenith on a wave of bullish investor fervor
- The digital currency embarked on a downward spiral, settling beneath the $85,000 mark
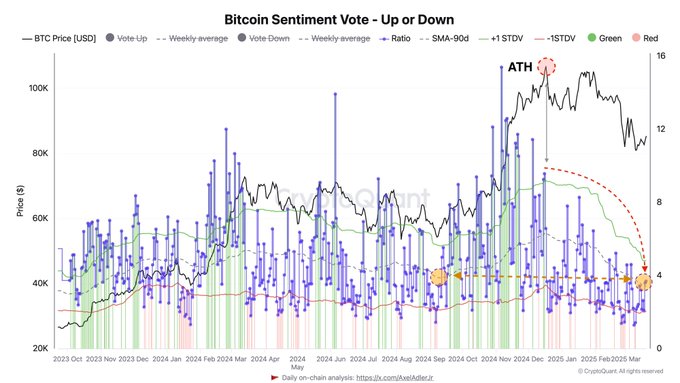
In the year 2024, Bitcoin reached its zenith, buoyed by the widespread bullish expectations of investors, as depicted by the Bitcoin Sentiment Vote chart. Indeed, the price of this digital marvel soared above $100,000, while the Vote Up sentiment surged with unparalleled enthusiasm.
Alas, once it achieved its peak, the market sentiment about its value began to wane precipitously. The mood shifted to a decidedly gloomy one as traders and investors alike began to cast their votes downward, leading to a decline in sentiment values. 📉
The initial rally was a beacon of hope, but it soon dimmed as fear gripped the market and traders rushed to sell, reducing their holdings after reaching the summit. The price of BTC began its descent, settling below $85,000 by March 2025. 🌬️
The shift in investor sentiment is a clear sign of deepening market reluctance. Particularly noteworthy is the return to the sentiment levels of September 2024, just before the bullish period commenced. 🕰️
Bitcoin’s Sentiment Echoes September 2024 Trends
The Bitcoin Sentiment Vote suggested that March 2025 marked a return to sentiment ratios similar to those observed in September 2024. The measurements during that period revealed neutral opinions, with the ratio hovering around 4, indicative of uncertain feelings. 🤔
The latest market trend demonstrated a significant decline compared to the previous all-time high levels above 12, which Bitcoin achieved at its peak. These indicators highlighted a neutral-to-bearish outlook as the “Vote Down” sentiment continued to rise in the 90-day moving average, accompanied by the standard deviation. 📉
The prevailing sentiment among traders mirrors the conditions before the rally, suggesting that they remain hesitant about Bitcoin’s future performance. The same sense of reluctance that preceded Bitcoin’s previous major upward surge is now palpable as investors grapple with uncertainty. 🤷♂️
Long-Term Holders’ Selling Behavior and Its Market Implications
Finally, the Bitcoin STH/LTH Supply vs. ETF Flows vs. MicroStrategy chart highlighted sustained selling pressure from Long-Term Holders (LTH). Although the pace has slowed since Bitcoin surpassed $100,000, a 30-day LTH supply reduction of 89,738 BTC could be a sign of ongoing profit-taking. 💸
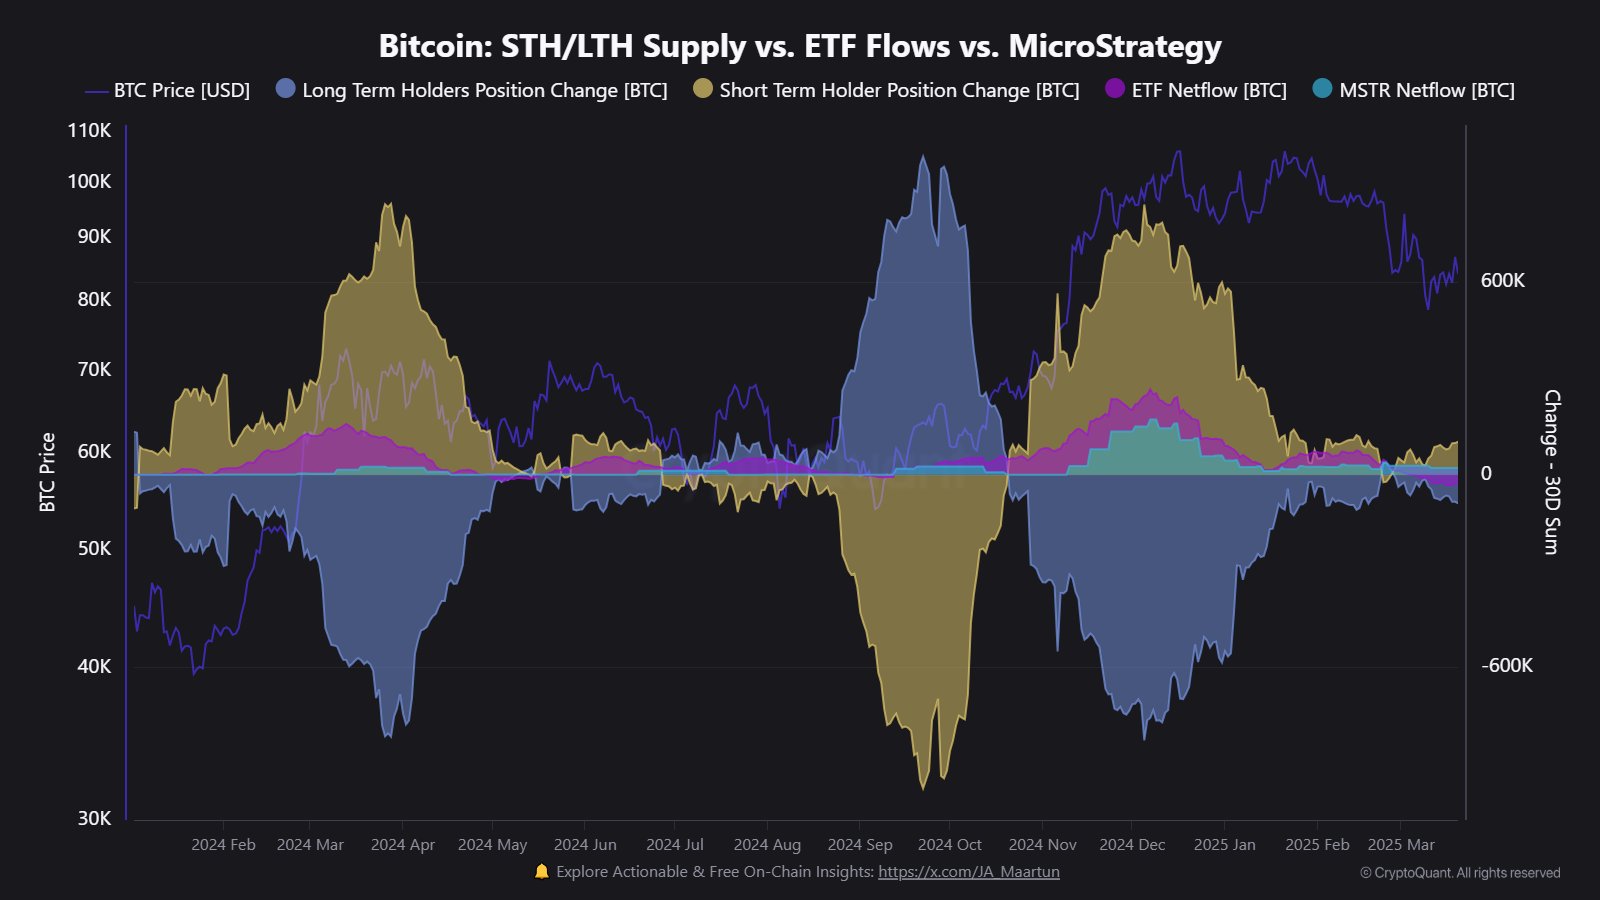
Source: CryptoQuant
The downtrend in LTH position changes aligns with the bearish sentiment from the first chart, indicating a risk-off behavior. The persistence of LTH selling, albeit at a reduced rate, suggests a lack of confidence in Bitcoin’s immediate recovery. 🚫🔄
This trend further supports the return of sentiment to September 2024 levels, reinforcing a cautious market outlook. As Bitcoin struggles to regain its upward momentum, investor behavior will continue to reflect hesitation and uncertainty about its future trajectory. 🤷♀️
Read More
- Best Race Tier List In Elder Scrolls Oblivion
- Discover Liam Neeson’s Top 3 Action Films That Will Blow Your Mind!
- Netflix’s New Harlan Coben Series Features Star-Studded Cast You Won’t Believe!
- Nintendo Switch 2 Price & Release Date Leaked: Is $449 Too Steep?
- Kanye West Praises Wife Bianca’s Daring Naked Dress Amid Grammys Backlash
- Top 5 Hilarious Modern Comedies Streaming on Prime Video Now!
- Attack on Titan Stars Bryce Papenbrook & Trina Nishimura Reveal Secrets of the Saga’s End
- Brandon Sklenar’s Shocking Decision: Why He Won’t Watch Harrison Ford’s New Show!
- EUR PKR PREDICTION
- Where Teen Mom’s Catelynn Stands With Daughter’s Adoptive Parents Revealed
2025-03-22 17:16