Well, here we are again, my friends, staring at the price action of Hedera, like a moth to the flame, hoping to catch a break. Some of the momentum and volume indicators still scream “SELL!” but wait-hold your horses. Key price levels and oscillators are whispering a different story. The market might just be setting up for a little bit of a comeback. So, keep an eye on that $0.22 support zone, folks. That’s your red carpet to the next big move.
Price Action Highlights Critical Support and Resistance Zones
Looking at the charts, it’s clear that HBAR is stuck in this tight little range between $0.22 and $0.23. It’s like the market’s been hitting the snooze button on a trend, waiting for something to happen. And guess what? This range has been a major floor before, so it’s kind of a big deal. The token has corrected from higher levels, and if it can stay above this zone, we might have something worth celebrating.
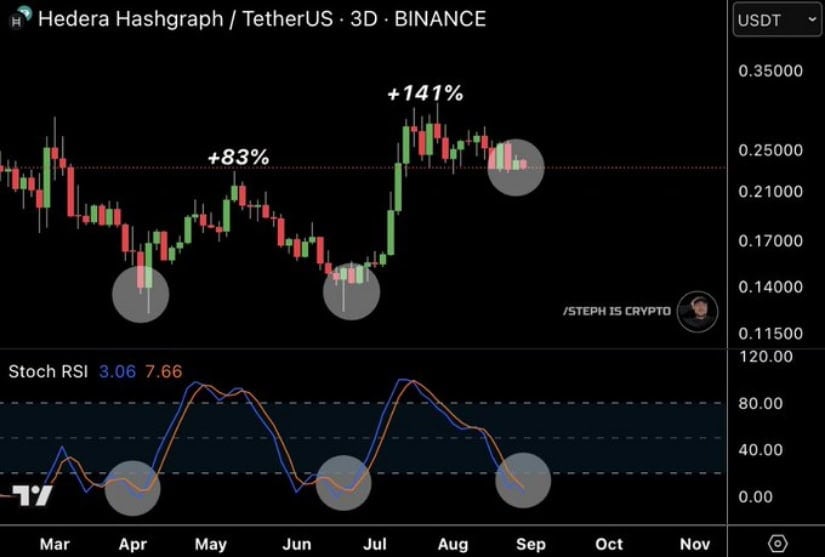
If the buyers can defend this level, we might see a resurgence, targeting resistance between $0.31 and $0.35. But don’t get too excited just yet-break below $0.22 and things could get ugly. We might be staring down the barrel of a decline to the psychological support at $0.20. So, yeah, the $0.22 price action is basically a battlefield at the moment. Buyers, this is your time to shine.
Technical Indicators Hint at a Bullish Reversal
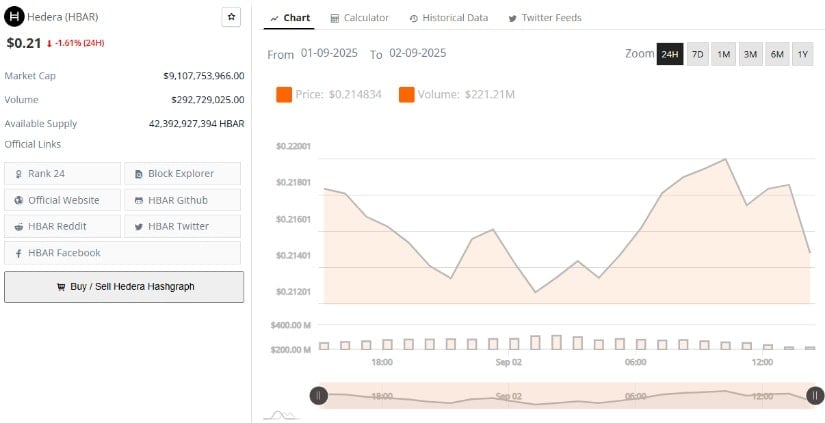
Now, let’s get a little more technical (because who doesn’t love a good chart?). According to BraveNewCoin, Hedera is currently trading at $0.21, down 1.61% in the last 24 hours. Market cap? A cool $9.1 billion. Trading volume? Around $292.7 million. With a total supply of 42.39 billion tokens, it’s clear that Hedera’s got a bit of breathing room to make a move.
Now, the MACD (that’s the Moving Average Convergence Divergence for those of you who like to sound fancy at parties) is still below its signal line, and the histogram is negative. So, yeah, there’s still some bearish pressure. But wait-take a good look at those histogram bars. They’re starting to contract, which means that the selling pressure might just be running out of steam. Maybe, just maybe, the bulls are gearing up for a run.
Oscillators and Volume Flow Reveal Market Indecision
Next up: Oscillators and volume flow. If you’re still awake, this might be the most interesting part. According to TradingView, the price is currently hanging out near the lower Bollinger Band, which, historically, has acted like a safety net during sharp declines. The lower band often acts as a springboard for a quick price bounce back to the mean. Sounds like a plan, right?
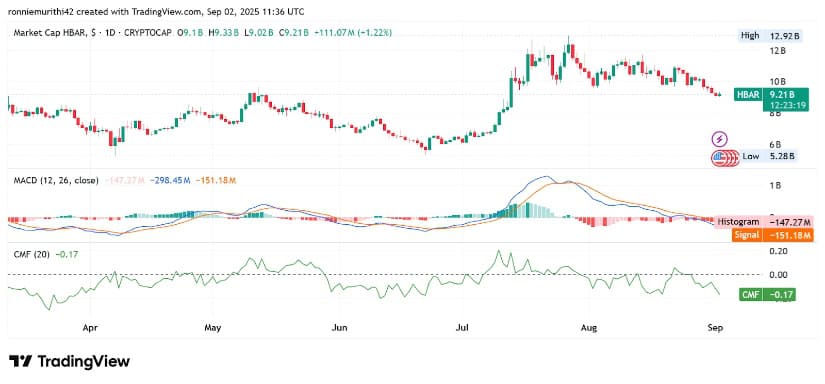
But don’t pop the champagne just yet. The Chaikin Money Flow (CMF) indicator has hit lows we haven’t seen in two months. Translation? More money’s been flowing out than in. It’s like a leaky bucket. This negative volume trend doesn’t exactly scream “bullish rally,” but the momentum oscillators are still on the hopeful side. So, what does this all mean? Market indecision, baby. Until we see more buying volume, we can’t be sure if this is the real deal or just another false alarm.
At the end of the day, HBAR’s dance with the $0.22 support zone, paired with those oversold technical readings, suggests a potential bullish reversal on the horizon. But-hold your horses again-the conflicting volume signals tell us that it’s not a done deal. So, let’s wait for some solid price and volume confirmation before anyone makes a move. Stay tuned, folks. This could be one wild ride.
Read More
- Gold Rate Forecast
- Looks Like SEGA Is Reheating PS5, PS4 Fan Favourite Sonic Frontiers in Definitive Edition
- Hazbin Hotel Secretly Suggests Vox Helped Create One of the Most Infamous Cults in History
- Arknights: Endfield – Everything You Need to Know Before You Jump In
- Dune 3 Gets the Huge Update Fans Have Been Waiting For
- Jack Osbourne Shares Heartbreaking Tribute to Late Dad Ozzy Osbourne
- 22 actors who were almost James Bond – and why they missed out on playing 007
- Disney Promotes Thomas Mazloum To Lead Parks and Experiences Division As Josh D’Amaro Prepares To Become CEO
- Antiferromagnetic Oscillators: Unlocking Stable Spin Dynamics
- 5 Weakest Akatsuki Members in Naruto, Ranked
2025-09-02 23:55