- Shiba Inu’s key technical indicator has suggested the possibility of a future decline.
- The coin’s price remains at risk of significant price swings.
On a weekly chart, the Parabolic SAR indicator for Shiba Inu’s SHIB suggested the potential for a prolonged downtrend.
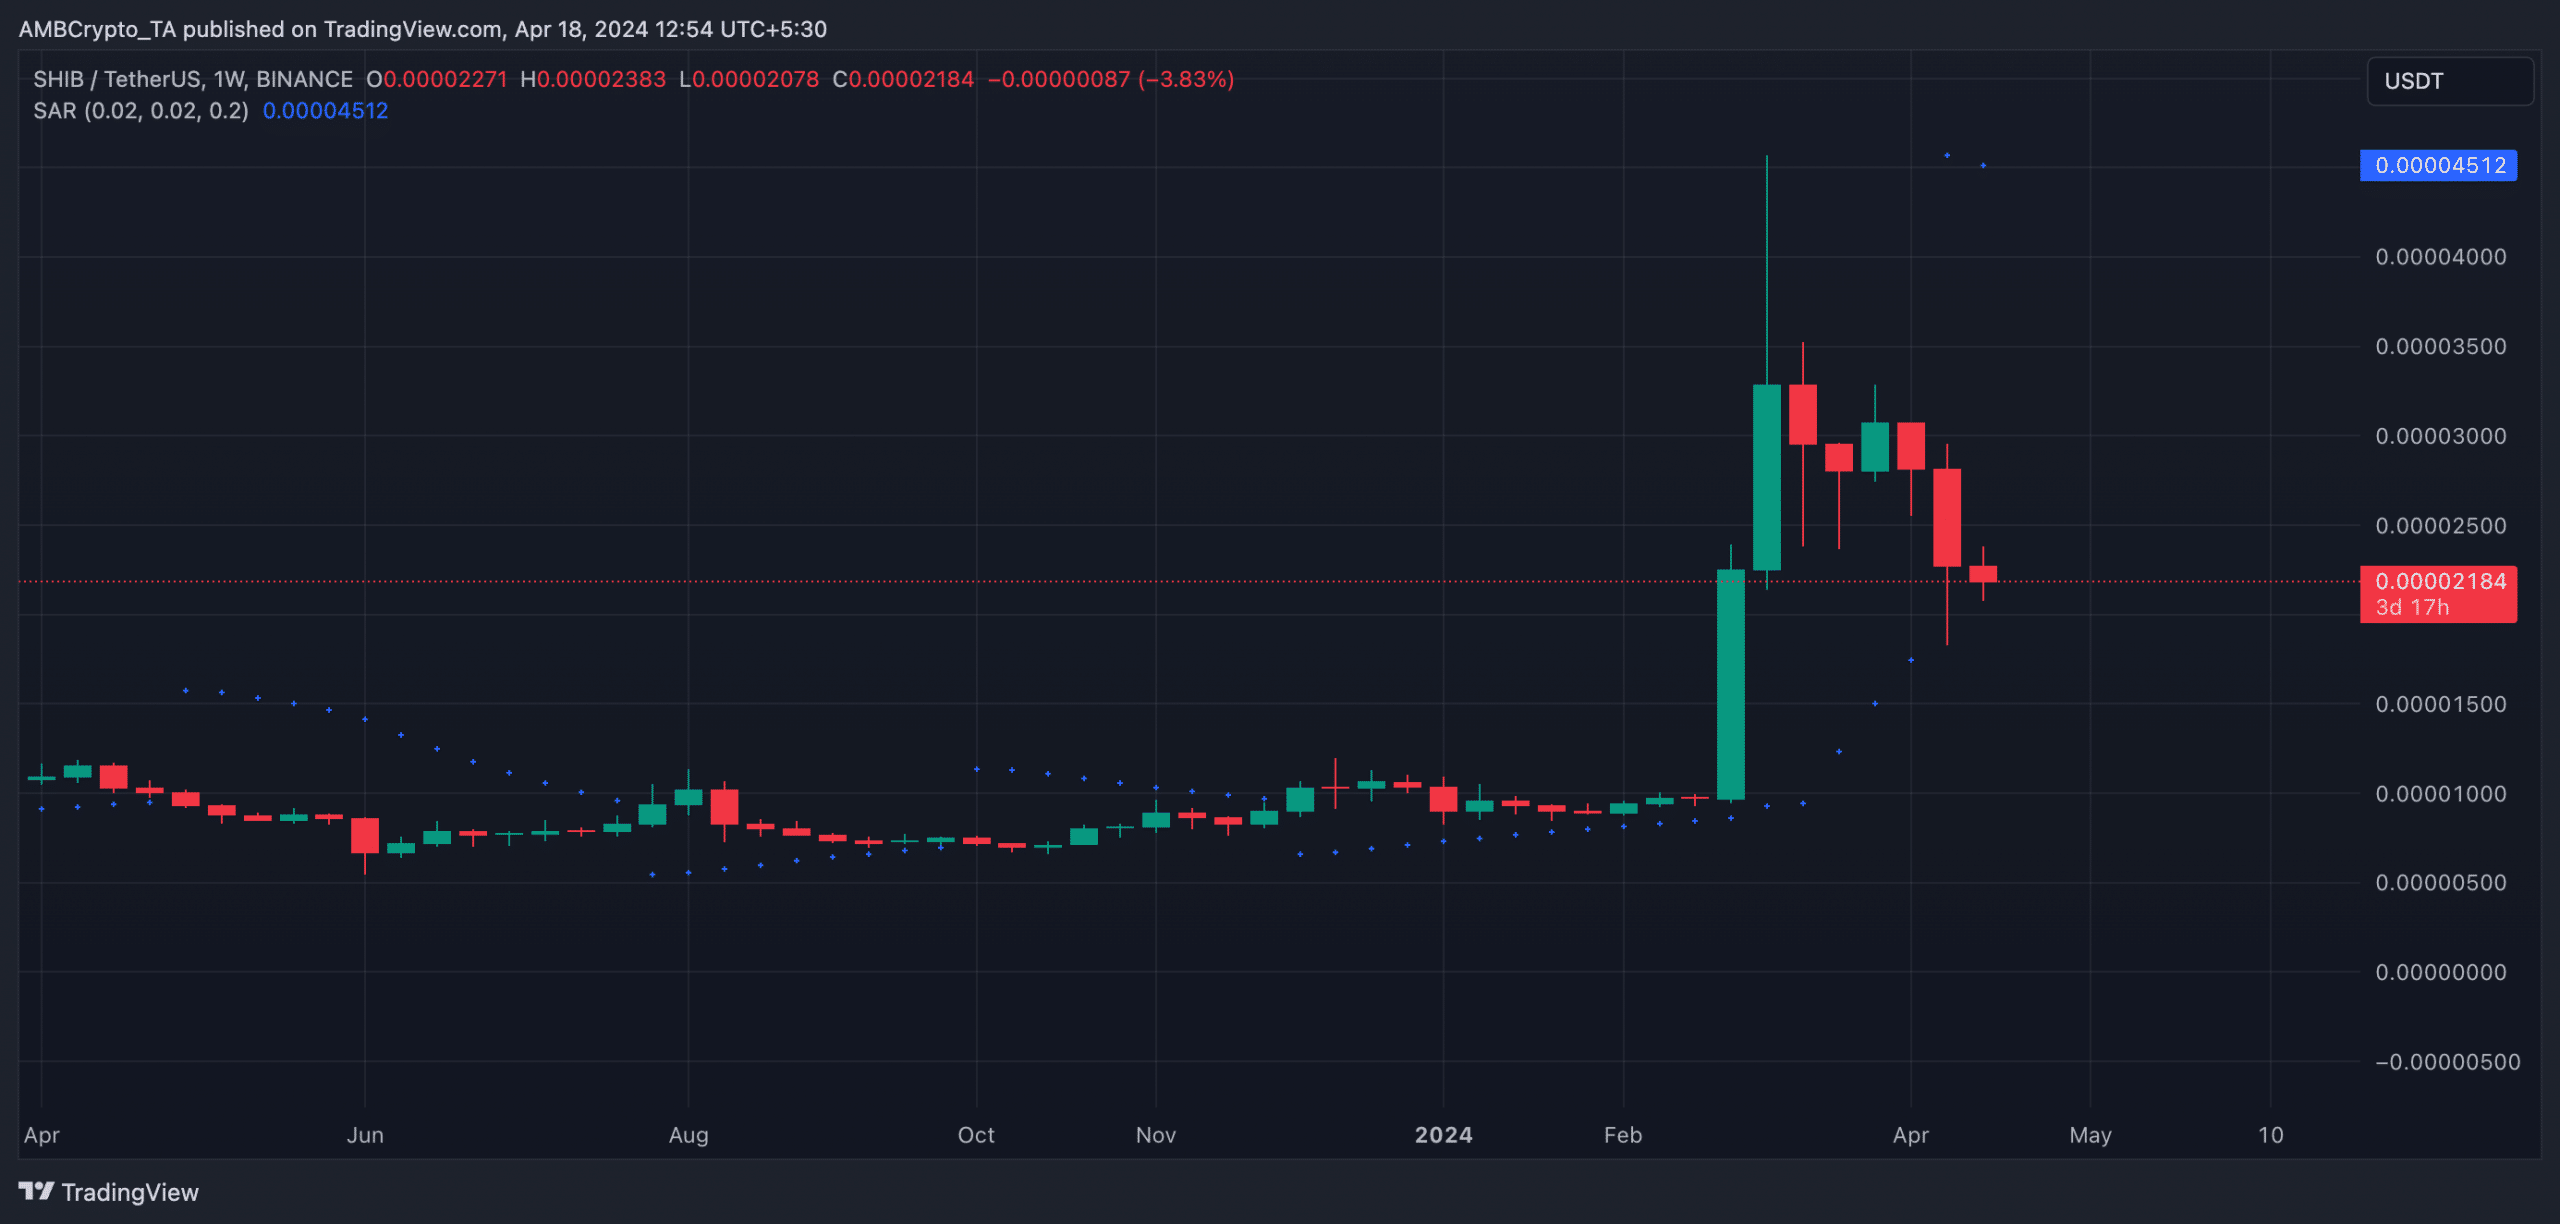
The Parabolic SAR (Stop and Reversal) indicator helps determine the trend and possible trend reversals of an asset. If its dots are positioned above the asset’s price, this signifies that the market is moving downward.
It indicates that the asset’s price has been falling and may continue to do so.
Do not write off the meme coin
Despite the sell signal given by SHIB‘s Parabolic SAR, other significant indicators suggested that buyers have remained active in the meme coin market during the same time period.
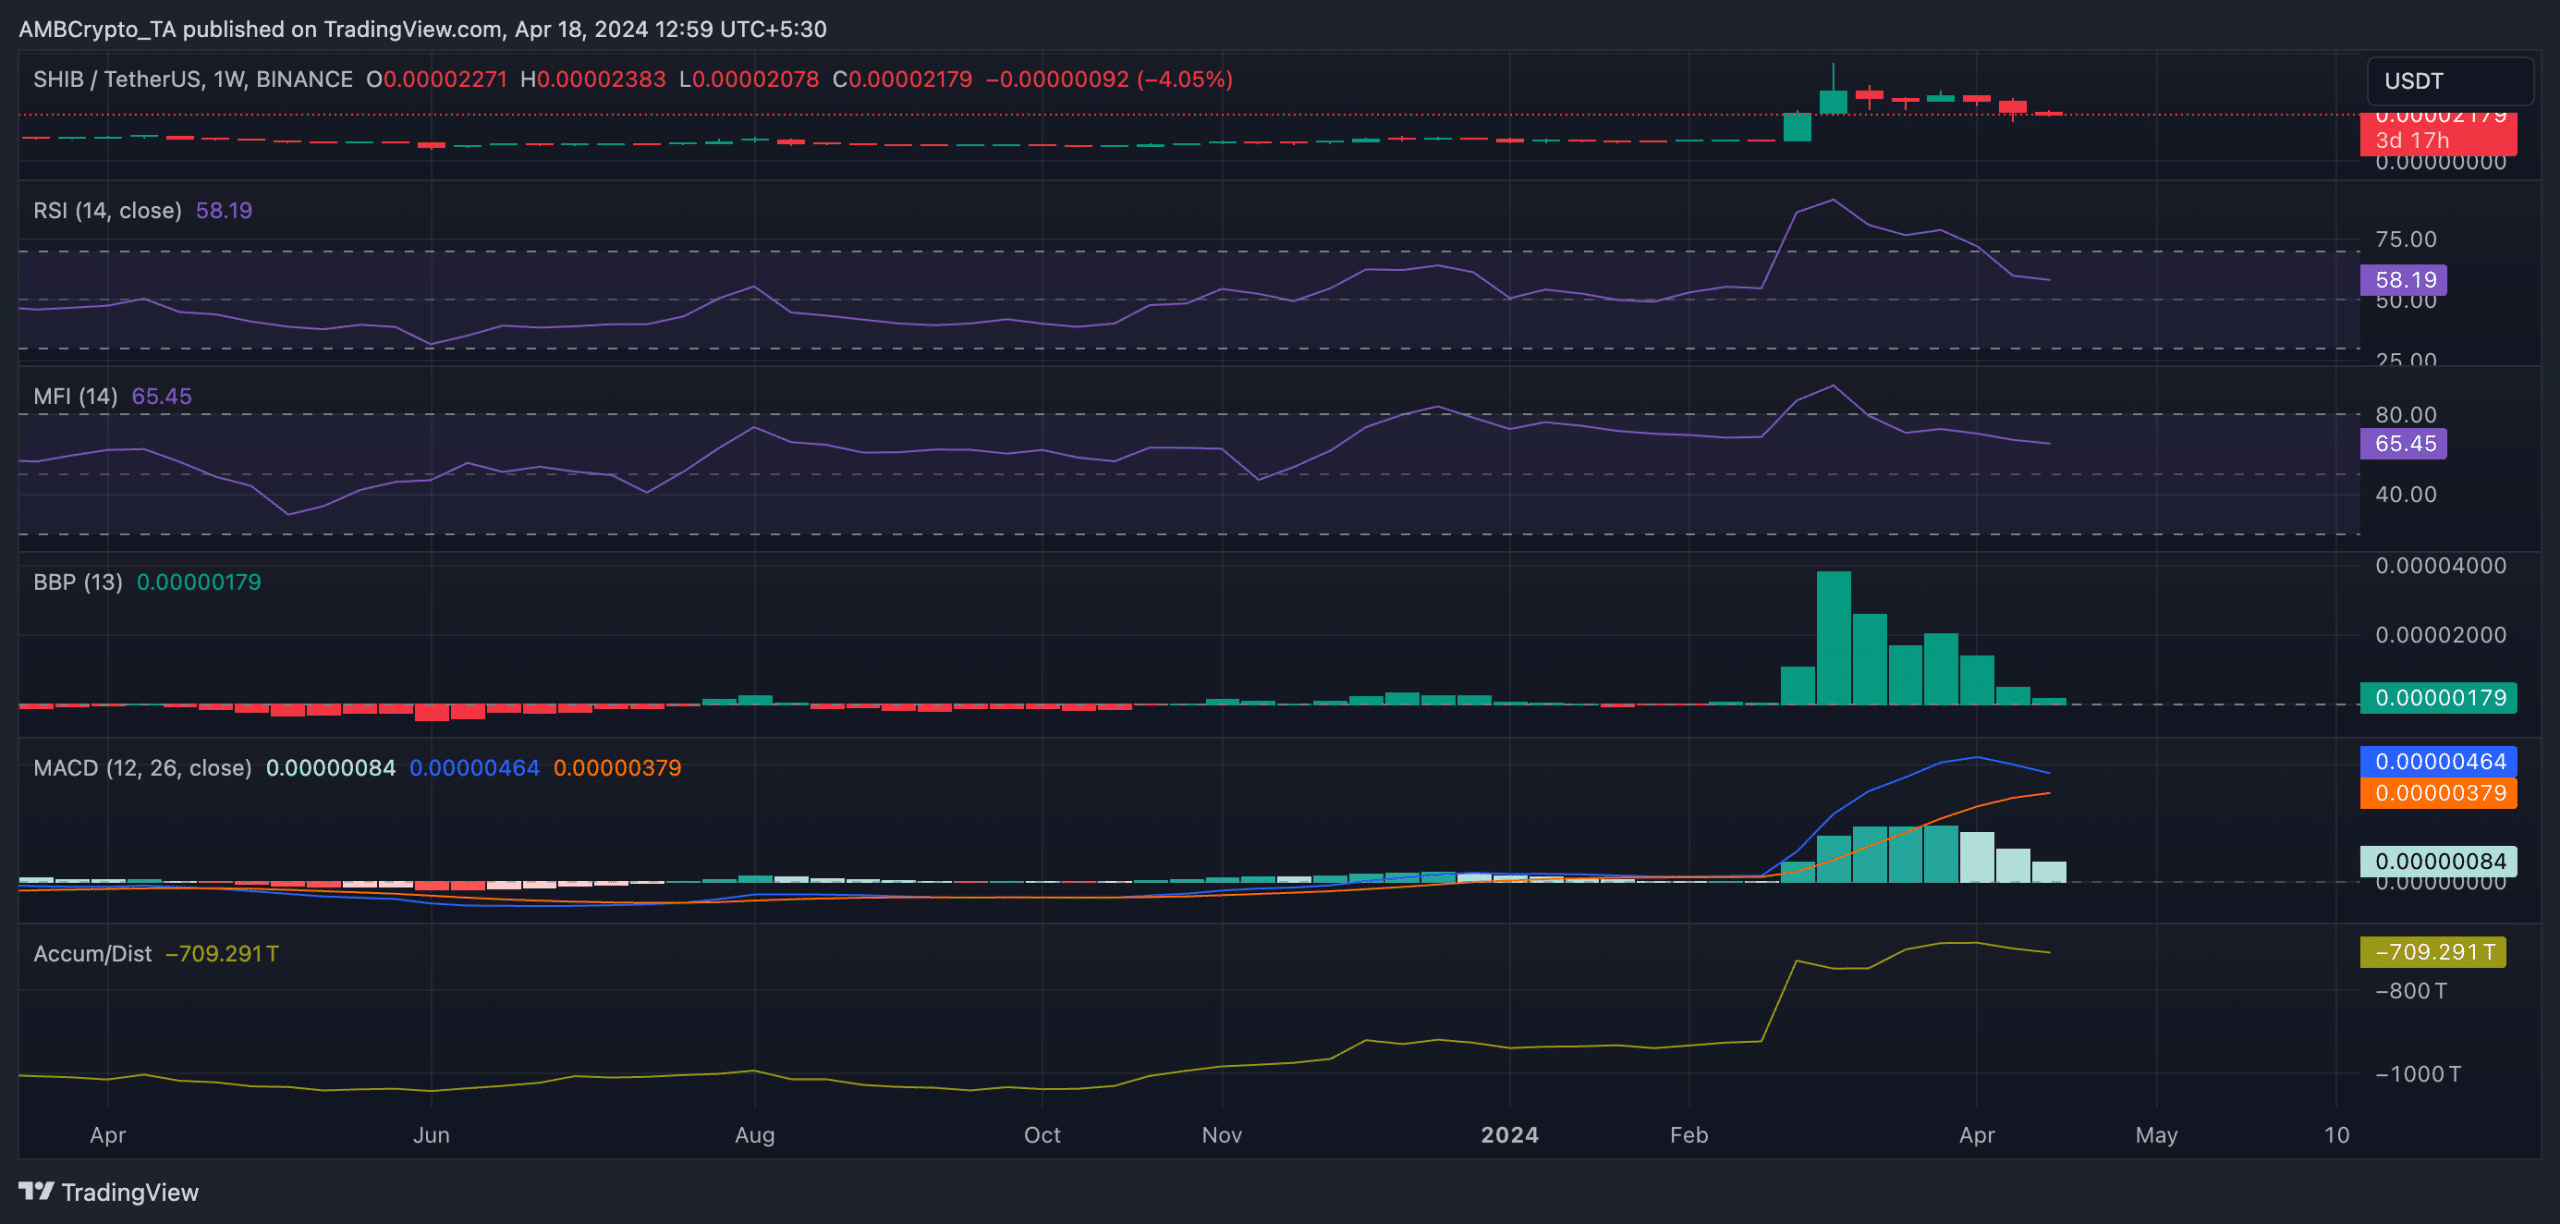
At the current moment, the important indicators of Shib’s momentum were placed above their averages. Specifically, its Relative Strength Index (RSI) amounted to 58.08, and its Money Flow Index (MFI) reached 65.46.
SHIB traders preferentially gathered more coins than selling them off, as indicated by the data, even though the market trend suggested a prolonged downturn.
The buying interest for Shib is increasing, as indicated by the upward trend of its Accumulation/Distribution Line (A/D Line).
An indicator measuring the net inflow or outflow of funds into an asset throughout a given timeframe, this can signify liquidity being added or withdrawn. A rising trend implies that more money is moving into the asset, suggesting accumulation.
Furthermore, SHIB‘s Elder-Ray Index showed a positive value at the current moment. This metric signifies the balance between purchasing power and selling pressure within the market.
When it returns a positive value, it means that bull power is dominant in the market.
The positioning of SHIB‘s MACD line above its signal line indicates the short-term moving average is higher than the long-term moving average, which is a sign of bullish strength.
This indication implies a transition from pessimistic to optimistic sentiment, increasing the likelihood of an uptrend, particularly for SHIB in the future.
Beware of swings
While SHIB’s price may hike long-term, its market has remained significantly volatile.
Read Shiba Inu’s [SHIB] Price Prediction 2024-25
Currently, the Average True Range (ATR), which gauges market volatility by determining the average price range between highs and lows over a given number of periods, is on an upward trajectory.
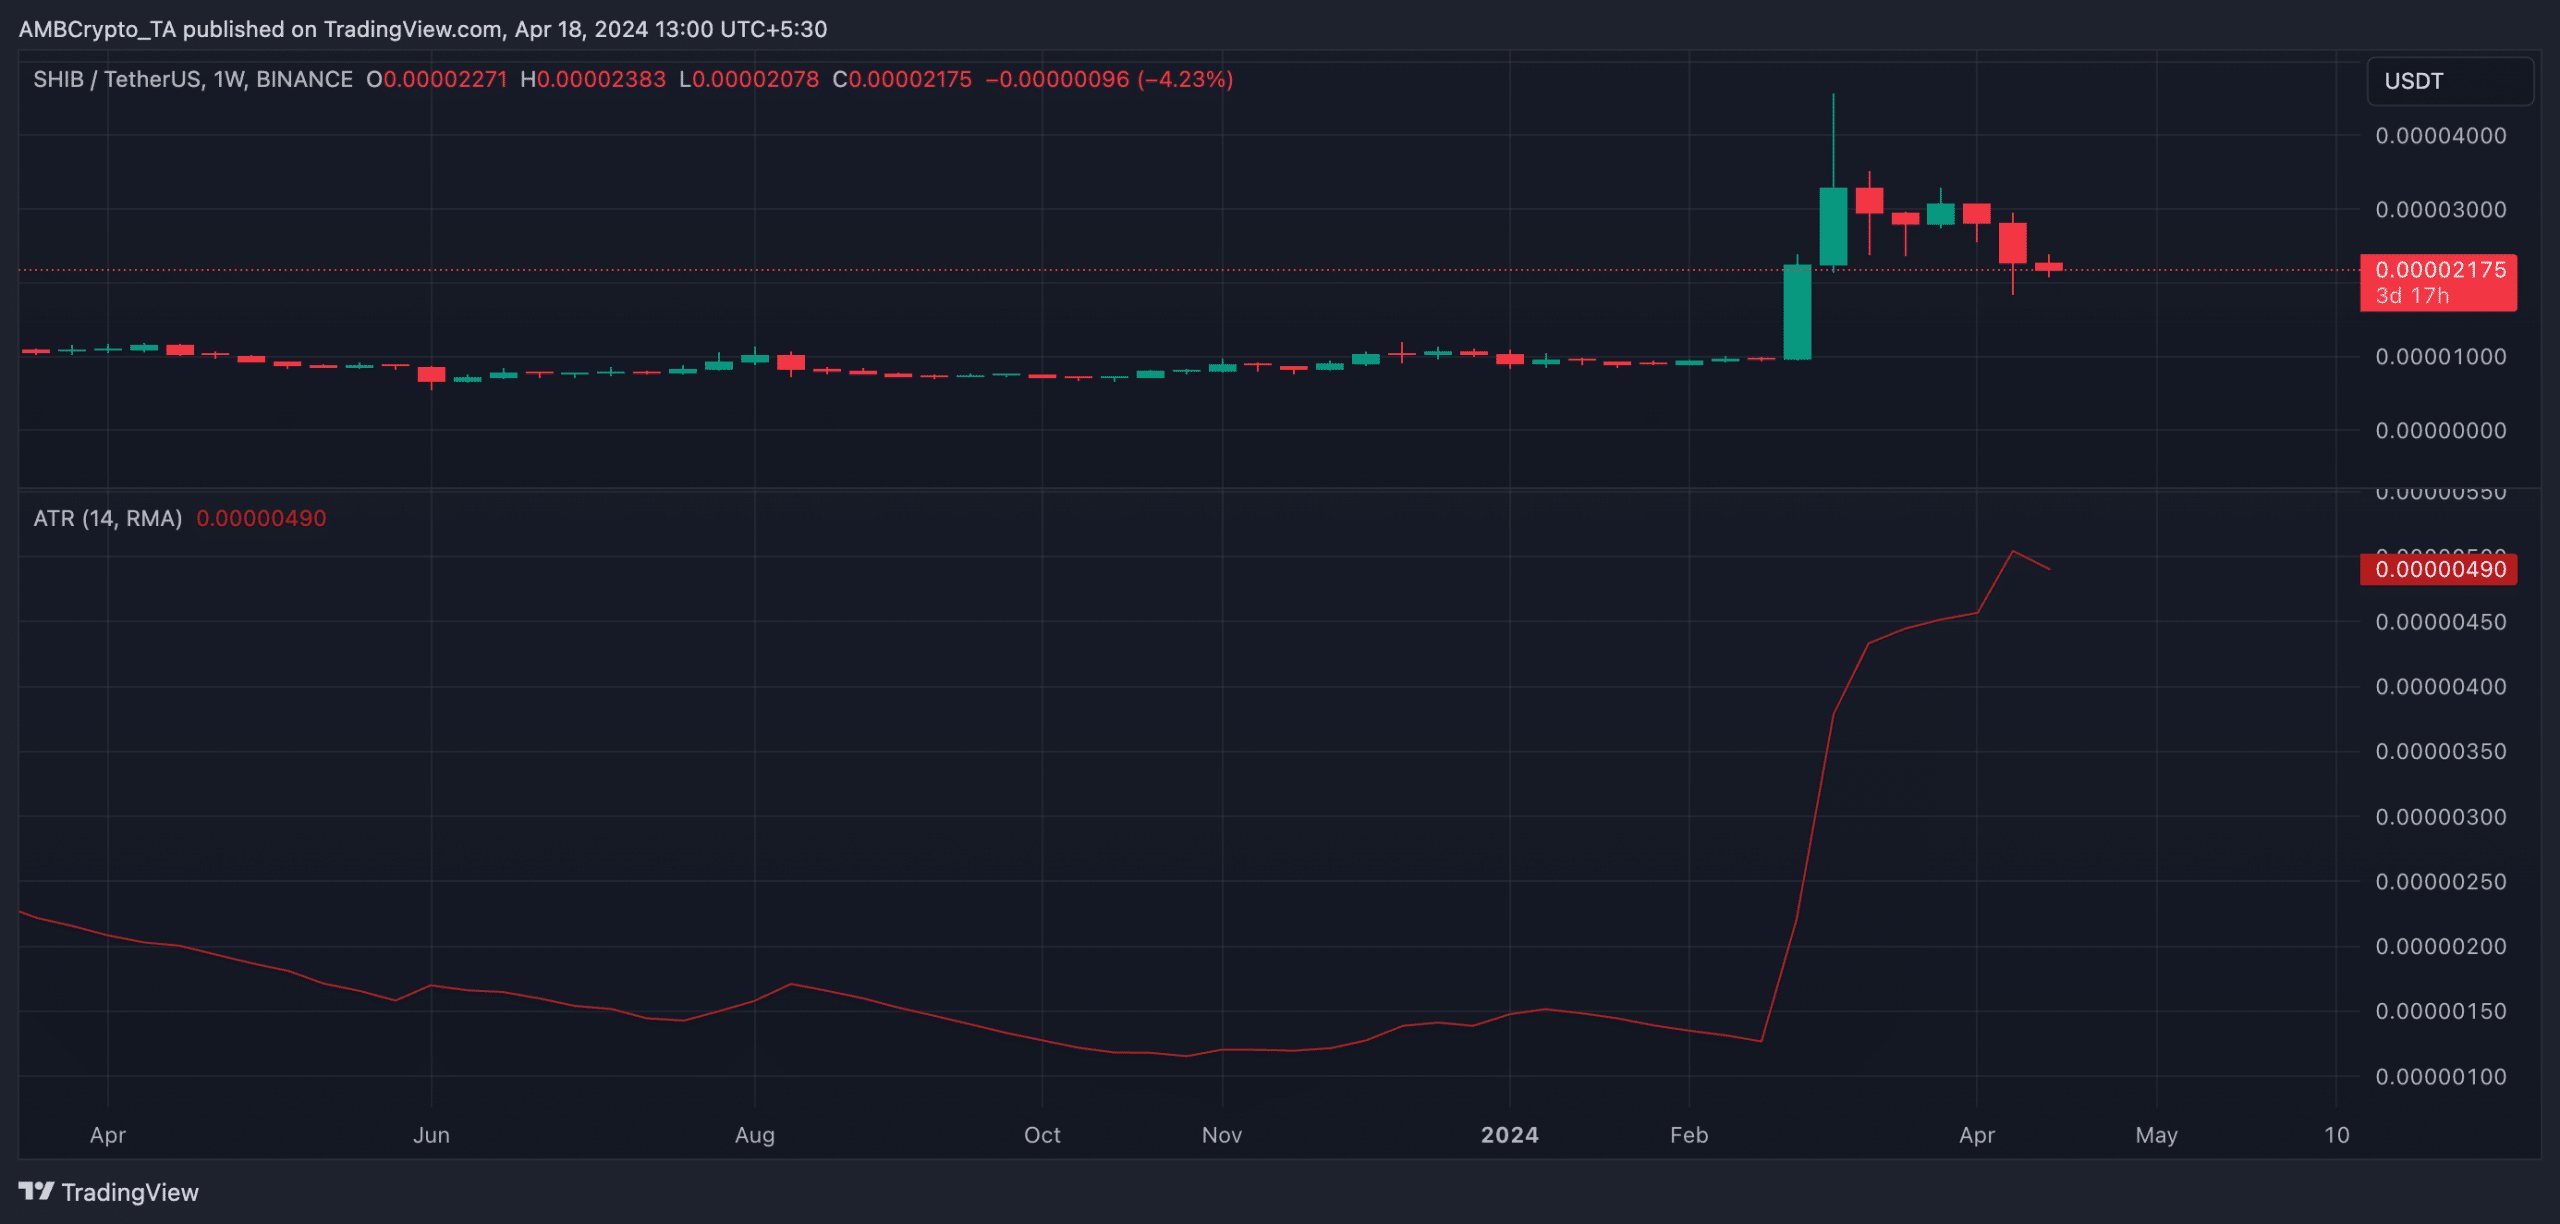
When an asset’s Average True Range (ATR) increases noticeably, it indicates that larger price fluctuations are becoming more probable.
Read More
- LDO PREDICTION. LDO cryptocurrency
- JASMY PREDICTION. JASMY cryptocurrency
- Chainlink to $20, when? Why analysts are positive about LINK’s future
- Citi analysts upgrade Coinbase stock to ‘BUY’ after +30% rally projection
- Why iShares’ Bitcoin Trust stock surged 13% in 5 days, and what’s ahead
- Spot Solana ETF approvals – Closer than you think?
- Orca crypto price prediction: Buying opportunity ahead, or bull trap?
- Can Ethereum ETFs outperform Bitcoin ETFs – Yes or No?
- How Potential Biden Replacements Feel About Crypto Regulation
- Why Shiba Inu’s 482% burn rate surge wasn’t enough for SHIB’s price
2024-04-19 10:19