- Solana trades 44.6% below its $156 fair value, a brutal arithmetic that makes numbers spit out their teeth and investors sigh.
- RSI at 28.25 signals oversold conditions, yet the MACD growls a downtrend that refuses to retire.
- Model forecasts 51% return potential over one year, but wide confidence bands make the prophecy wobble like a drunken lantern.
Solana hovers near $87, a 44.6% discount to the calculated fair value of $156. The numbers are merciless, and yet the market smiles with a grimace, as if a joke were hiding in the arithmetic. Analyst Marty Party passes along a careful valuation from David Eng, revealing a chasm of about $70 between the spot price and the model’s price, a canyon where certainty forgets to pay its rent.
The power-law model assigns SOL a Z-score of -0.65, a badge of oversoldness that the market wears with a shrug. The token bears down under downward pressure across the major exchanges, like a tired laborer trudging through a snowdrift of quotes.
Power-Law Model Shows Material Undervaluation
The valuation framework fits a power-law with an R² of 0.6792, meaning the long-run trend explains roughly 68% of historical price movements. A respectable confession from a machine that never sleeps, though not exactly a fortune-teller in a smoking jacket.
Solana Valuation – Feb 9 update
Spot price: $87 • Power-law fair value: $156 • Gap: -$70 • Discount to fair value: -44.6% • Z-score: -0.65 (oversold)
Model fit (R²) and robustness
Power-law fit: R² = 0.6792
Interpretation: the long-run trend remains the stern master, while the present market tugs at its sleeve and pretends not to notice.
– MartyParty (@martypartymusic)
Yet the model shows parameter instability, with rolling slopes ranging from -3.245 to 5.807 across periods. Block bootstrap testing suggests directional signals persist despite data dependencies, as if fate itself flinches but then steadies the aim.
The mean-reversion half-life sits at 133 days under current conditions. Projections drift toward about $135 in that span, a slow march that makes endurance feel like a sport for cranky economists.
At 266 days, the snap-back path eyes $166. The maturity-adjusted forecast promises about a 51% return over one year, though the 95% interval stretches wide enough to accommodate both consolation and catastrophe.
Solana Technical Analysis Confirms Oversold Territory
At press time, Solana trades around $84.48, down 2.64% on the daily chart. The fall was swift, from a peak near $140 to today’s quiet ache, with barely a breath between drops.
Immediate support sits near $80, where recent wicks tested buyer strength. Resistance clusters around $100, marking old ground where the market once paused to catch its breath.
The Relative Strength Index sits at 28.25, well below the oversold threshold of 30. Short-term buying interest could appear, if the supposed market spirit ever sneezes in the right direction. The 14-day RSI moving average rests at 29.85, reinforcing the oversold mood. Still, selling pressure remains stubborn, like a rumor that won’t die.
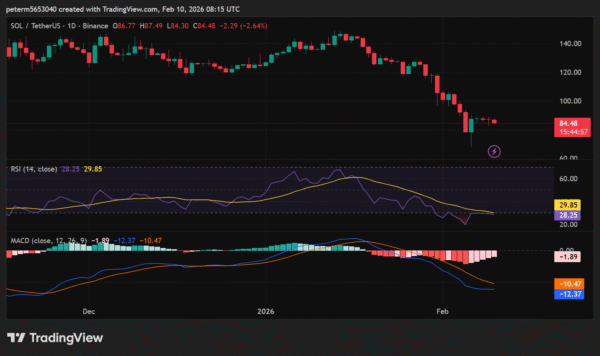
SOL MACD Signals Persistent Bearish Momentum
The MACD line sits at -12.37, below the signal line at -10.47, a tableau of bearish momentum that refuses to pack up and go home.
The histogram edges toward zero at -1.89, hinting at slower selling pressure. Yet a genuine reversal will demand a crossover where MACD climbs above the signal line, and the universe yawns with disbelief.
Price action must break above $90 to $95 for meaningful bullish confirmation. Psychological thresholds sit at $75 as support and $120 as upper resistance. The overall trend remains bearish until indicators flip positive; further declines look probable if the $80 floor falters.
Model Robustness and Forecast Limitations
The analysis uses rolling parameter stability tests and block bootstrap validation. Predictive correlation centers around -0.807 with a 95% confidence interval, a statistic that sounds academic and then quietly invalidates your party plans.
This suggests oversold conditions tend to precede outperformance in resampled scenarios. Yet residual autocorrelation at 0.997 indicates highly persistent deviations from trend, like a habit that will not quit.
The maturity-adjusted forecast carries an R² of 0.8415, improving 31.2 percentage points over simpler models. Independent long-horizon samples remain roughly four non-overlapping annual periods. This constraint dulls magnitude precision even as directional signals appear stubbornly strong. The 95% prediction interval spans from -66% to +574%, a wide grin of uncertainty.
Hence, Eng’s analysis positions Solana materially below the trend with a positive skew and high variance. The directional mean-reversion signal shows reasonable robustness under dependent-data testing, though the laughter from the market sounds hollow. Point forecast magnitudes remain less reliable given limited sample depth and regime sensitivity.
Read More
- Gold Rate Forecast
- Hazbin Hotel Secretly Suggests Vox Helped Create One of the Most Infamous Cults in History
- 22 actors who were almost James Bond – and why they missed out on playing 007
- Every Creepy Clown in American Horror Story Ranked
- As Dougal and friends turn 60, Radio Times explores the magic behind The Magic Roundabout
- Best X-Men Movies (September 2025)
- Kingdom Come: Deliverance 2 – Legacy of the Forge DLC Review – Cozy Crafting
- Blue Protocol Star Resonance: Goblin Lair Dungeon Guide
- Chill with You: Lo-Fi Story launches November 17
- Jack Osbourne Shares Heartbreaking Tribute to Late Dad Ozzy Osbourne
2026-02-10 16:26