Although XRP has bounced back a little from its recent lowest prices, it’s still one of the poorest performing large cryptocurrencies.
After falling below the key $1.30 support level, the asset’s price dropped quickly, briefly reaching between $1.05 and $1.10 before some buying activity emerged. While XRP has since recovered to $1.12, the overall price trend remains bearish.
XRP’s price is currently below its major moving averages, indicating a continuing long-term downtrend. The 50, 100, and 200-day trend indicators all point downwards. Importantly, the $1.30 level, which previously acted as support, now appears to be a resistance level. This means any attempt for the price to recover and reach $1.30 is likely to face significant selling.
XRP, Bitcoin (BTC), Ethereum (ETH) and Hyperliquid (HYPE) Price Analysis for June 8: Are Top-Tier Assets Ready to Bounce?
Schiff: 99% Crash Wouldn’t Phase Bitcoin ‘Cult’
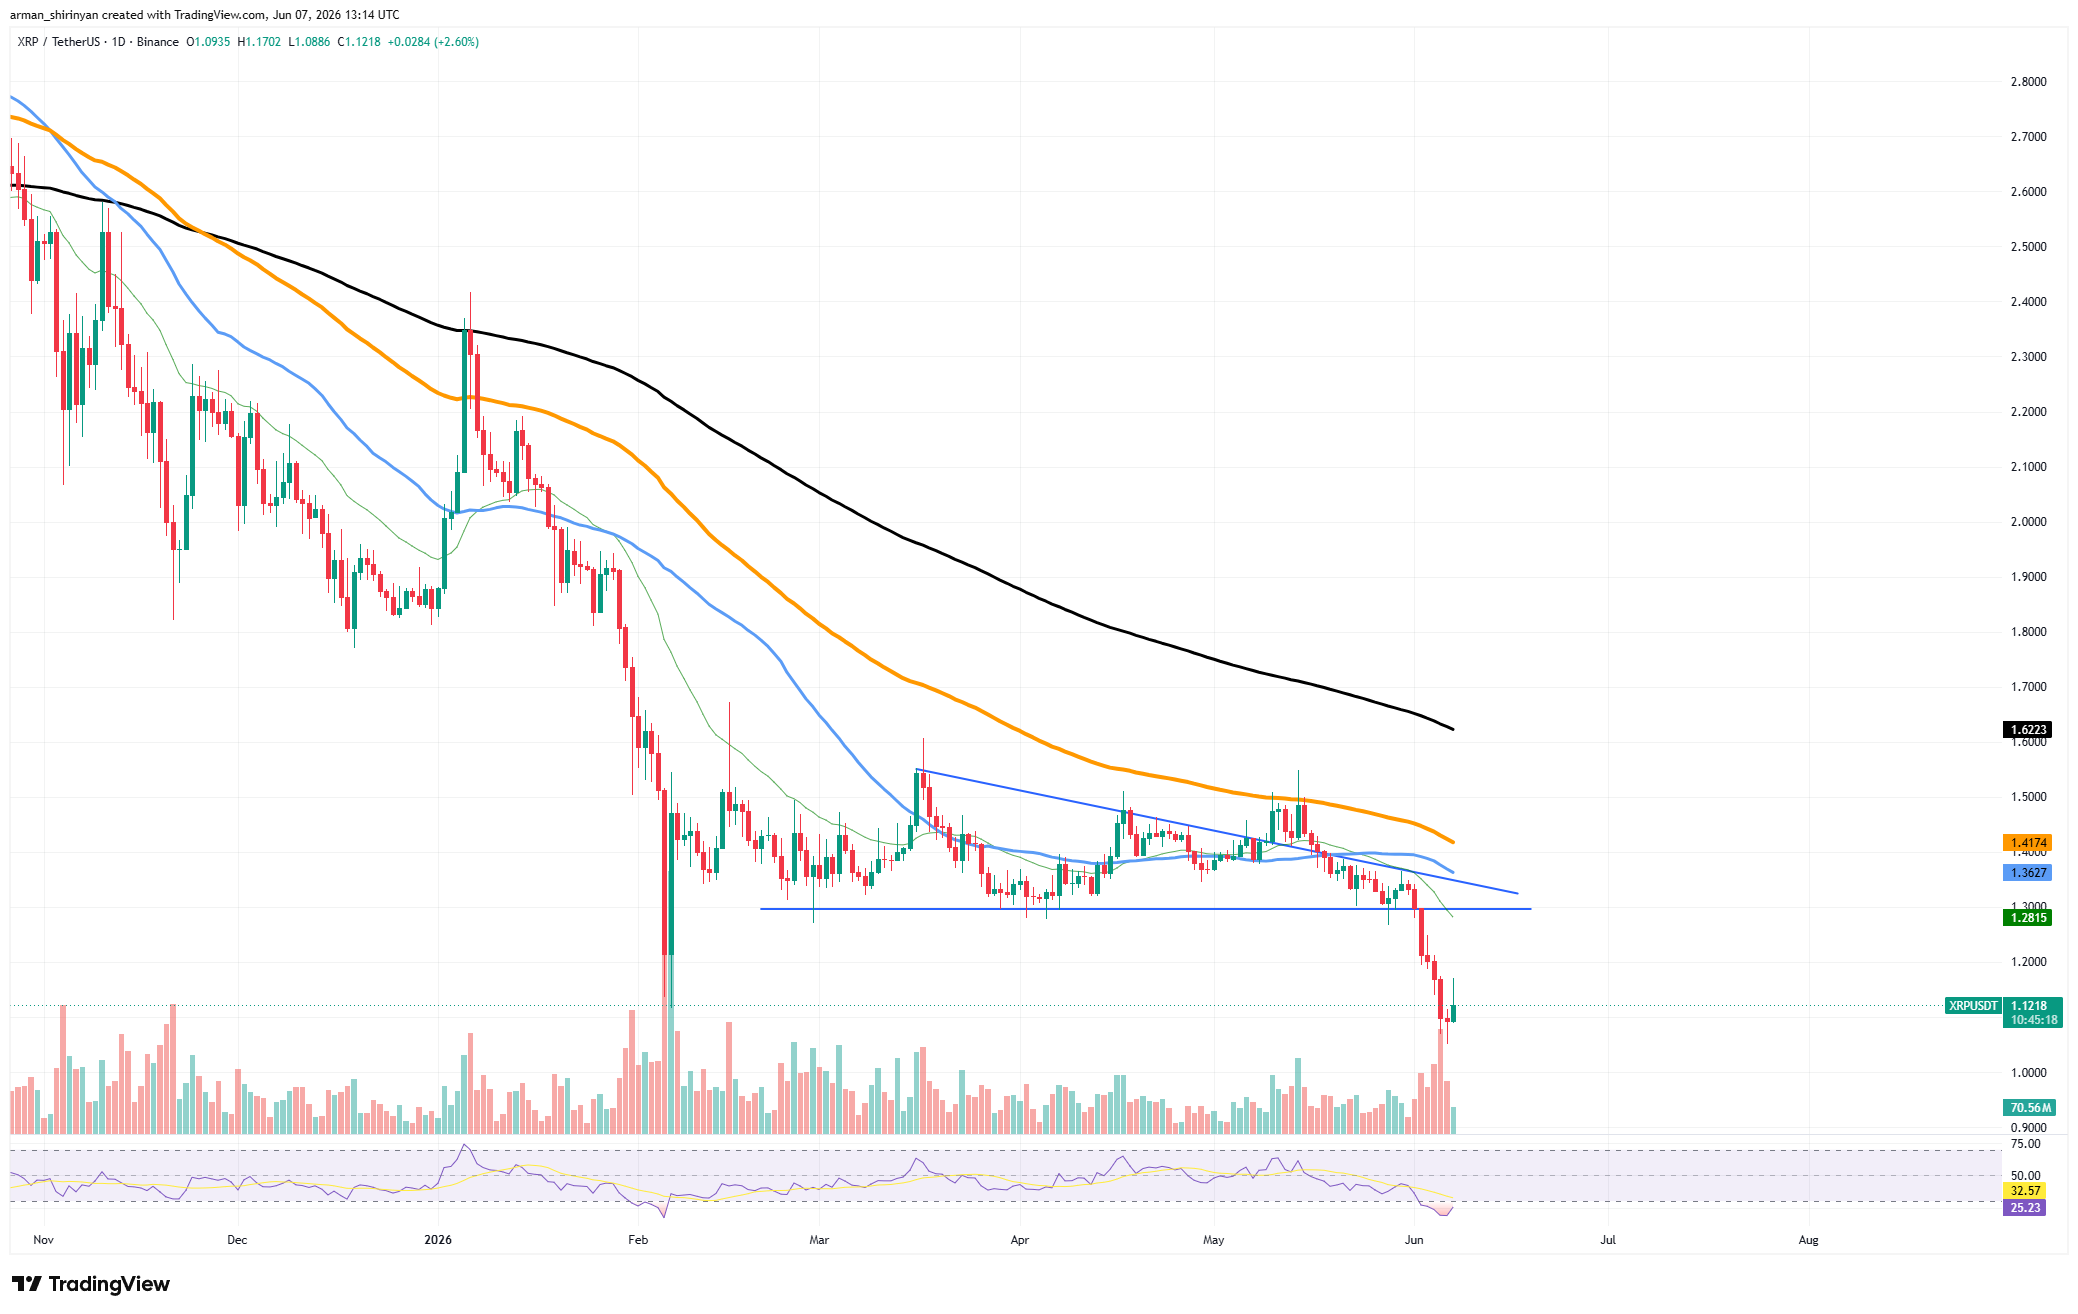
The recent drop in price finished forming a long-term pattern that suggested further declines were likely. The increase in trading volume during this drop confirms that sellers are currently dominating the market. While the price indicator, RSI, is now showing extremely oversold conditions, these readings aren’t usually enough to signal the absolute lowest point during a strong downward trend.
Investors can be encouraged by the signs that the recent sell-off is losing momentum. Recent trading activity suggests buyers are stepping in around $1.05, meaning traders are working to prevent the price from falling further.
For XRP to show a real shift in direction, it needs to climb back above $1.30 and surpass its moving averages. Currently, it looks like we’ll continue to see price swings with occasional small increases.
Looking at XRP, I anticipate we might see it test recent lows again in the near future. If the overall crypto market stays weak, it could even drop to find support at even lower price levels.
Bitcoin enters stabilization period
Bitcoin’s price, after a significant drop earlier, has now settled around $61,000. It briefly dipped close to $60,000, but recovered slightly when buyers stepped in.
Despite the recent gains, the overall technical outlook remains fragile. A key concern is that the price has fallen below both the 50-day and 100-day moving averages. Also, Bitcoin failed to break back above the $80,000 level – a key long-term indicator – suggesting the underlying trend is still downward.
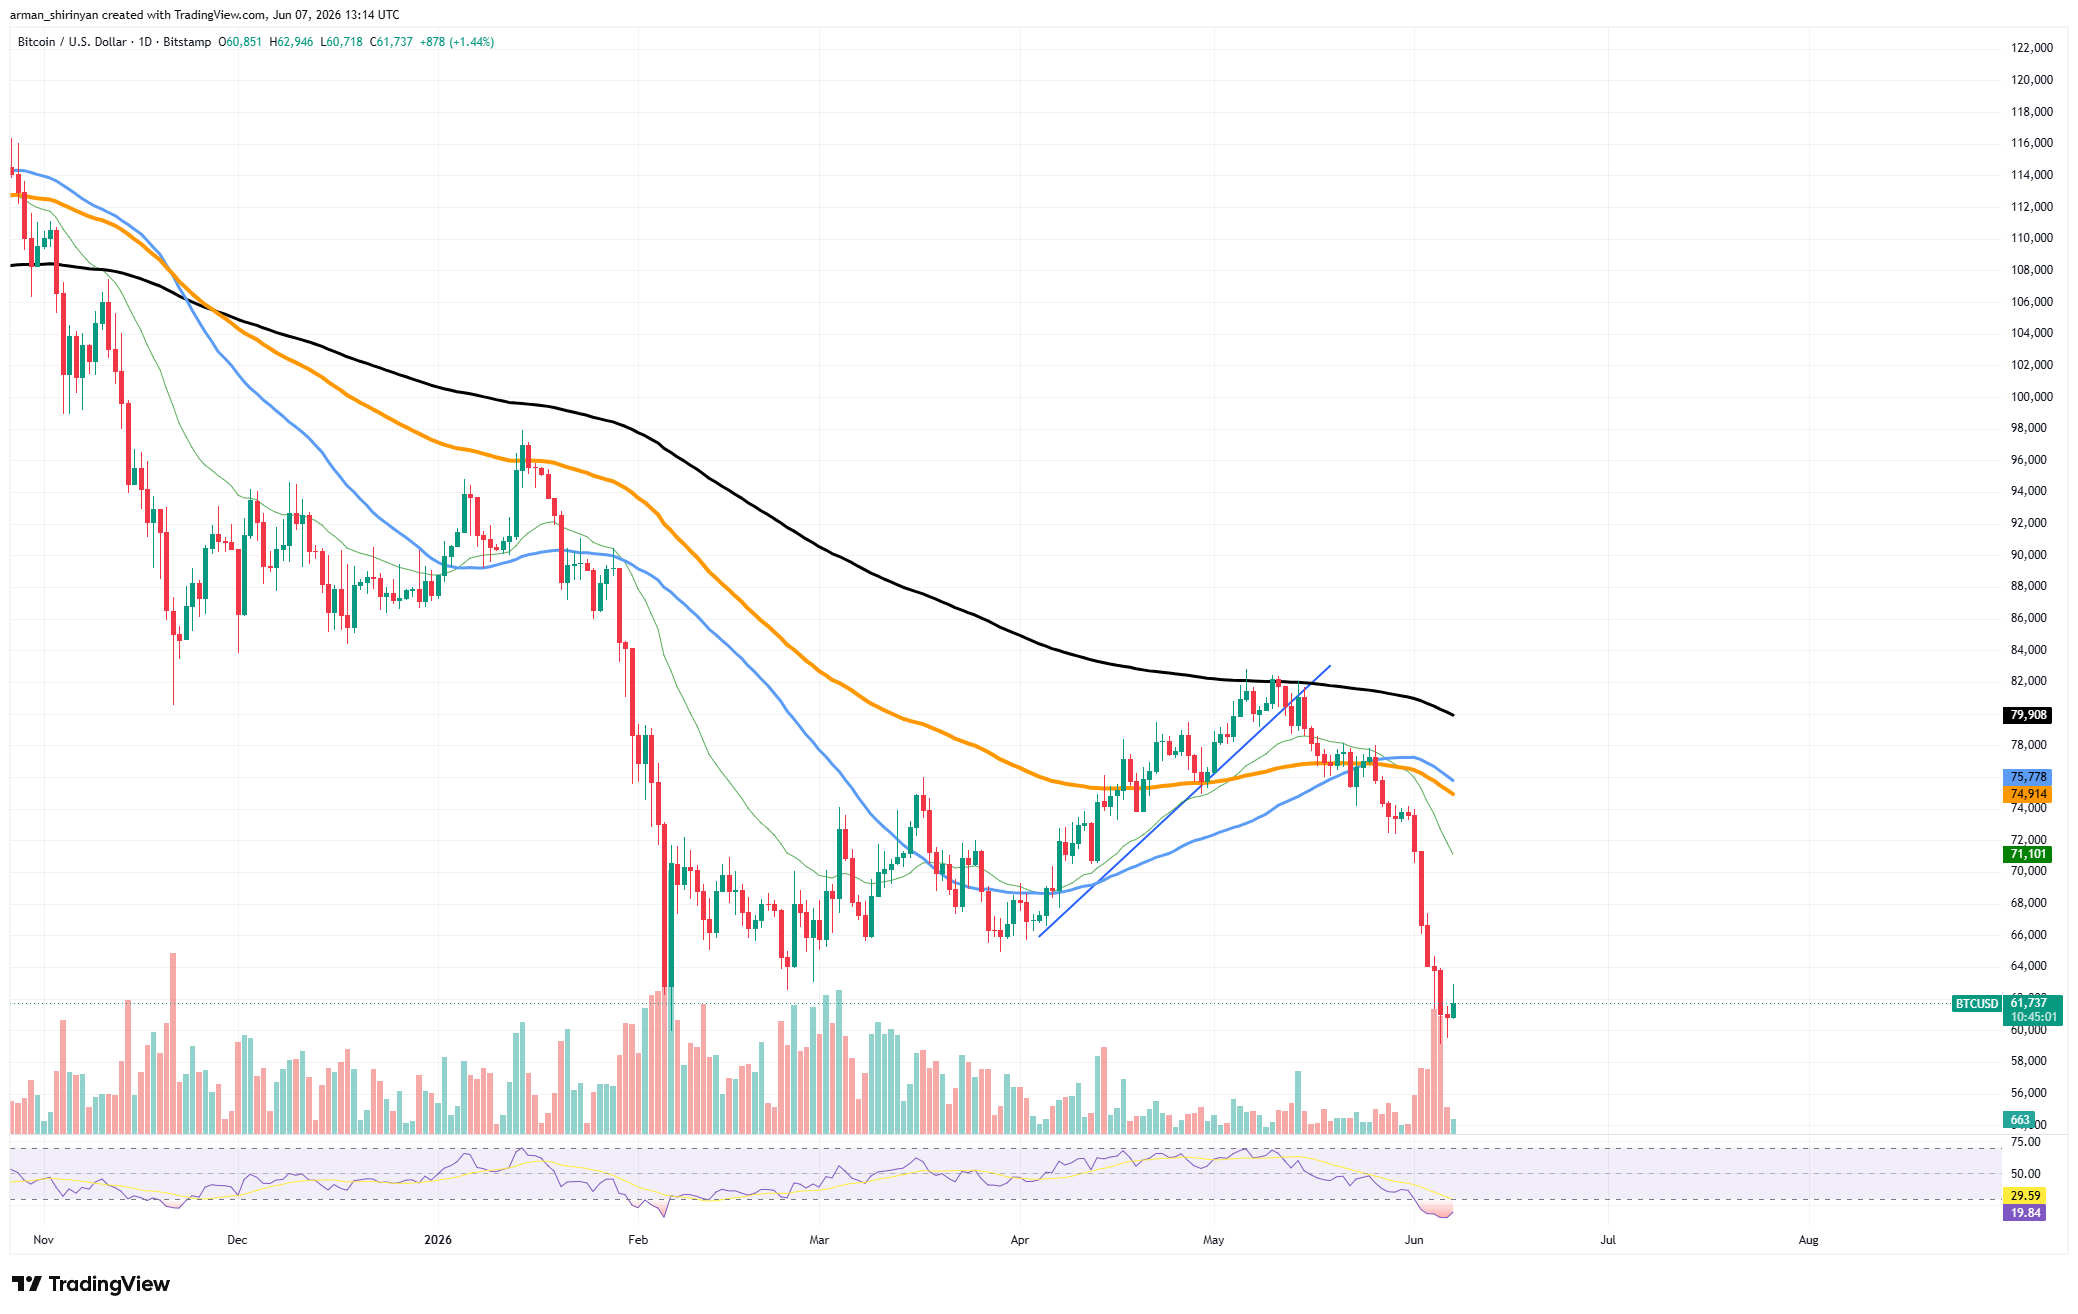
The recent market drop saw a huge surge in trading volume, indicating that investors were rushing to sell – a sign of panic rather than simply taking profits. The Relative Strength Index (RSI) has dropped to very low levels, near 20, which often happens during times of extreme fear. While this often leads to a temporary bounce in prices, it doesn’t necessarily mean the market has hit its lowest point.
Right now, the $60,000 level is a key price point for Bitcoin. If buyers can hold this level, the price could bounce back towards $70,000, potentially finding support from various moving averages along the way. However, if the price falls below $60,000, it could drop further to between $50,000 and $55,000, where there’s stronger historical support.
Bitcoin appears to have fallen too far, too fast, and might be poised for a price increase soon. The key question is whether this increase will lead to a sustained recovery or just a temporary rise within an ongoing downward trend.
Sellers continue to have an advantage until Bitcoin reclaims the major moving averages overhead.
Ethereum turning things around
Ethereum recently experienced a sharp price drop, one of the largest this year. After briefly falling below $1,600 – a key price point for investors – the price quickly recovered slightly, rising back to around $1,620 as buyers stepped in.
While we’ve seen a brief bounce, my overall technical analysis still points downwards for ETH. The recent drop confirmed my bearish outlook; we broke out of the descending pattern that formed over the past couple of months. When ETH couldn’t hold support around the 100- and 200-day moving averages, it triggered a wave of stop-losses and really accelerated the selling pressure.
From a technical perspective, Ethereum’s price is currently below all its major moving averages. The fact that the 50-day, 100-day, and 200-day averages are all trending downwards confirms a strong selling pressure. However, the Relative Strength Index (RSI) suggests the price may be oversold, hinting at a potential, though likely temporary, price increase.
Traders are initially watching the $1,800 to $2,000 price range. This area has acted as support before and now represents a key resistance level. If the price rises towards this range, many investors who bought higher and are now looking to sell may create a downward push.
As an analyst, I’m watching the recent sell-off closely. While the overall trend still looks downwards, I think we might be approaching a short-term bottom. I’m seeing a significant increase in trading volume during this decline, which often happens when selling pressure reaches its peak – almost like a final rush of panic before things calm down. This suggests we could be nearing a point where the market stabilizes.
Ethereum’s price still largely follows Bitcoin’s movements. If Bitcoin continues to fall, Ethereum could drop to recent lows, or even lower. For Ethereum to recover, it needs to rise above key average price levels and start making higher highs, but that doesn’t seem likely right now.
As a researcher, I’m currently observing that the market is primarily focused on limiting further losses. While I believe the overall trend remains downward until we see clear evidence to the contrary, I anticipate short-term swings – periods of volatility interspersed with temporary price increases, or ‘relief rallies’.
Hyperliquid loses steam
Even though Hyperliquid’s price has fallen significantly from its peak, it’s still doing well compared to other digital assets. The price of HYPE dropped quickly, briefly falling to around $55, but then buyers stepped in and pushed it back up after it had almost reached $76.
HYPE is performing differently than most major cryptocurrencies, remaining significantly above its key long-term averages. These averages, which track trends over 100 and 200 days, are still pointing upwards, signaling a generally optimistic market outlook. Even after a recent price dip, HYPE continues to trade well above these support levels, indicating that its long-term upward trend remains strong.
The recent drop in price doesn’t seem like a major shift in direction, but more likely a case of investors taking profits. It’s common for traders to sell after a big increase to secure their gains, which can cause a temporary dip in price. This is especially likely given how quickly HYPE became popular recently.
One key technical point is that the overall upward trend remains intact. The rising support line from earlier this spring is still holding, suggesting the long-term pattern is still valid despite some recent loss of momentum.
The asset was previously overbought, causing the RSI to drop, which can be a healthy correction. As selling slows down, a clearer path for future price increases often emerges.
The price range between $70 and $76 continues to act as a key level where it’s been difficult for the price to rise further. If buyers can hold the current price and trading activity picks up, the price might try to reach those higher levels again. However, if the price falls below $50, that would be a strong negative signal and could suggest a larger price drop is coming.
Hyperliquid is still doing well compared to most cryptocurrencies. While prices are still fluctuating a lot, the overall trend suggests prices will likely continue to rise, as long as key support levels hold.
Read More
- SUI PREDICTION. SUI cryptocurrency
- USD HKD PREDICTION
- Gold Rate Forecast
- USD CHF PREDICTION
- USD TRY PREDICTION
- UNI PREDICTION. UNI cryptocurrency
- USD BRL PREDICTION
- EUR CNY PREDICTION
- Remake of 1999 PS1 Game Coming to PS5 and Switch 2 This October
- Pragmata Crashing on Startup: Fixes for PC
2026-06-08 06:47