Bitcoin’s recent price increase seems to be losing steam. While it has bounced back from a previous drop and is currently trading between $71,000 and $72,000, the price chart suggests it might be forming a ‘double top’ pattern, which could signal that the upward trend isn’t as strong as it looks.
Premature double top
The price has twice tried to break through the $70,000 level, creating a pattern called a ‘double top.’ It initially reached this level but fell back, and is now attempting it again without a significant surge in trading volume. This repeated failure to move higher, especially with low trading volume, often suggests that buying interest is weakening.
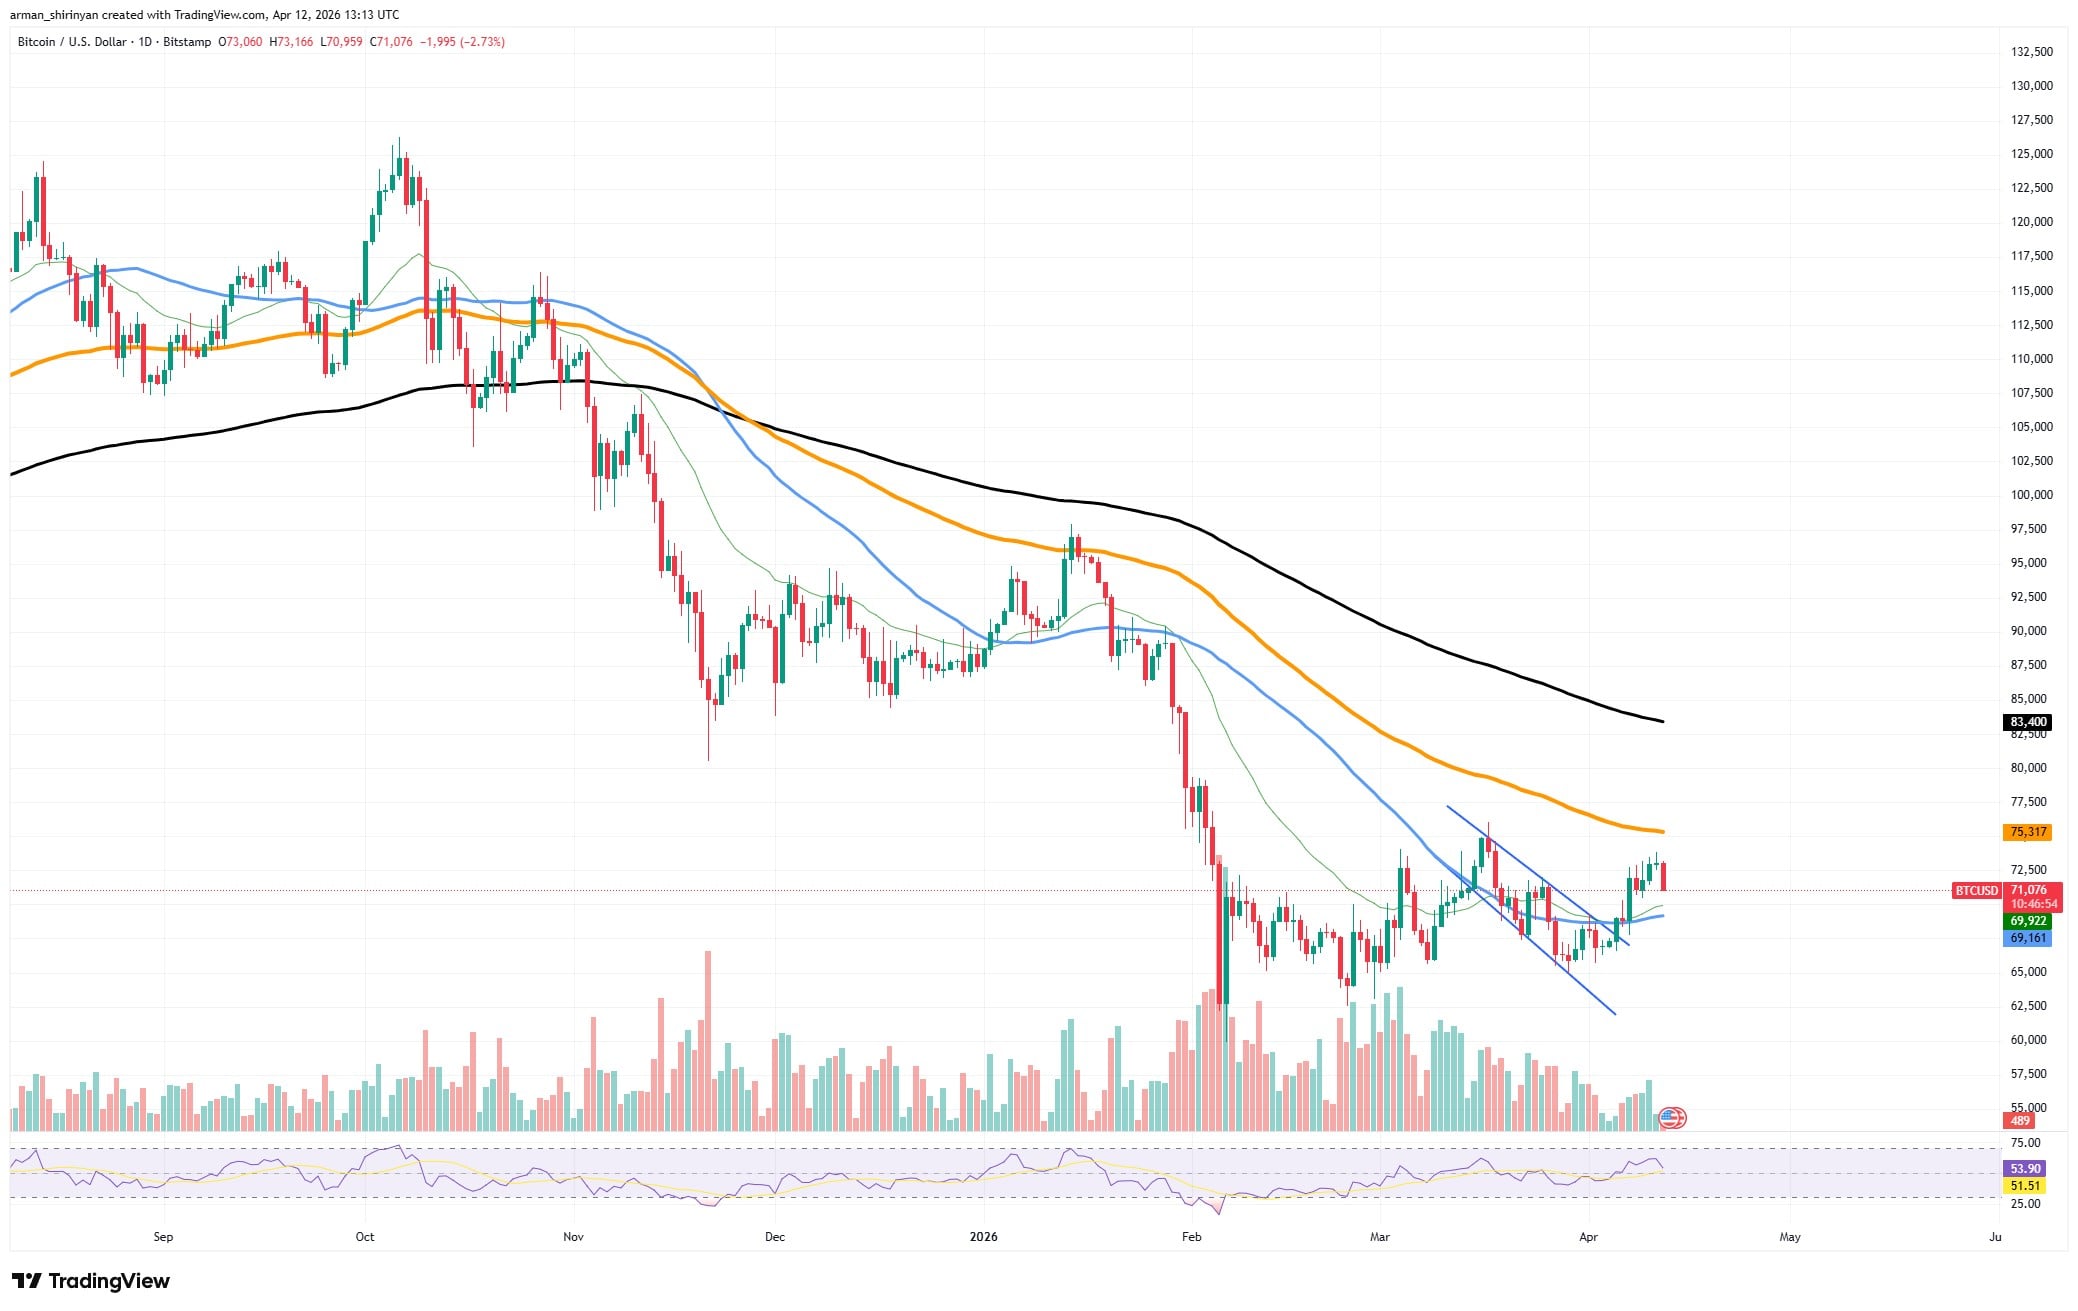
Volume is key here and reinforces the idea that the price is likely to fall. While the initial move to the first high saw strong trading activity, there was significantly less volume when the price tried to reach that high again. This difference between price and volume is what makes the double top pattern significant. It suggests the price is increasing with less and less support, a situation that usually doesn’t last.
Bitcoin (BTC) Paints Double Top Formation, XRP’s Volume Hints at Weakness of Bears, Ethereum’s Most Bullish Picture Recently: Crypto Market Review
XRP Beats BTC and ETH in ETF Flows, Shiba Inu Extends Price Rally, Cardano Founder Takes Jab at XRP, Ripple CTO Emeritus Says No One Holds Satoshi’s Keys — Top Weekly Crypto News
As I’m looking at the charts, Bitcoin continues to trade under key long-term moving averages, and those averages are still trending downwards. This leads me to believe the recent price increase is probably just a temporary bounce, rather than the start of a sustained upward trend. In my view, we haven’t seen enough evidence to confidently say the overall trend has reversed and become bullish.
If the double top pattern is confirmed, around $69,000 is a key level to watch. If the price falls below that, it could trigger a significant sell-off, potentially dropping Bitcoin back down to the $65,000-$66,000 area, where it previously stabilized. This decline could happen quickly, as there’s a lot of potential selling waiting below recent low prices.
However, this setup hasn’t been confirmed. The predicted double top pattern might not happen, and the market could resume its upward trend if Bitcoin rises above $72,000-$73,000 with strong trading activity.
XRP bears are getting tired
XRP is still facing challenges, but recent chart patterns suggest the selling pressure might be weakening. While the price remains in a general downward trend, currently fluctuating between $1.33 and $1.36 after failing to break through resistance, the decrease in trading volume alongside the price drop is particularly interesting. It suggests the downtrend may not be as strong as it appears.
Recent price drops haven’t been accompanied by a surge in trading activity, even though prices are consistently falling and making lower highs. This is noteworthy because increasing volume typically confirms a strong downward trend driven by sellers. Here, the lack of increased volume suggests the opposite – that the selling pressure is weakening and the trend may be losing steam. This often signals that the price decline is nearing an end.
Looking at XRP’s recent price action, I’ve observed a brief attempt at a rally that stalled around the $1.38 to $1.40 level – a price point that aligns with key moving averages and previous resistance. Since then, the price has pulled back towards support, but it’s been a relatively gentle decline. The smaller trading candles and lack of strong selling pressure suggest to me that the bears aren’t fully in control right now.
XRP’s key levels under protection
XRP continues to stay above an upward trendline formed by its recent lowest prices. Even though this trend isn’t very strong, it indicates buyers are still defending key price points. If this support level holds, the market may be settling into a period of stability instead of falling further.
Investors are seeing signs that XRP’s recent downward trend might be ending. The lack of significant selling suggests the pressure is decreasing. If buyers step in, even with modest activity, XRP could rise back towards the $1.38 to $1.42 price range. If it breaks above that range, it could signal a stronger recovery and reverse the current negative trend.
However, if the price drops below its recent low and trading volume significantly increases, it would suggest sellers are now dominating. For now, XRP remains vulnerable, but decreasing negative feelings could allow buyers to start pushing the price up.
Focus on Ethereum
Even though many traders are still watching for prices to keep falling, Ethereum is showing promising signs of a potential turnaround. After a significant drop from over $4,000, the price has found support and is holding steady between $2,100 and $2,300. This stability is a key indicator that suggests a shift in momentum, and it’s something many investors aren’t noticing.
The most obvious change is how Ethereum is behaving. Instead of continuing to fall sharply, it’s now stabilizing and showing slightly higher lows. This pattern often happens before a major price move, especially after a large drop like the one we saw earlier this year. It suggests a period of building a base before the next significant trend.
The recent market downturn forced many hesitant investors to sell, but since then, trading has become more stable – a typical sign that larger investors are starting to buy.
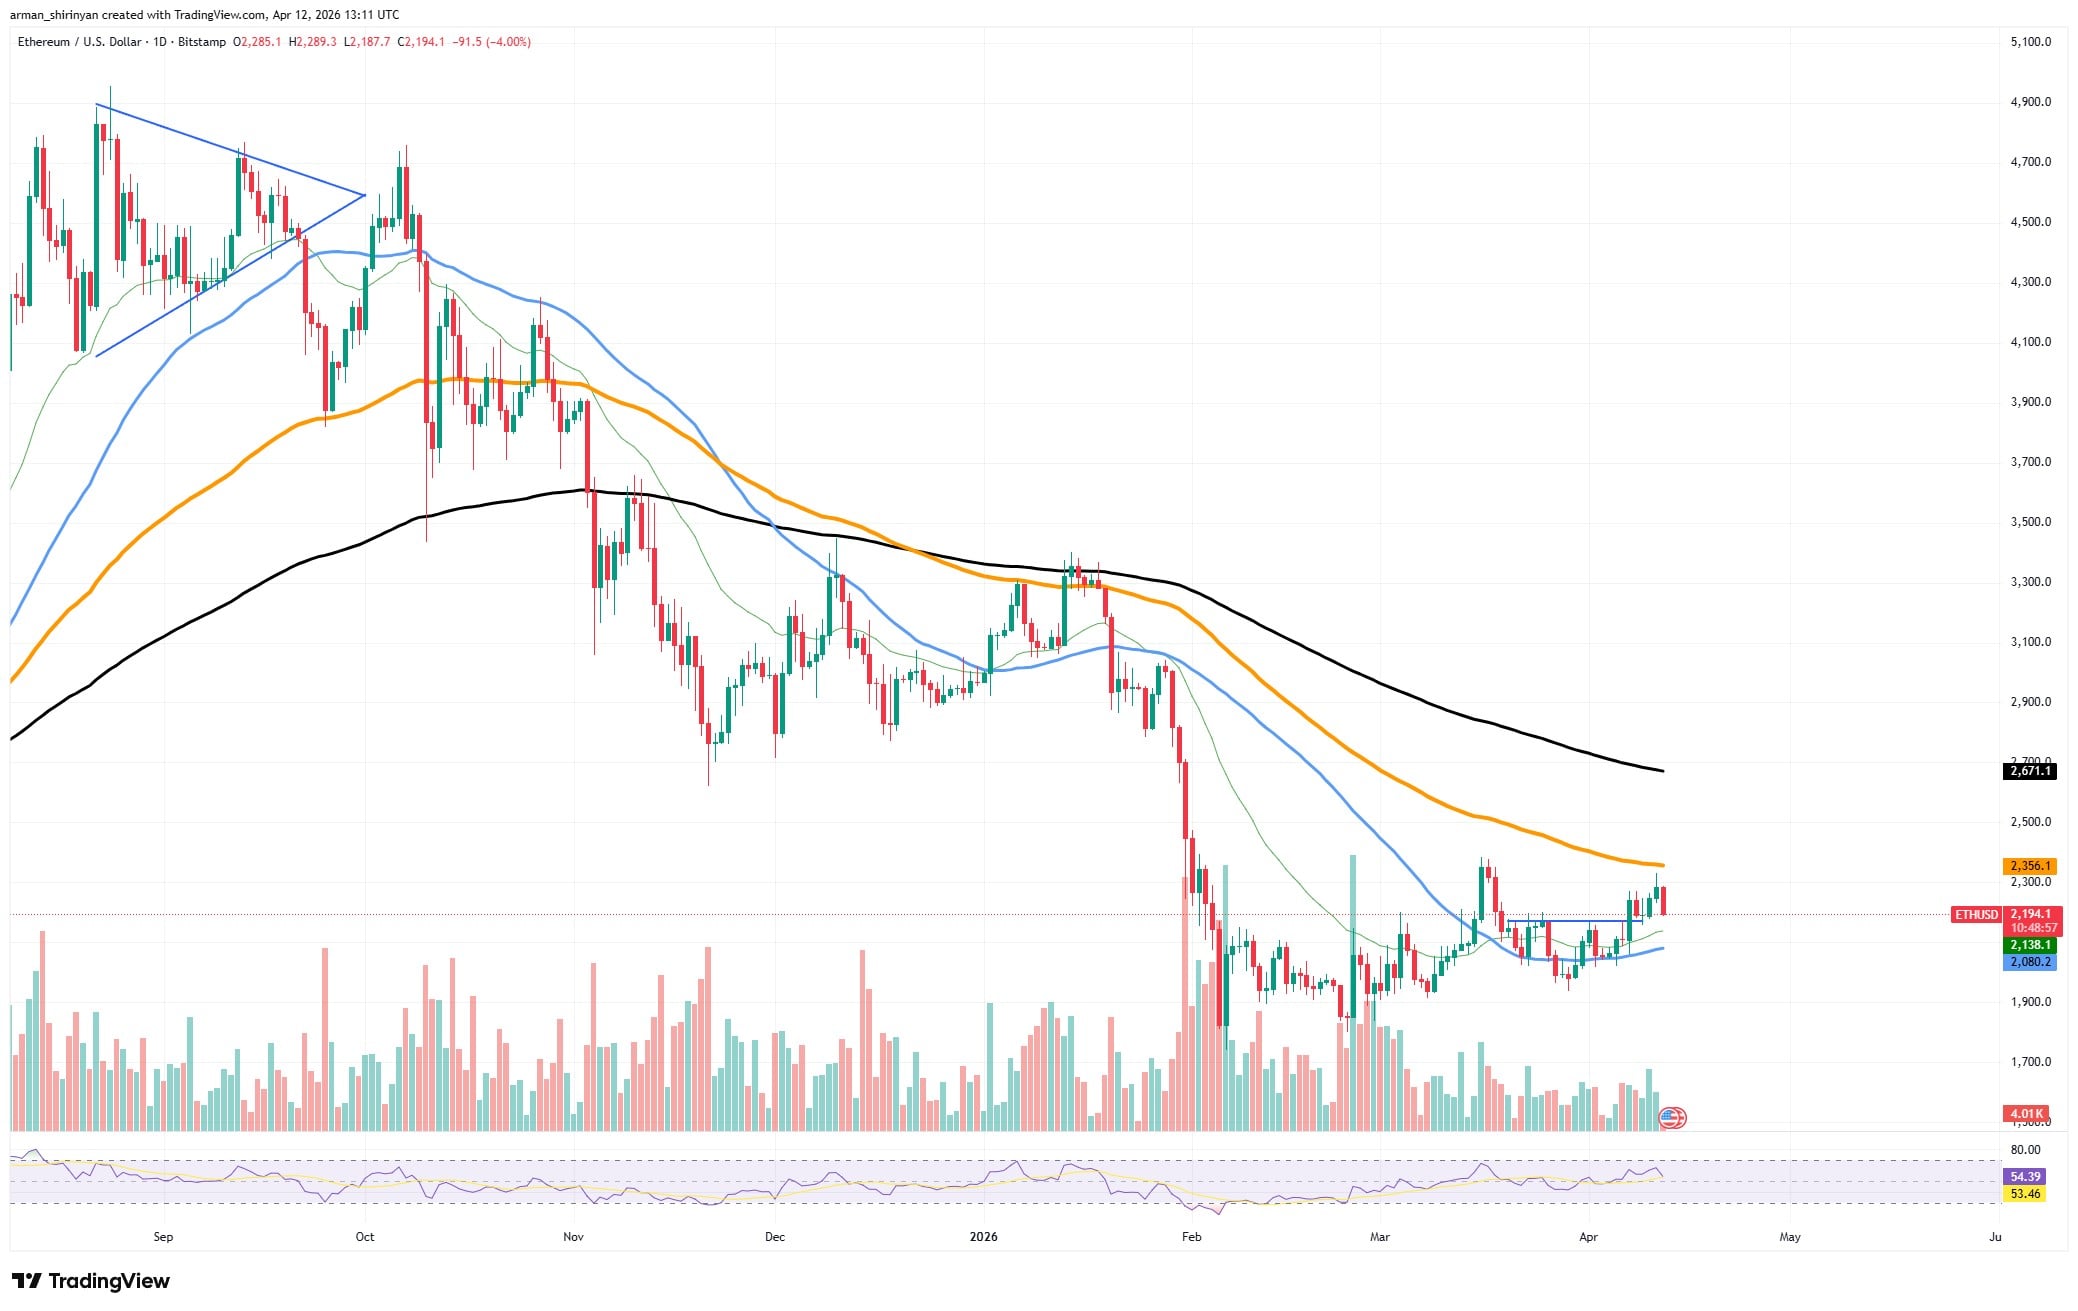
The case for a price increase is supported by trading volume. We saw a large spike in volume when the price first dropped, which showed strong selling. However, volume has now leveled off, suggesting that the price is unlikely to fall much further.
As an analyst, I’m watching how Ethereum handles resistance closely. What’s interesting is that every time the price tries to go higher, we haven’t seen a big sell-off. Instead, it dips a little but still holds its overall structure. To me, this suggests buyers are stepping in to absorb the selling pressure. This isn’t typical of a struggling asset; it’s more what I’d expect to see as the market transitions from a downtrend, through neutral territory, and potentially towards an uptrend.
The key takeaway for investors is that Ethereum is proving its resilience even without a huge price jump. Behind the scenes, the groundwork for future growth is already being laid. If ETH can consistently stay above the $2,300-$2,400 level, it could quickly shift market opinion and catch many investors off guard.
Ethereum is growing steadily despite recent challenges. While things may not look great right now, conditions are improving and a recovery is likely.
Read More
- The Super Mario Galaxy Movie: 50 Easter Eggs, References & Major Cameos Explained
- Surprise Isekai Anime Confirms Season 2 With New Crunchyroll Streaming Release
- ‘Project Hail Mary’: The Biggest Differences From the Book, Explained
- 10 Best Free Games on Steam in 2026, Ranked
- All 7 New Supes In The Boys Season 5 & Their Powers Explained
- Frieren: Beyond Journey’s End Gets a New Release After Season 2 Finale
- Skate 4 – Manny Go Round Goals Guide | All of the Above Sequence
- Silver Rate Forecast
- Starfield (PS5) Review – A Successful Cross-Console Voyage
- Preview: Sword Art Online Returns to PS5 as a Darker Open World Action RPG This Summer
2026-04-13 03:12