According to analyst Charting Guy’s latest chart comparison to XRP, Dogecoin might still be building a long-term base. This suggests a significant price increase, potentially reaching previous highs, may not happen until around mid-2028. The chart indicates a prolonged period of consolidation before any major breakout.
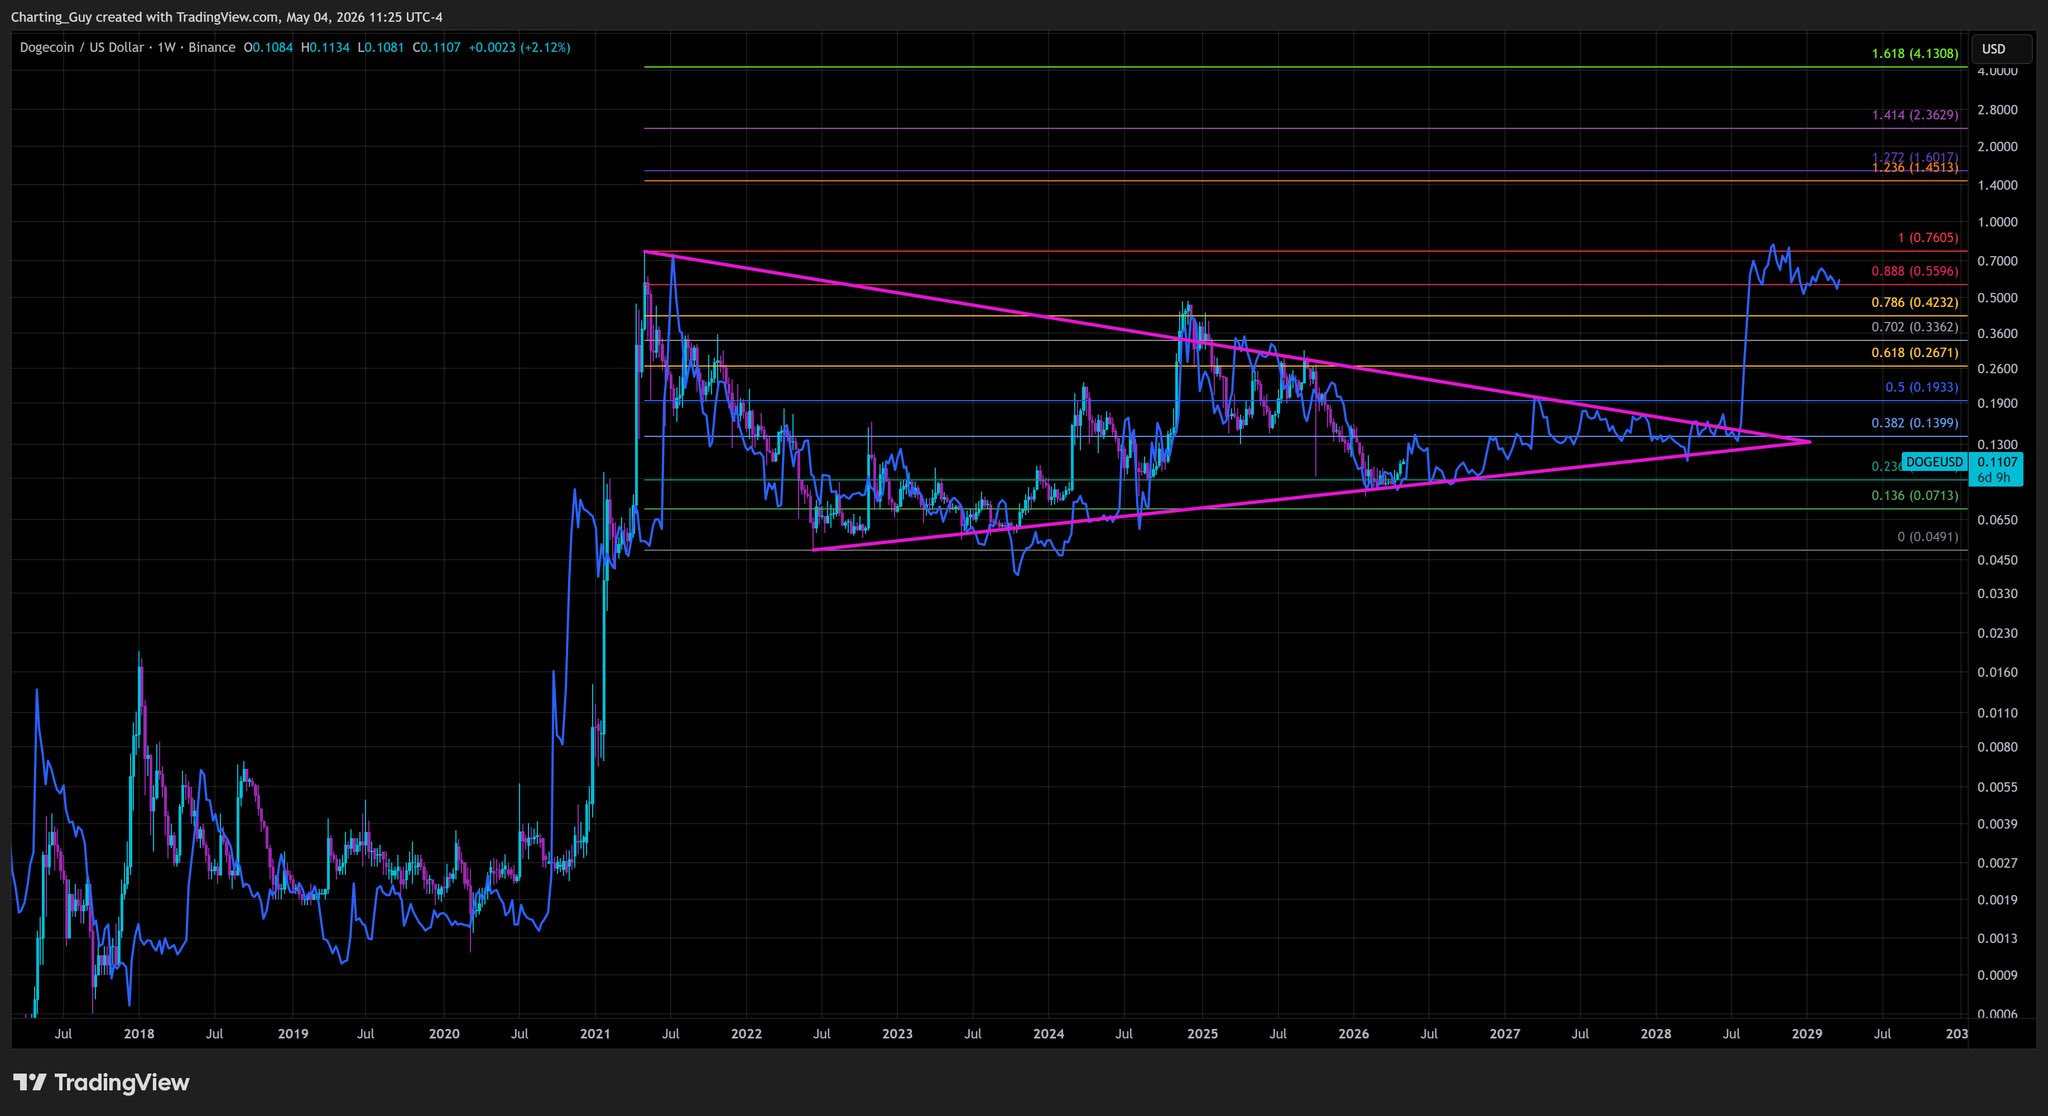
On May 4th, a trader known as Charting Guy posted an updated chart comparing Dogecoin’s price pattern to that of XRP. The chart shows Dogecoin currently trading around $0.107 and still moving within a large, long-term triangular pattern that formed after its peak in 2021. Essentially, the chart suggests Dogecoin might follow a similar price trajectory as XRP.
What This Could Mean For Dogecoin Price
The predicted path for DOGE doesn’t show a quick jump in price. Instead, it suggests a gradual and steady climb throughout the rest of 2026 and into 2027, similar to how XRP behaved after its initial surge. Based on this analysis, a significant price increase isn’t expected until late 2027 or early 2028, with the most substantial gains likely appearing around mid-2028.
This brings up the question of Dogecoin’s potential peak price. Its previous high was around $0.76, coinciding with a specific technical level. Current projections suggest Dogecoin won’t surpass this level anytime soon; it needs to stabilize and consolidate for a longer period before attempting to reach new highs. If the price pattern of XRP continues, Dogecoin is unlikely to hit a new all-time high until around 2028, not in the near future.
I remember back in January, The Charting Guy pointed out something interesting about DOGE. He basically said if we were seeing a certain pattern form, it meant the worst of the downturn was likely behind us. It wasn’t really about predicting a specific price, but more about where DOGE was in the bigger picture – past the lowest point, but before the really big move up. It’s helpful to remember that original take now, because it suggests this current pattern isn’t just about a price target, but about the overall cycle.
The chart features several Fibonacci extensions extending above the recent peak, specifically at $1.451, $1.607, $2.362, and $4.130. These levels sparked discussion, with one user questioning if $4 was the expected high. Charting Guy clarified that the chart doesn’t guarantee a $4 DOGE price, explaining that the fractal pattern shouldn’t be taken as a firm price target.
DOGE faces several potential resistance levels, based on Fibonacci retracements, before it could reach its previous peak price. These levels are approximately $0.107, $0.139, $0.193, $0.267, $0.336, and $0.423. Beyond that, further resistance is expected around $0.559, and finally near $0.7605, which represents the previous all-time high.
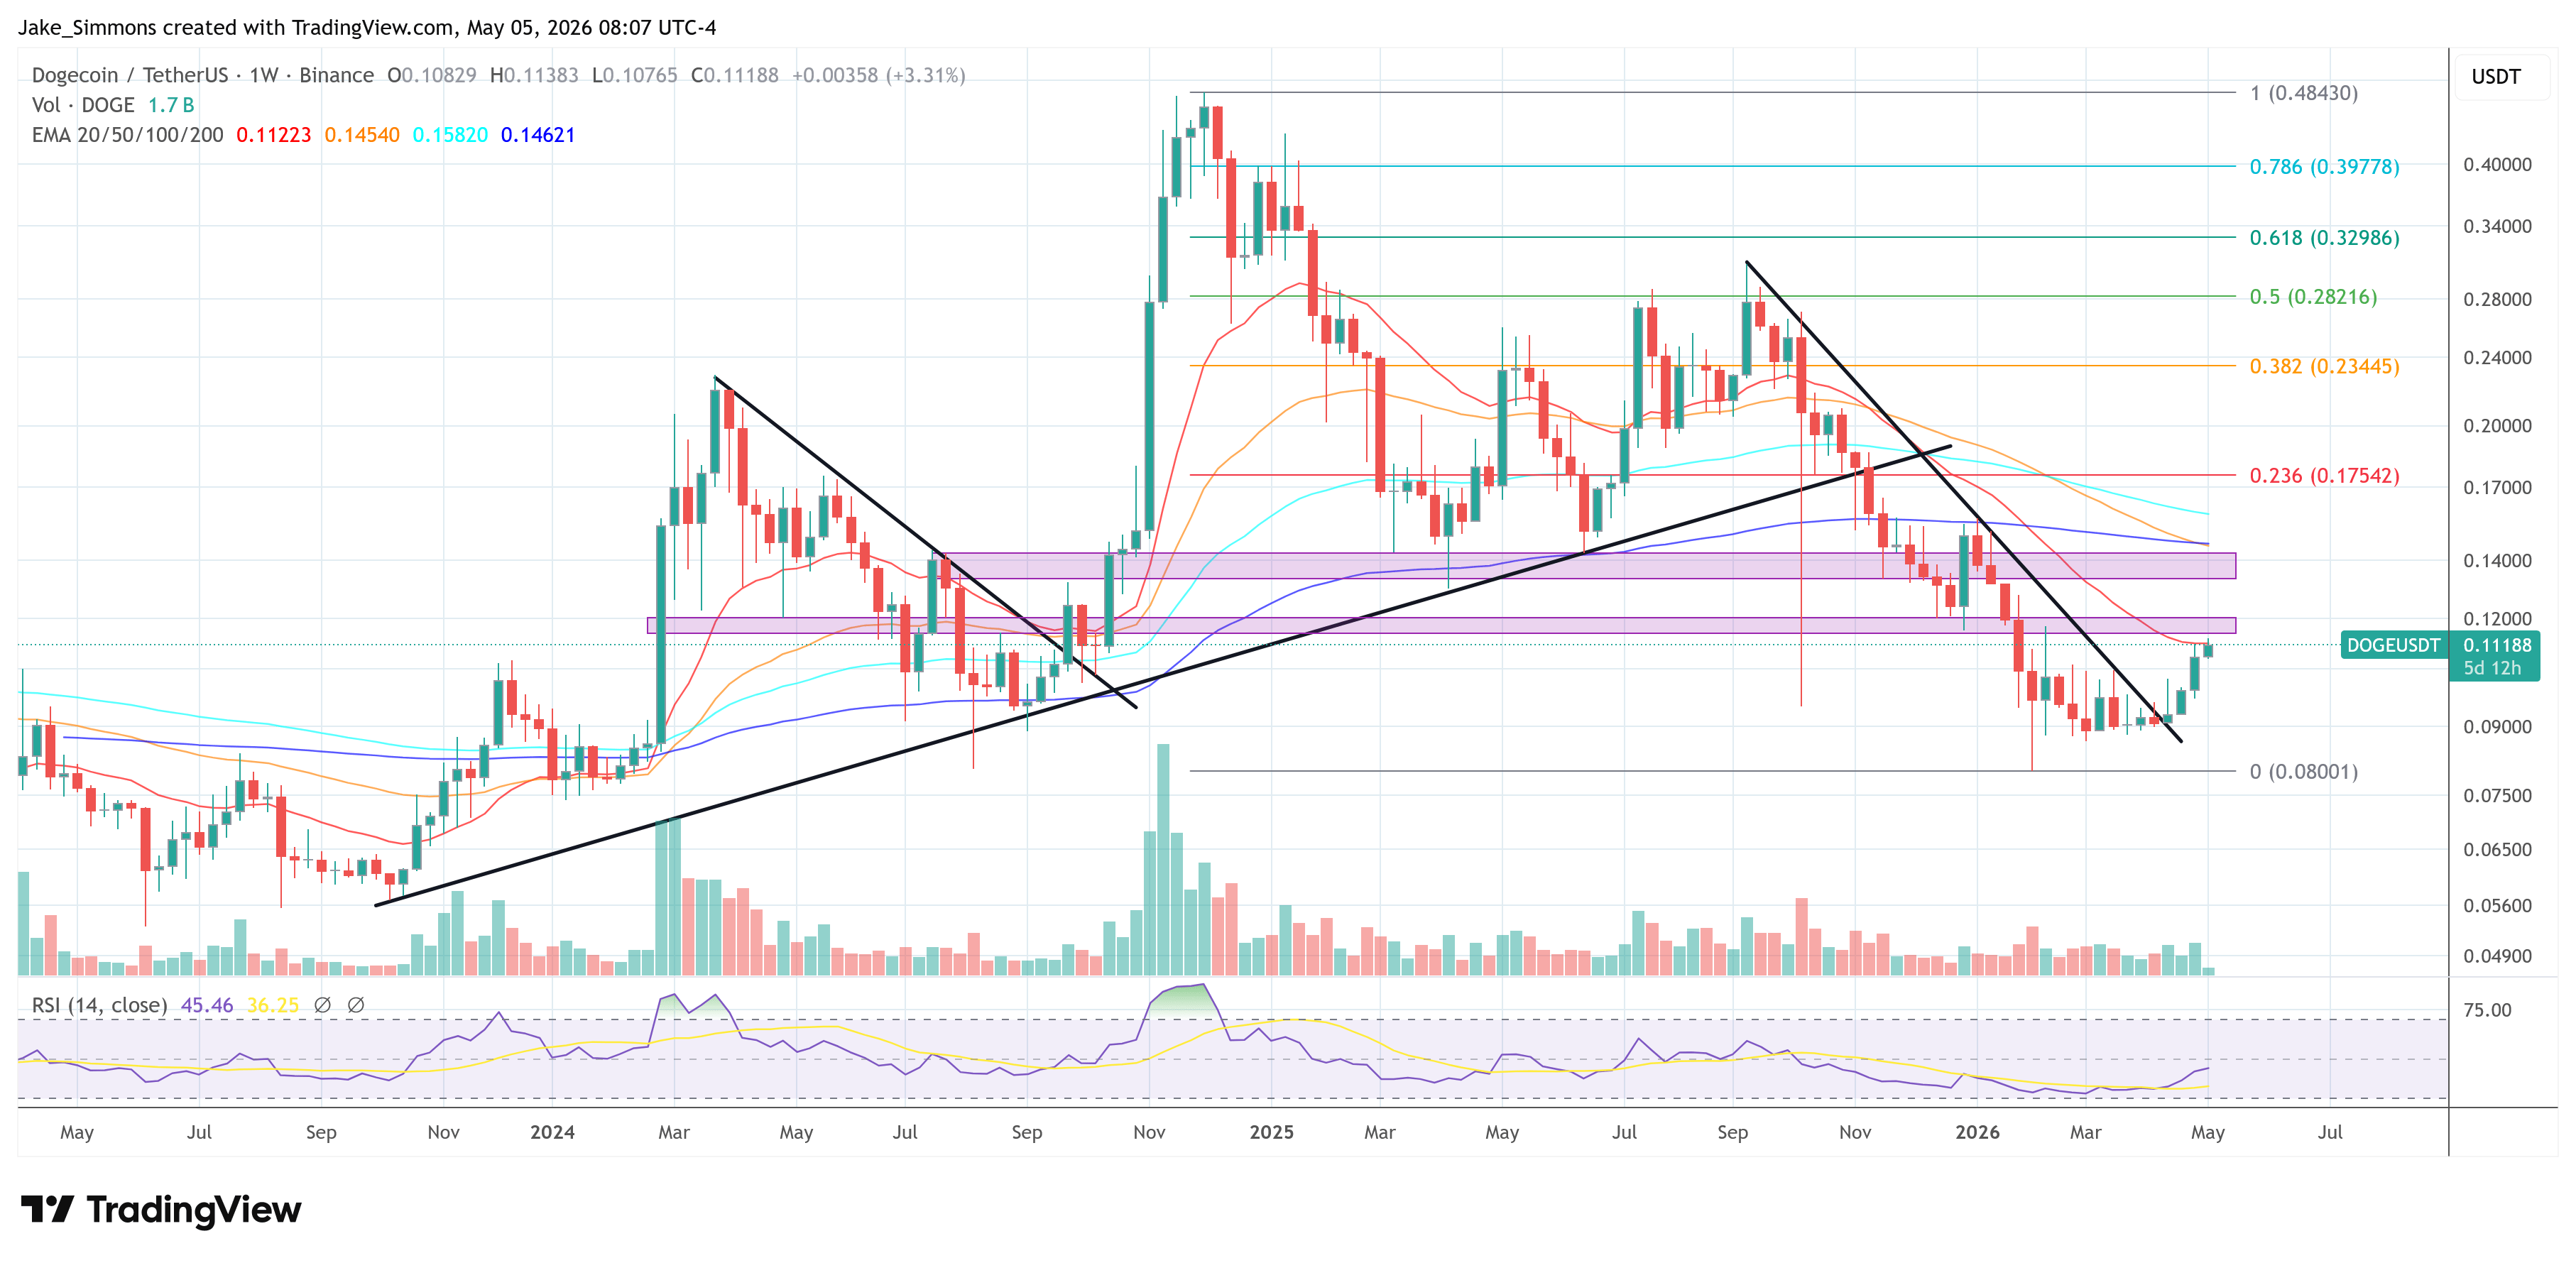
At press time, DOGE traded at $0.11188.
Read More
- Elon Musk’s Mom Maye Musk Shares Her Parenting Philosophy
- GBP CNY PREDICTION
- Mark Zuckerberg & Wife Priscilla Chan Make Surprise Debut at Met Gala
- Forza Horizon 6 Car List So Far: Confirmed Highlights, Cover Cars, DLC, and Rewards
- 10 Greatest Manga Endings of All Time
- Elon Musk’s Ex Ashley St. Clair Reveals When Romance Became “Weird”
- 10 Best Free Games on Steam in 2026, Ranked
- Hollow Knight: Silksong Guide – All 30 Lost Flea Locations
- 38 Years Later, Murder, She Wrote’s Most Overlooked Episode Still Pulls Off TV’s Greatest Crossover
- 20 K-Dramas That Nailed the Perfect Ending
2026-05-06 03:42