Cardano’s price is approaching a support level around $0.243. Currently, more traders are betting the price will go up (long positions), but over $634,000 in positions have been closed due to price fluctuations. This suggests a critical point where the market is deciding which direction to move.
Cardano has returned to a key price zone near $0.243, and traders are watching closely.
This price level has been important in previous market trends, and traders are watching it closely now. How the price behaves around this point will likely indicate the next direction, as both buyers and sellers weigh their options.
Market Turns Attention to Key Support Zone
In previous market trends, the price between $0.23 and $0.24 has consistently served as a reliable floor, meaning the price often bounced back up after falling to this level.
Now, traders are watching closely to see if the current price level will bounce back. However, multiple attempts to drop below this level are creating more downward pressure.
Every attempt to bounce back could actually make the price fall further, increasing the chance of a significant drop. But, if the price shows resilience, it might still draw in buyers and limit how quickly it falls.
Cardano has returned to a make-or-break level at $0.243.
This area has traditionally been a key turning point for Cardano’s price movement. It’s often acted as a strong base, leading to substantial price increases.
If the bulls can defend this floor, it sets the stage for a relief…
— Ali Charts (@alicharts)
The market is currently trading in a narrow range, indicating uncertainty among traders. Neither buyers nor sellers are firmly in control at this time.
The market’s next move could determine its immediate direction. Experts believe this price point is key to understanding the overall trend.
As I’ve been watching the markets, I’ve noticed a key pattern: support levels tend to weaken each time they’re tested repeatedly. This means we really need to focus on what the price is *currently* doing, as those previous support areas might not hold up if tested again.
Trend Structure Signals Mixed Momentum
Cardano continues to trade within a broader downtrend, marked by lower highs.
Prices have been falling quickly, but rising slowly and inconsistently. This suggests that sellers currently have the upper hand.
Recently, the price hasn’t been falling as quickly as it was before, suggesting the downward trend might be losing steam. The latest drop to around $0.24 seems less forceful than previous ones.
In addition, candles show more overlap, which suggests weaker selling pressure.
Momentum indicators suggest the market is currently balanced. The RSI reading, staying between 40 and 50, confirms this neutral trend.
At the same time, MACD remains flat, showing no clear direction.
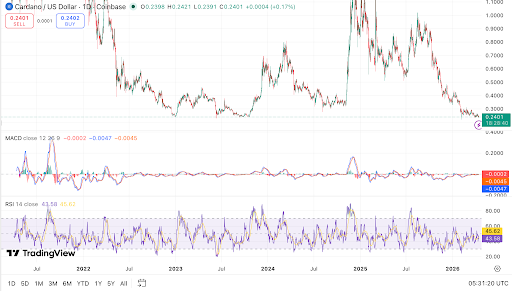
However, a clear change in direction hasn’t happened yet. The price would need to rise above $0.30 to signal a new trend.
Until then, the trend remains cautious, with signs of possible stabilization.
Read Also:
Cardano Price Holds $0.24 Amid Bearish Trend: What’s Next for ADA?
Sentiment and Liquidation Data Shape Market Outlook
Current market data indicates that most traders are currently betting on prices going up. Binance reports that for every one trader betting on a price decrease, almost two are betting on an increase, with a ratio of 1.98. OKX shows an even stronger preference for rising prices, with nearly three traders betting on an increase for every one betting on a decrease (a ratio of 2.96).
This indicates that many traders believe prices will go up. This kind of market activity can be a sign of potential trouble.
If a lot of traders are making the same bets, the market can sometimes turn against them. One analyst put it simply: popular trades are more likely to fall in value than to keep rising.
Leading traders are showing conflicting signals. While they generally seem to be betting on prices going up, the amount of money they actually have invested isn’t significantly skewed in either direction.
This suggests that larger players are not fully committed to one direction.
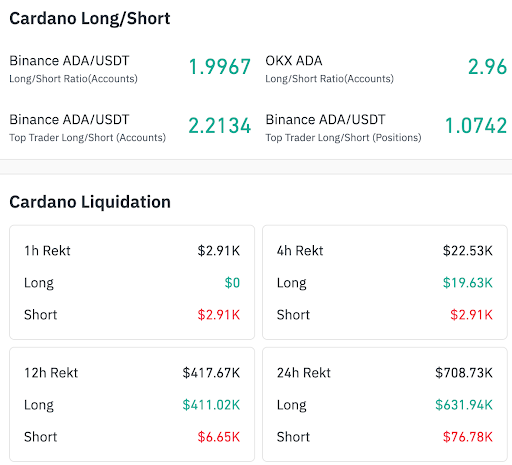
Liquidation data gives us more insight into what’s happening. In the last 12 hours, roughly $427,000 worth of long positions were closed.
Over 24 hours, this number reached around $634,000, while short liquidations stayed limited.
These factors are making the market tricky right now. A lot of investors are still holding onto their positions, which means prices could still fall.
On the other hand, recent liquidations may have removed weaker positions.
Read More
- Trails in the Sky 2nd Chapter launches September 17
- HBO Max Just Added the Final Episodes of a Modern Adult Swim Classic
- Paradox codes (April 2026): Full list of codes and how to redeem them
- Crimson Desert’s Momentum Continues With 10 Incredible New Changes
- Pragmata Shows Off Even More Gorgeous RTX Path Tracing Ahead of Launch
- PRAGMATA ‘Eight’ trailer
- Dragon Quest Smash/Grow launches April 21
- How Could We Forget About SOL Shogunate, the PS5 Action RPG About Samurai on the Moon?
- Hulu Just Added One of the Most Quotable Movies Ever Made (But It’s Sequel Is Impossible To Stream)
- Solo Leveling’s New Character Gets a New Story Amid Season 3 Delay
2026-04-15 10:11