On April 30th, WhiteBIT Coin (WBT) surpassed a key resistance level of $58.70, increasing its value by over 5.8% as buyers took charge. This breakthrough suggests the price could continue rising, potentially reaching its previous high of $64.40.
Currently, the token is trading at $57.10, as reported by CoinGecko. Technical indicators suggest increasing buying pressure, with the Relative Strength Index (RSI) going up and the Moving Average Convergence Divergence (MACD) showing a positive trend. While the token has strong momentum in the short term, it might need a small pause before it attempts to reach a new all-time high.
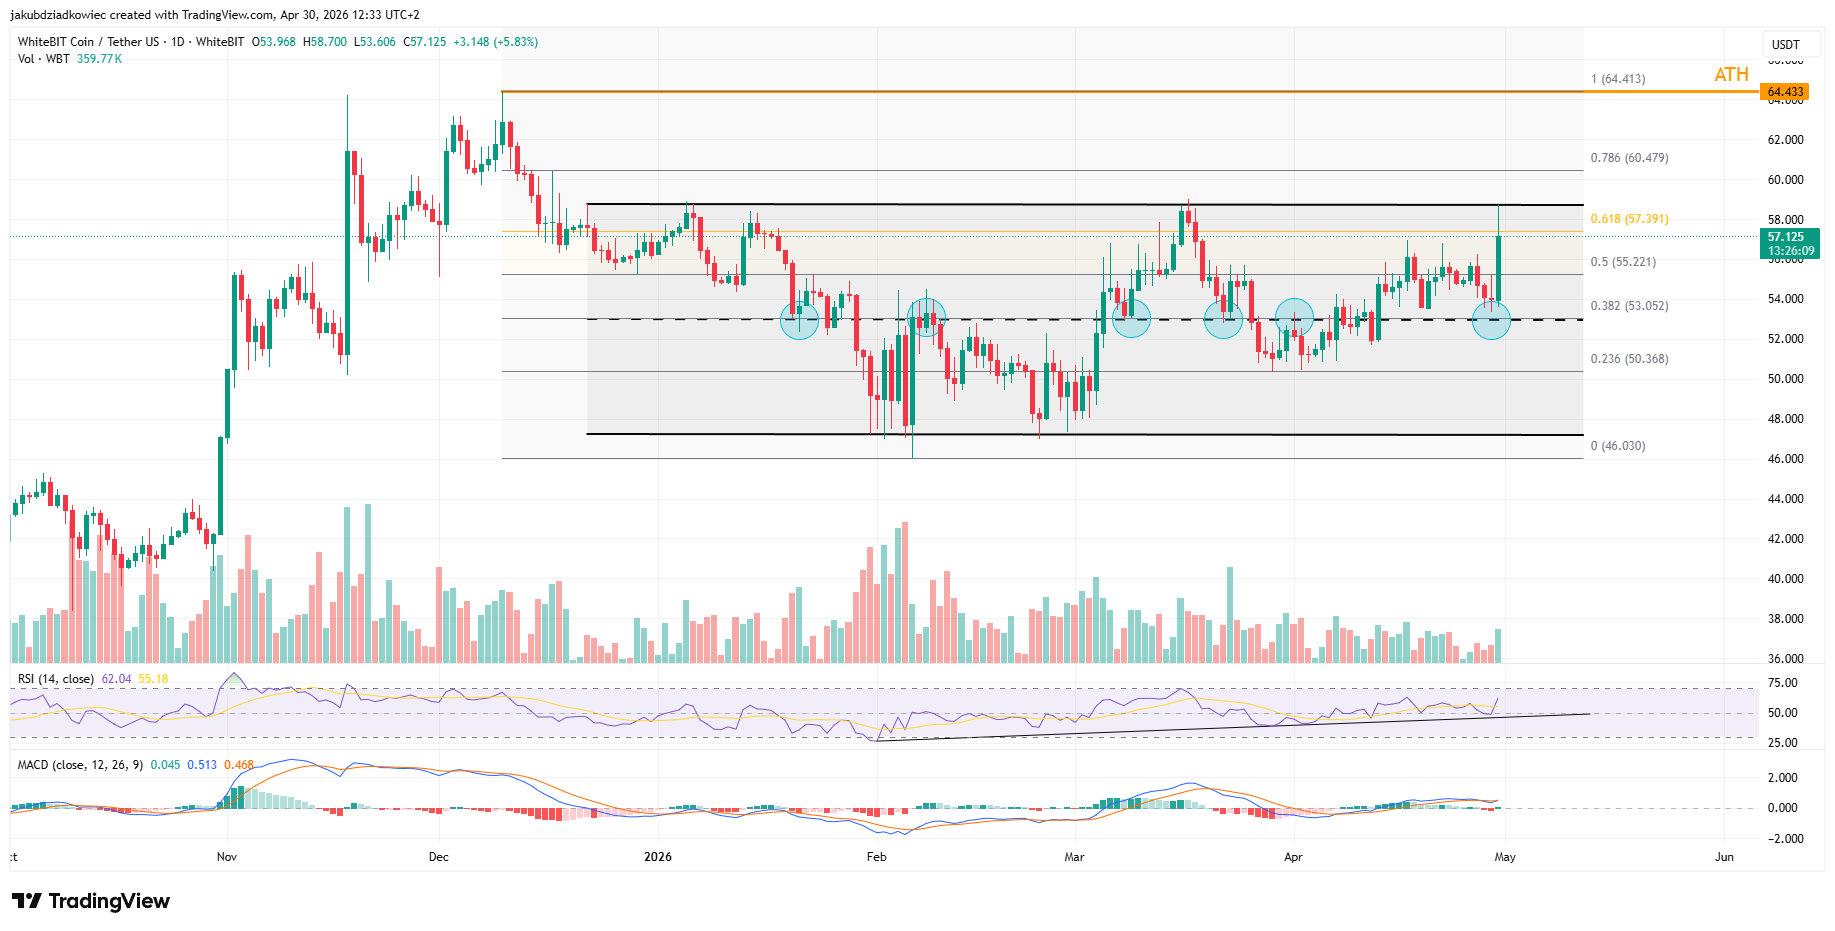
Daily WhiteBIT Chart Breaks Out Toward Record High
Looking at the daily price chart, WBT traded mostly sideways throughout 2026, staying within a range between $46 and $58.70. The $53 level, which is also a key Fibonacci retracement point, has repeatedly acted as both support and resistance, as highlighted by the blue circles on the chart.
On April 30th, the price increased by 5.83%, clearly surpassing a previous high and creating potential for a new record near $64.40. If the price closes above $58.70, that level will likely act as a new support level.
Trading volume, which had been decreasing until April, began to increase as the price broke out, signaling potential upward momentum. The Relative Strength Index (RSI) also showed strength, rebounding from an upward trend and currently at 62, suggesting it could still rise further. The Moving Average Convergence Divergence (MACD) indicator has turned positive again after a short-term negative signal.
As a crypto investor, I’m really encouraged by what’s happening with WBT. The tech looks solid, but it’s the recent developments that have me excited – getting added to the S&P Dow Jones Indices is a big deal, and the listing on Kraken should bring in more buyers. Plus, with the market cap now over $12 billion, WBT is becoming a really liquid altcoin, and I think it has the potential to hit a new all-time high, especially as we head into May.
If the price drops below $58.70, it will likely return to its previous trading range. We could then see support around $53.05, with an even lower level of support near the price established after the recent unlock event.
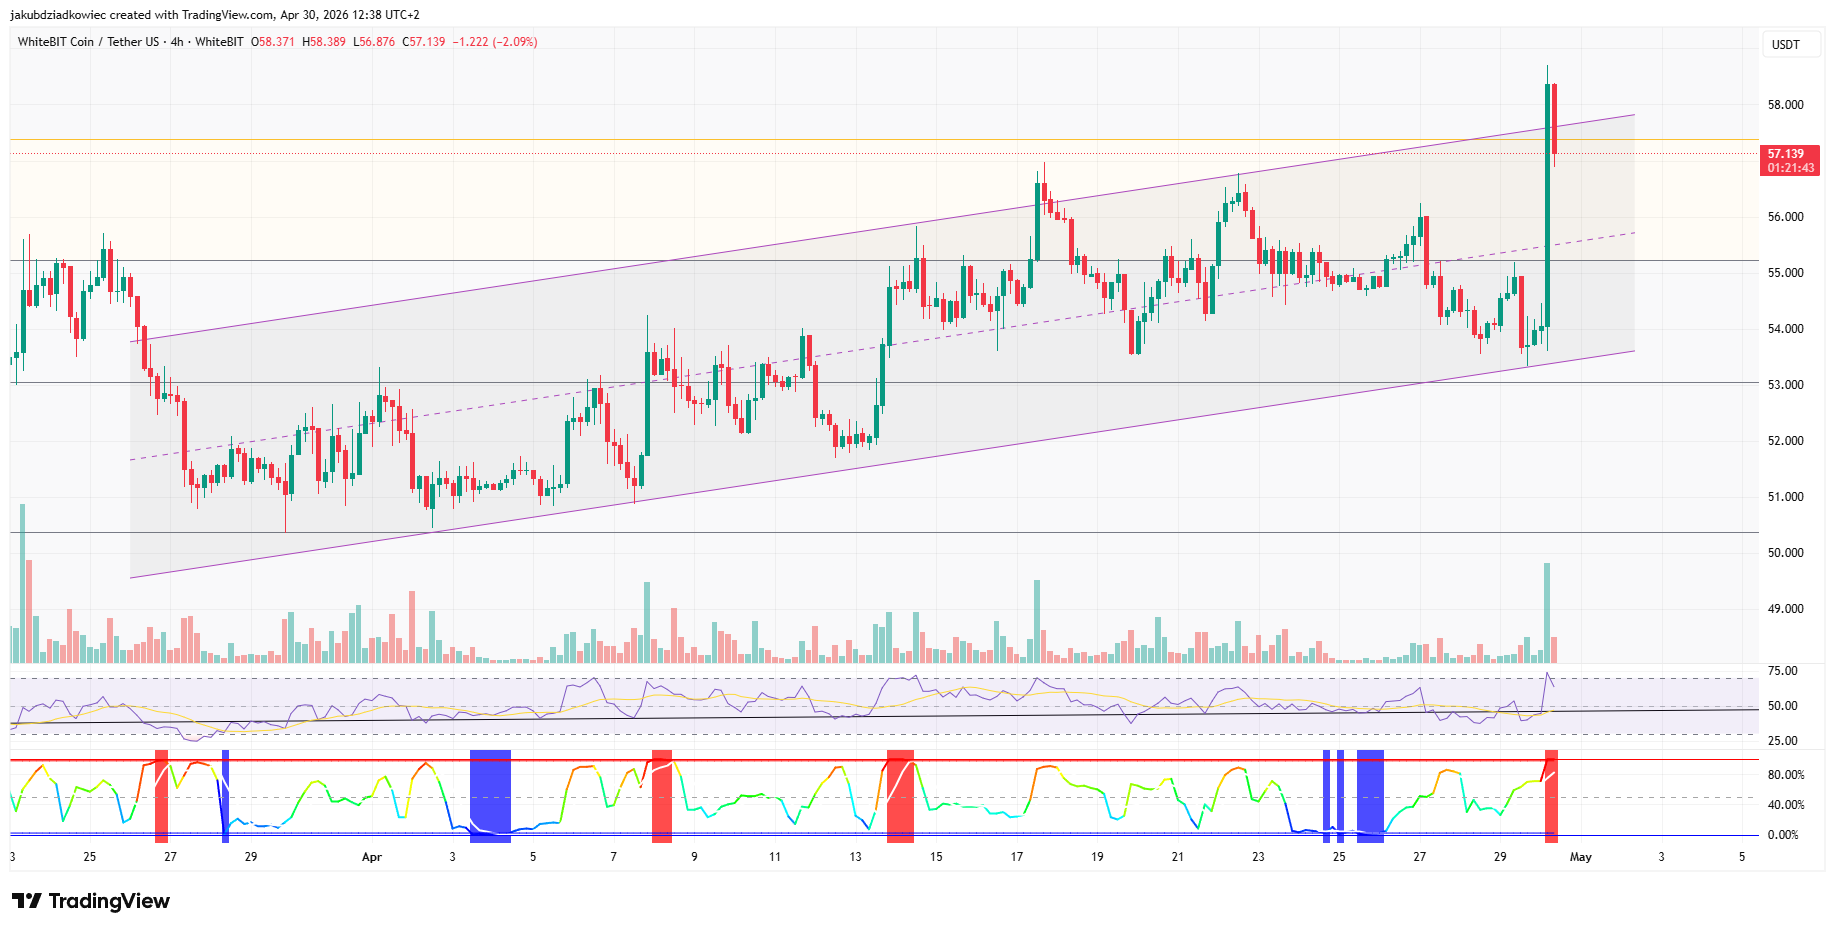
4-Hour Channel and Volatility Expansion Confirm Buyer Strength
Looking at the 4-hour chart, WBT has been moving within a clear upward channel since the beginning of April. The price has consistently found support around $51, acting as a floor, while it recently reached a high of $58.39 near the channel’s upper boundary of approximately $58. This suggests buyers are actively defending the lower levels.
Trading activity increased during the recent price rise, indicating that buyers were actively accumulating the asset instead of simply speculating. The price surge was accompanied by the highest trading volume of the month, confirming strong buying pressure.
The Bollinger Band Width Percentile indicator recently turned red, signaling a period of increased market volatility. This change followed several days of low volatility – specifically on April 24th, 25th, and 26th – which is a typical pattern often seen before significant price movements.
1H Chart Shows Overbought Conditions, Analyst Eyes $56.45 Retest
While the longer-term charts look positive, the 1-hour chart, according to analyst @AIRewardrop, suggests the price may be overextended. The price recently jumped to $58.19, causing the Relative Strength Index (RSI) to reach a very high level of 84.47, indicating it’s likely overbought. However, longer-term Exponential Moving Averages still show a bullish trend, remaining above the current price.
Our analysis shows the price has moved away from its 1-hour Exponential Moving Average and Volume Weighted Average Price. This indicates the price may soon correct itself before continuing any strong upward or downward trend.
An RSI of 84.47 shows strong upward momentum, but suggests the price has risen too quickly and may be due for a pause or period of sideways movement. It’s best to wait for the indicator to reset before considering new trades.
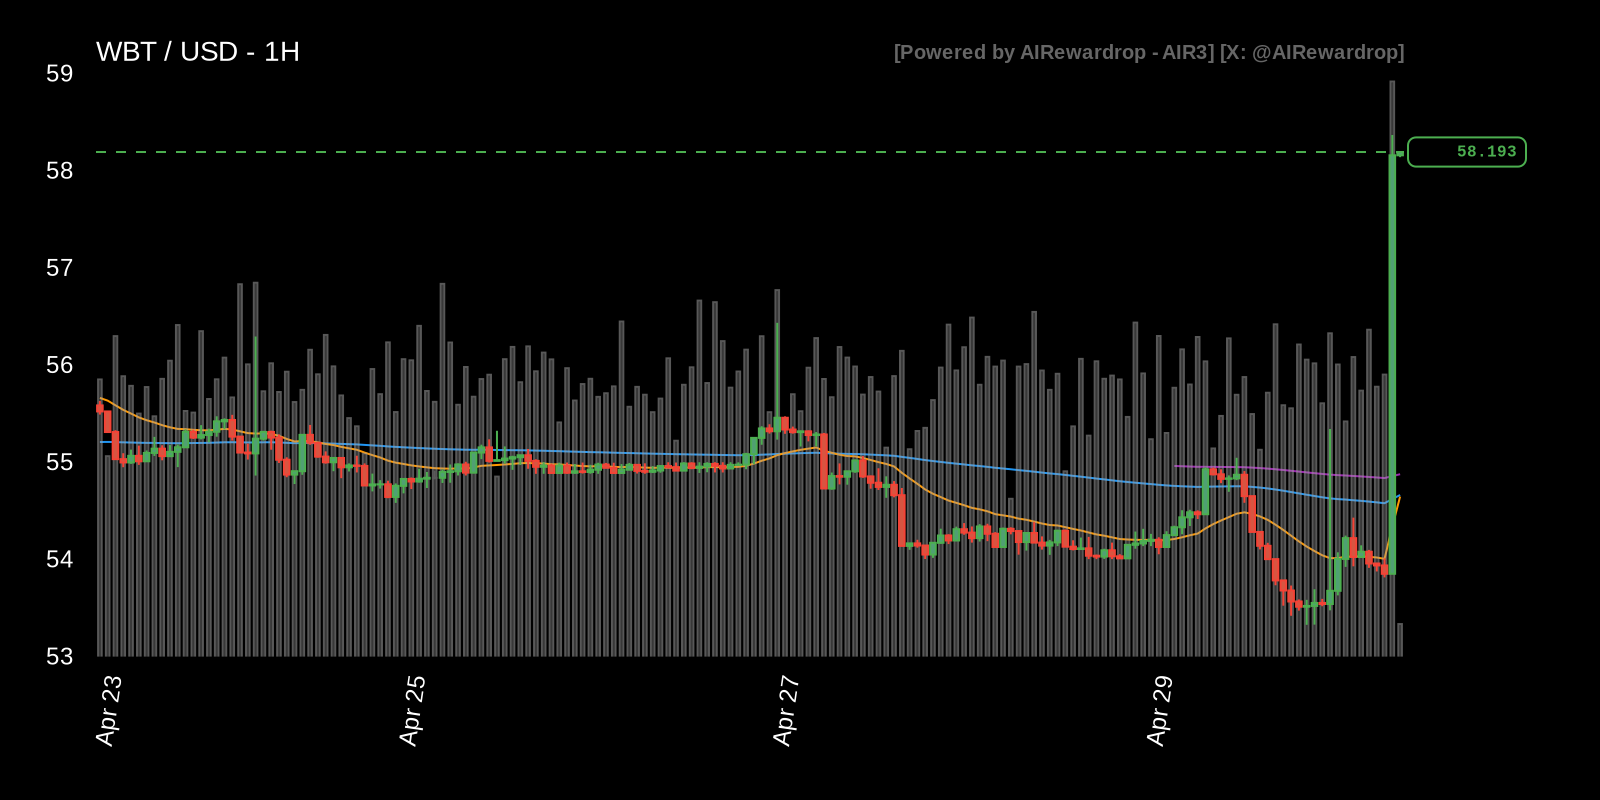
The analyst believes the price could find support around $56.45, which previously acted as a high point. If the price falls to $54.50, that would suggest the current upward trend is likely over. A drop to either of these levels would provide a better opportunity to buy, while still maintaining a positive outlook for the price.
Read More
- Marvel Officially Confirms Deadpool’s Most Brutal Redesign
- Nintendo Switch 2 Reportedly Getting Remake of One of the Best PS3 and Xbox 360 Games
- Welcome to Demon School! Iruma-kun season 4 release schedule: When are new episodes on Crunchyroll?
- Crunchyroll Confirms New Isekai Anime Releases for 2026 and Beyond (With Major Returns)
- Michael Jackson Biopic’s Record-Breaking Debut Unseats 2026’s Biggest Box Office Hit On U.S. Chart
- The Boys Season 5, Episode 2’s Soldier Boy Ending Twist Changes Everything for Homelander & Butcher
- 5 Best Open-World Games You Can Beat In A Weekend
- Gold Rate Forecast
- All 61 Episodes 90s Cult Classic Sci-Fi TV Show That Was Famously Canceled Twice Were Just Added to Tubi
- 10 Movies That Were Banned in Different Countries For Random Reasons
2026-04-30 19:02