Imagine, if you will, a world where Bitcoin isn’t just a digital currency but a mythical beast that somehow manages to leap from $78,000 to $500,000 in the span of a few years. Enter Peter Brandt, the financial equivalent of a mad scientist, who’s confidently predicting this absurdity by 2029-provided, of course, that Bitcoin behaves like a well-trained parrot and doesn’t suddenly decide to squawk its way into oblivion.
Brandt’s forecast is as conditional as a toddler’s promise to eat vegetables. “Should Bitcoin continue with the most remarkable cyclic patterns of any market in the past 15 years,” he writes, “an investable low is scheduled for Sep/Oct 2026.” Because nothing says “investable low” like a market that’s more fickle than a politician’s pledge.
But here’s the kicker: Brandt’s entire thesis hinges on the market not doing anything unexpected. Which, let’s be honest, is like telling a toddler not to eat the dog. The current setup? “Incomplete,” he says, because Bitcoin hasn’t yet proven it’s capable of doing anything more impressive than a drunken pirouette.
Why Brandt Is Not Calling A Bitcoin Bottom Yet
When a chartist named JDK Analysis suggested the market might be nearing a bottom, Brandt responded with the diplomatic finesse of a deflated balloon. “This does not look like a bottom,” he declared, as if the chart had personally insulted him. The chart, naturally, was too polite to respond.
JDK’s analysis was a masterclass in probabilistic optimism, suggesting that the recent rally was “a Short Re-Accumulation”-a term that sounds like a therapy session for overworked investors. But Brandt, ever the skeptic, was having none of it. “As long as bulls fail to show clear strength,” he said, “the current low doesn’t qualify as a strong bottom. This is purely a probabilistic view!” Because nothing says “strong bottom” like a probabilistic view.

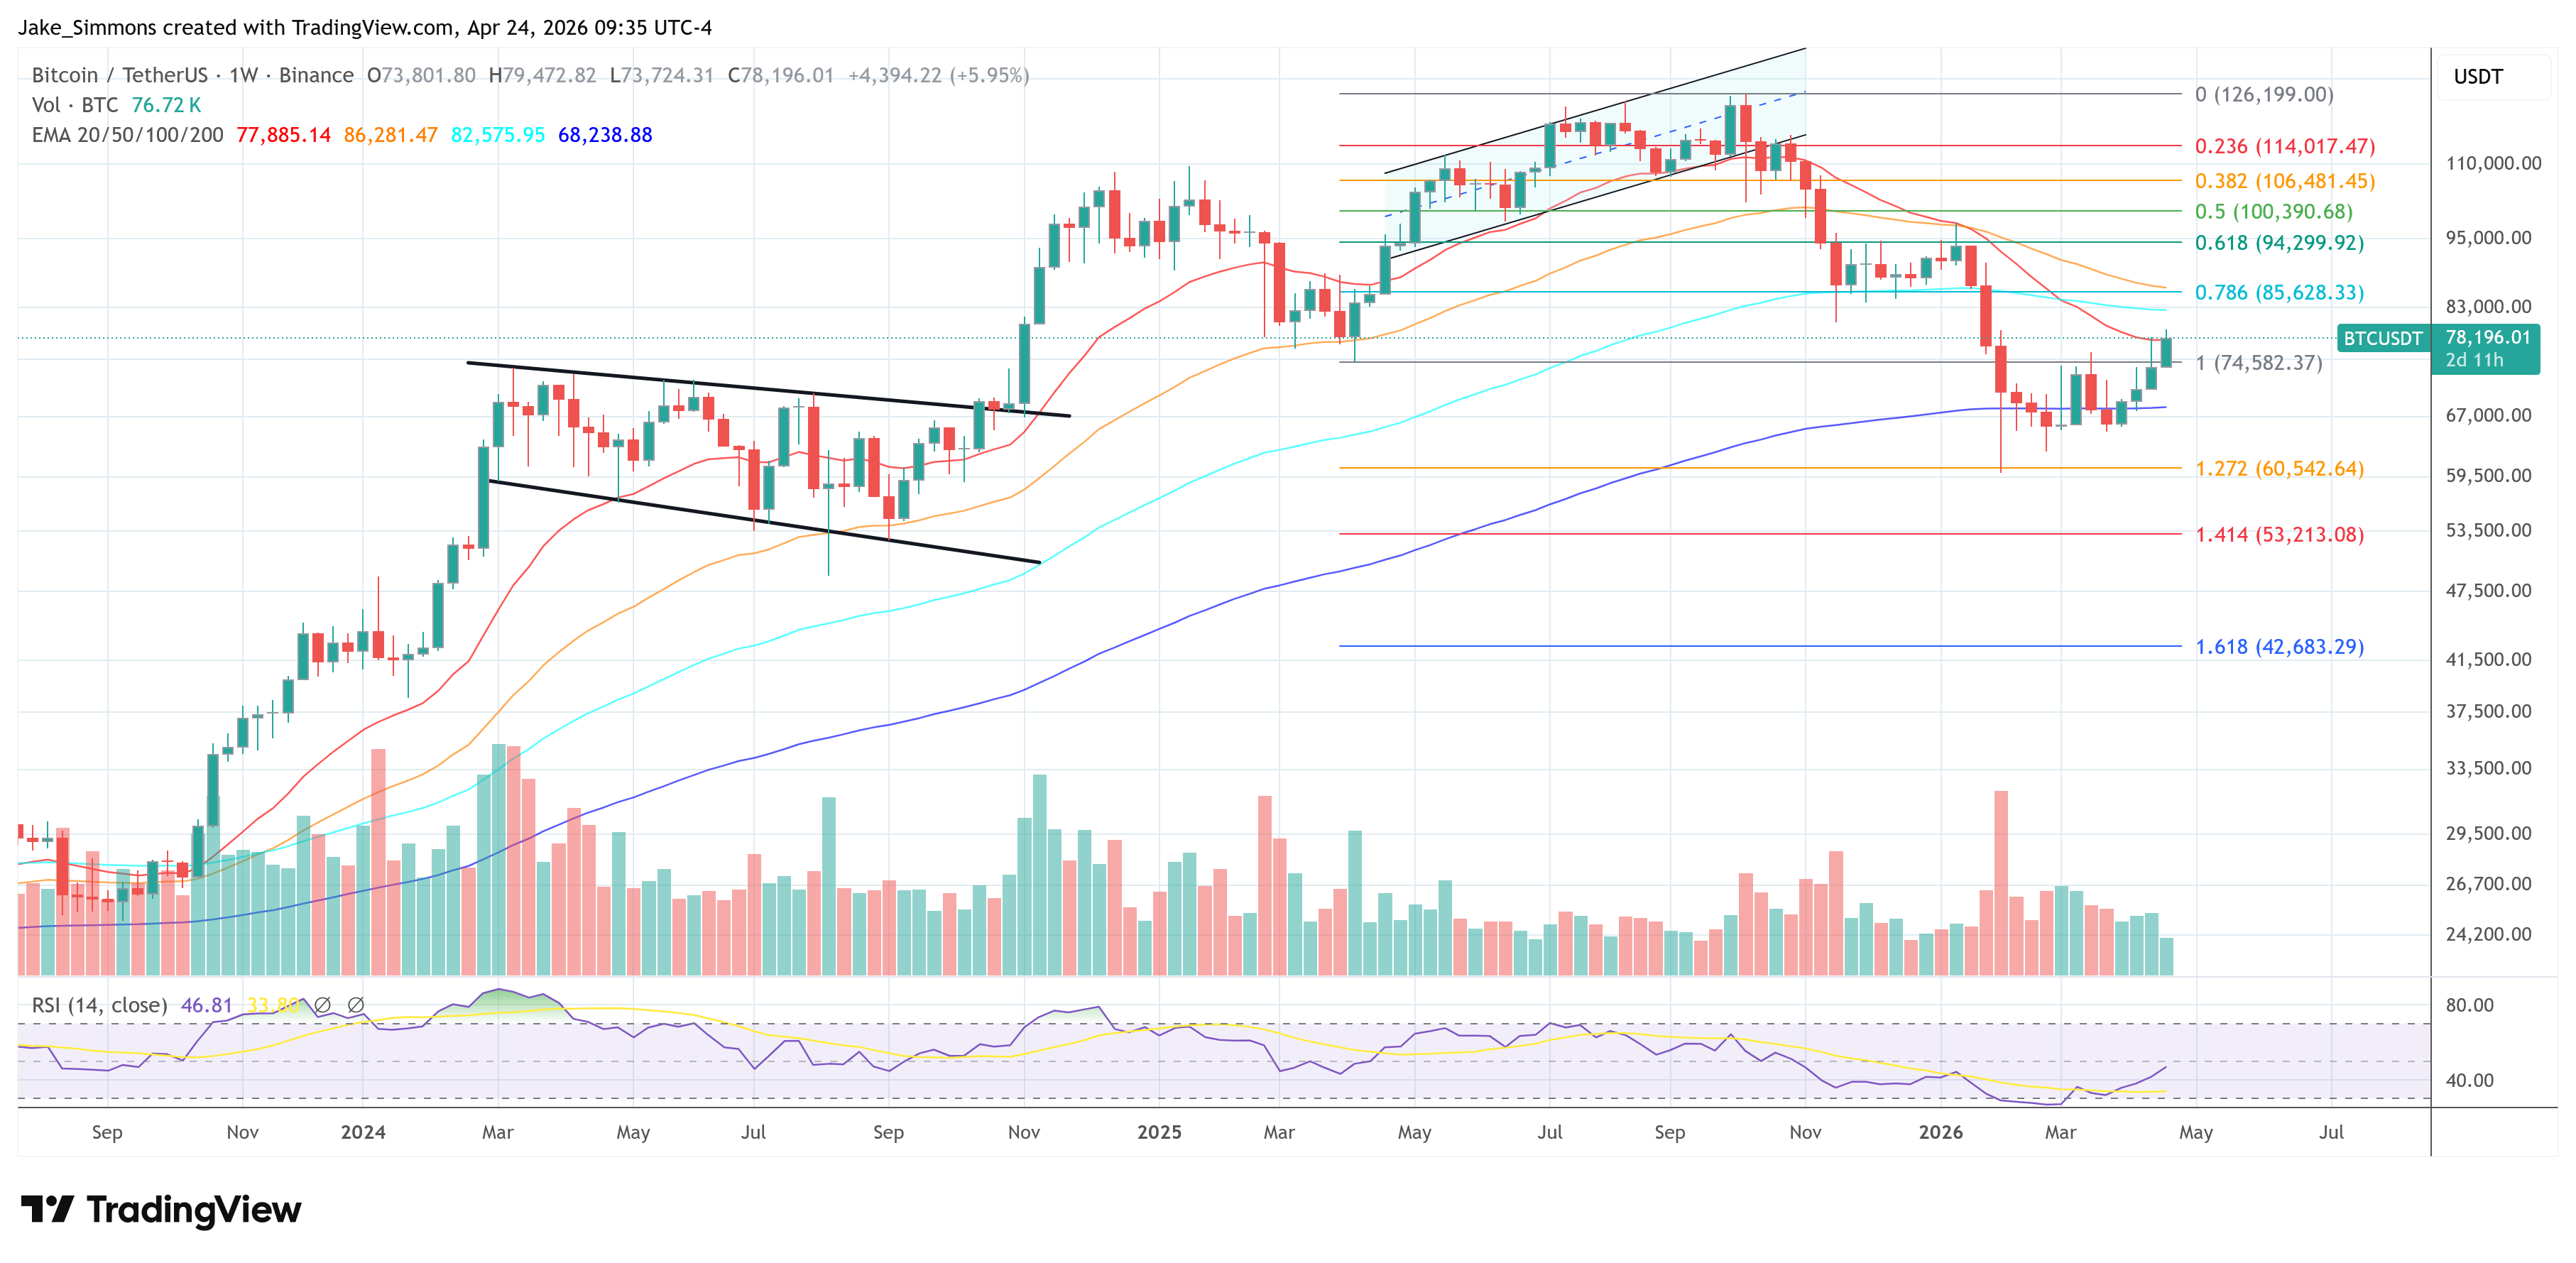
The chart in question looked like a surrealist painting-repeated tests of local highs, fading volume, and an invalidation level so high it might as well be on Mars. Brandt, meanwhile, was busy praising Aksel Kibar, a chartist so obsessed with technical structures that he probably dreams in candlesticks.
Kibar’s advice? “We can’t be dogmatic about our analysis. What looks like a wedge can morph into a channel.” Which is great, unless the channel turns out to be a glorified drainpipe. The BTC chart in question, meanwhile, was playing the role of a shape-shifting chameleon, refusing to settle on a single identity.
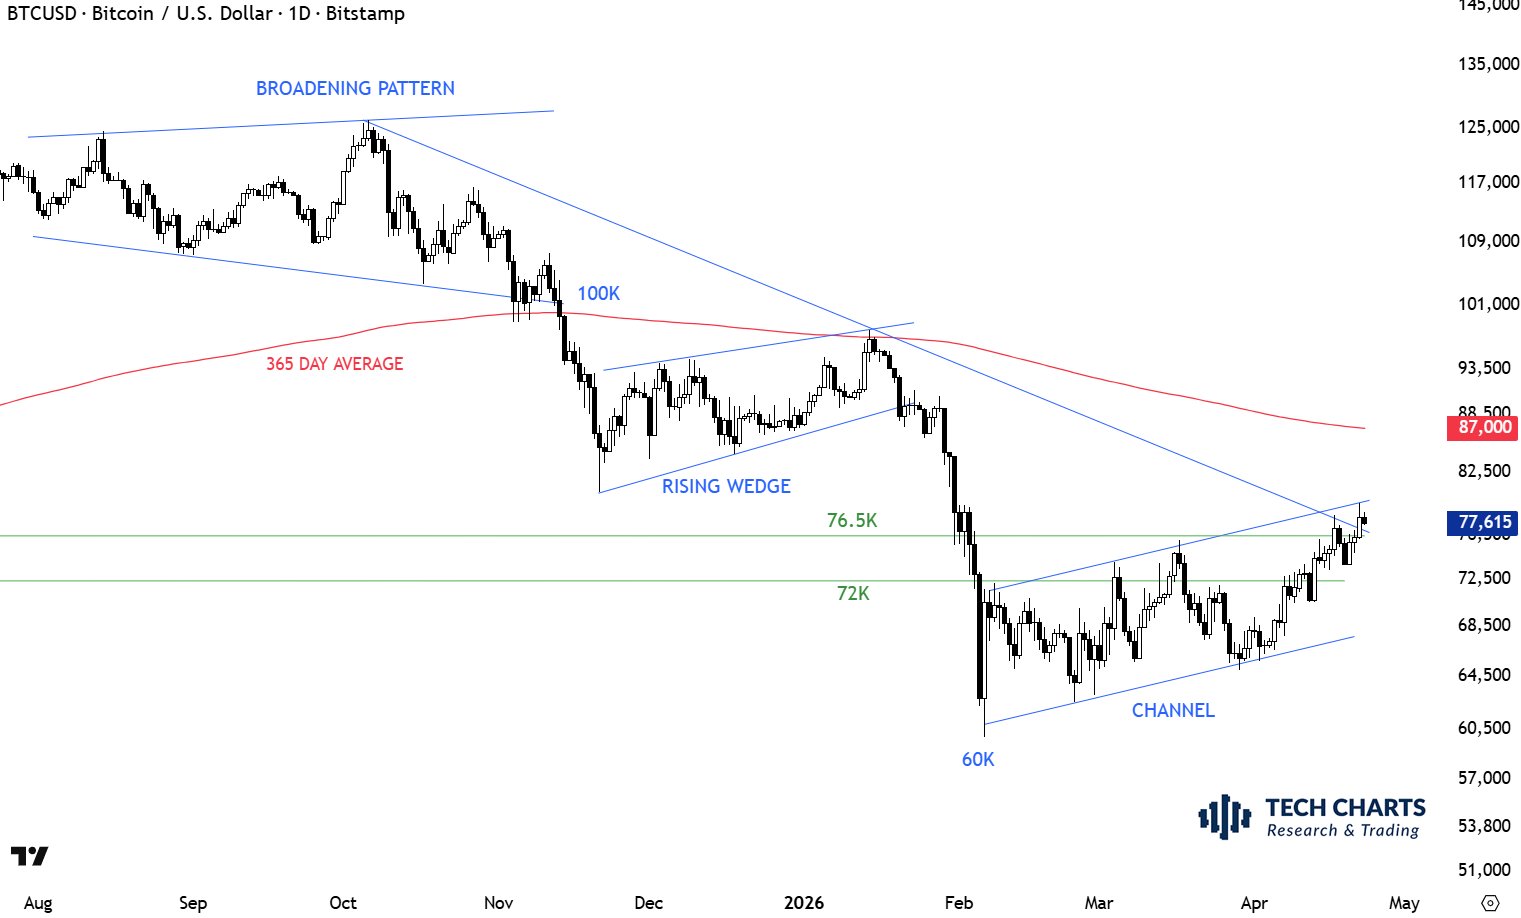
At press time, Bitcoin was trading at $78,196-a figure so close to $80,000 it might as well be a dare. Nearby levels around $76,500 and $80,000 were the financial equivalent of a high-stakes game of musical chairs, with buyers and sellers all vying for the same seat. And yet, here we are, waiting for the market to finally stop pretending it’s a rollercoaster and just commit to a straight line.
Read More
- FRONT MISSION 3: Remake coming to PS5, Xbox Series, PS4, Xbox One, and PC on January 30, 2026
- Best Controller Settings for ARC Raiders
- Welcome to Demon School! Iruma-kun season 4 release schedule: When are new episodes on Crunchyroll?
- Taylor Sheridan’s Gritty 5-Part Crime Show Reveals New Final Season Villain
- From season 4 release schedule: When is episode 2 out on MGM+?
- Mark Zuckerberg & Wife Priscilla Chan Make Surprise Debut at Met Gala
- The Boys Season 5 Officially Ends An Era For Jensen Ackles’ Soldier Boy
- ‘The Bride!’ Review: Jessie Buckley Breathes Life into a Monstrous Mess
- Invincible Season 4 Episode 4 Post-Credits Unveils a Demonic Return & More
- Meet the cast of Good Omens season 3: All the actors and characters
2026-04-25 05:10